- 1Department of Automation, Rocket Force University of Engineering, Xi’an, China
- 2School of Computer Science, Hubei University of Technology, Wuhan, China
- 3The Institute of Technological Sciences, Wuhan University, Wuhan, China
Introduction: Optical and SAR image matching is one of the fields within multi-sensor imaging and fusion. It is crucial for various applications such as disaster response, environmental monitoring, and urban planning, as it enables comprehensive and accurate analysis by combining the visual information of optical images with the penetrating capability of SAR images. However, the differences in imaging mechanisms between optical and SAR images result in significant nonlinear radiation distortion. Especially for SAR images, which are affected by speckle noises, resulting in low resolution and blurry edge structures, making optical and SAR image matching difficult and challenging. The key to successful matching lies in reducing modal differences and extracting similarity information from the images.
Method: In light of this, we propose a structure similarity virtual map generation network (SVGNet) to address the task of optical and SAR image matching. The core innovation of this paper is that we take inspiration from the concept of image generation, to handle the predicament of image matching between different modalities. Firstly, we introduce the Attention U-Net as a generator to decouple and characterize optical images. And then, SAR images are consistently converted into optical images with similar textures and structures. At the same time, using the structural similarity (SSIM) to constrain structural spatial information to improve the quality of generated images. Secondly, a conditional generative adversarial network is employed to further guide the image generation process. By combining synthesized SAR images and their corresponding optical images in a dual channel, we can enhance prior information. This combined data is then fed into the discriminator to determine whether the images are true or false, guiding the generator to optimize feature learning. Finally, we employ least squares loss (LSGAN) to stabilize the training of the generative adversarial network.
Results and Discussion: Experiments have demonstrated that the SVGNet proposed in this paper is capable of effectively reducing modal differences, and it increases the matching success rate. Compared to direct image matching, using image generation ideas results in a matching accuracy improvement of more than twice.
1 Introduction
With the advancement of satellite remote sensing technology [1], the means of data acquisition are constantly being enriched. How to effectively integrate multi-sensor, high-resolution, multi-spectral, and multi-temporal remote sensing data for fusion processing has become a hot and key research topic in the field of remote sensing at present. Multi-source image matching [2, 3], especially the matching between optical and SAR images [4, 5], is one of the core problems that urgently needs to be solved. However, due to the completely different imaging mechanisms, there are radiation anomalies, geometric differences, and scale differences between optical and SAR images. This increases the difficulty of image matching and makes SAR and optical image matching an international challenge.
Currently, multi-modal image matching can be categorized into three main types: region-based matching, feature-based matching, as well as deep learning-based matching. Region-based image matching places emphasis on comparing local regions in the images by calculating grayscale information and establishing correlation signals. Common similarity measurement functions [6] include SSD, NCC, MI, and PC. However, region-based matching methods are sensitive to nonlinear grayscale distortions, making them less suitable for multi-modal image matching. Feature-based matching methods [7] extract common features from reference and target images and establish correspondences to determine the transformation model parameters for matching. These features include region features, line features (extracted from edges and texture information) and point features. Point features are the most extensively studied, involving the extraction of key points with certain invariance properties and their description using specific descriptors. Common methods for point feature extraction include Harris corner detection, SIFT [8], and SURF [9]. Researchers have also proposed geometric structure-based feature [10] descriptors like HOPC, CFOG and RIFT [11] to meet the requirements of multi-modal images. Feature-based matching methods provide higher-level information beyond grayscale and offer adaptability to grayscale variations, image deformations, and occlusions, thereby broadening the application scope of image matching techniques.
The popular deep learning methods in recent years are mainly divided into single-loop deep neural network and end-to-end deep networks. Single-loop deep neural networks include D2-Net, Superglue, and so on. End-to-end deep networks include MUNIT-based multi-modal image matching, Dual-Attention Networks for multi-modal image matching, Cross-Modal Feature Fusion and generative adversarial networks (GAN). Furthermore, the basic ideas of style transfer methods [12] and end-to-end patterns are the same. By utilizing deep learning networks [13] to obtain optical image features, replicate attributes originating from SAR data onto optical representations, and then match them using traditional methods, such as SIFT, SURF, and RIFT. The goal of these approaches is to maintain consistency [14] between the transformed SAR images and the original images, followed by feature matching with traditional methods. These methods require further research on the depth matching framework, the loss function [15], and training strategies with the intention of improving matching performance for heterogeneous remote sensing image matching.
Consequently, the pursuit of efficacious strategies to mitigate feature matching discrepancies bears substantial practical research implications. This is done by enhancing consistency between generated and original images, and achieving robust matching of heterogeneous images. In light of this, we study style transfer methods and perform feature transformation on SAR images. This is to ensure that the traits of the generated SAR image align with those of the corresponding optical image, thereby optimizing the matching of heterogeneous images.
In this paper, we propose the SVGNet to seek effective methods for reducing modal differences. This framework leverages Conditional Generative Adversarial Network (CGAN), Attention U-Net, SSIM, and LSGAN to generate virtual maps and optimize multi-modal image matching. Specifically, for feature learning without the need for additional supervision, we employ Attention U-Net with attention gates that automatically focus on salient feature regions during feature learning. Therefore, we utilize Attention U-Net as the generator to extract image features. Additionally, we transform the task of multi-modal image matching into the task of reducing modality differences, for which CGAN is employed to generate virtual maps and minimize modality disparities. By incorporating conditional constraints, CGAN controls the details of image generation to achieve desired effects, making this model exceptionally effective. Finally, to optimize the overall training performance of the generative model and improve the realism of generated images, we utilize SSIM to constrain spatial information and enhance image quality. Simultaneously, LSGAN is employed to stabilize SVGNet training. To validate the effectiveness of our proposed method, we conduct extensive experiments to demonstrate SVGNet’s superiority over other generative adversarial networks. We also demonstrate the quality of our generated virtual maps. The results indicate that SVGNet has advantages in the direction of multi-modal image matching. The major contributions of this paper can be summarized as follows:
1. We introduce SVGNet, an innovative approach to meet the challenges of optical and SAR image matching.
2. We employ CGAN to reduce dissimilarities between matched images and generate superior-quality images specifically tailored for matching task.
3. We adopt an Attention U-Net in a decoder module, to extract and learn features from optical images to better focus on relevant regions of the images.
4. We utilize SSIM and LSGAN losses to amplify the model’s optimization performance and foster training stability.
5. We conduct extensive experiments to study in detail the high-quality impact of the generating virtual maps and the superior performance of the network.
The results show that the SVGNet proposed in this paper shows superiority in the quantitative analysis of optical and SAR image matching.
2 Related work
In the most recent years, deep learning [16] has gained attention and accomplished significant advancements in fields like visual cognition and natural language understanding. Researchers have proposed deep learning-based methods [17] for multi-source image matching. These methods can be categorized into two aspects:
2.1 Single-loop deep neural network
Single-loop deep neural network, which only replaces some matching links, is often more flexible and can meet different needs by combining other advantageous structures to build a complete matching model. Numerous scholars harness the power of deep learning to meticulously detect a significantly enhanced and dependable set of salient critical points from images, adeptly acquiring the principal orientation or predominant scale for each individual feature point, along with refining more discriminative and correspondingly matchable feature descriptors. At the beginning, Dusmanu et al. [18] innovatively constructed the network structure D2-Net, which integrates detection features and feature description. The key points are extracted by slicing the feature map, using convolutional neural networks (CNN) to calculate the descriptors. By improving D2-net, MA et al. [19] demonstrated CMM-Net and applied it to multi-modal image matching. This method used dynamic adaptive Euclidian distance threshold and RANSAC algorithm to eliminate the wrong matching points and showed excellent matching effect in the image matching of alien remote sensing images. Hao et al. [20] designed a multi-level semantic extractor to extract rich and diverse semantic features from real images to effectively guide sample generation. Ma et al. [21] explored a matching method integrating deep learning with conventional local features from rough to fine, extracted deep features through CNN for rough matching, and then adjusted the rough matching results by combining more accurate local features, so as to produce more stable matching results. To learn descriptor representations of multimodal image blocks, Zhang et al. [22] used maximum positive sample and negative sample feature distances as loss functions in their full-convolutional neural network (FCN) built upon the Siamese network structure. Subsequently, Li et al. [10] presented a rotation-invariant multi-modal image matching method grounded in deep learning jointly with Gaussian features. A neural architecture referred to as RotNET underwent training to forecast the rotational interrelationship among images. Subsequently, the alignment of two images was achieved through the establishment of gradient-oriented Gaussian pyramid features (GPOG). Some scholars also use deep learning to learn more reliable similarity measurement criteria and gross error elimination among descriptors. Sarlin et al. [23] designed a representative network superglue for feature matching and gross error elimination. This neural framework approaches the challenge of feature matching by framing it as the task of addressing the differentiable optimal transport quandary. Recurrent neural network (RNN) is constructed to solve this problem. Ma et al. [24] employed deep learning techniques to devise a gross error elimination network, denoted as LMR, bearing resemblance to the RANSAC algorithm. This approach translated the task of gross error elimination into a binary classification paradigm. The deep learning network was harnessed to assess the validity of each initial match pair, culminating in the successful mitigation of gross errors. These approaches leverage the robust deep feature extraction proficiency and the adeptness in high-dimensional feature representation offered by deep learning methodologies. By training a single network to replace a certain link in multi-modal image matching, these methods are combined with others to construct a comprehensive multi-modal image matching model, which has greater flexibility in use.
2.2 End-to-end deep neural network
Devise an end-to-end matching network directly predicated upon the principles of deep learning. The framework consists of three neural network structures for feature extraction, feature matching, and outlier removal, which provide excellent matching results pertaining to images obtained by optical and SAR techniques. In Hughes et al. [25], a neural network based algorithm for automatically matching multi-scale and multi-modal images has been developed, consisting of three neural network structures, corresponding to feature space extraction, matching based on feature space correlation functions, and outlier elimination, respectively. The matching effect for optical and SAR images is excellent. The KCG-GAN algorithm, as outlined in [26], incorporates K-means segmentation as an input modality for the image synthesis process. Through the imposition of spatial information synthesis constraints, it enhances the fidelity of synthesized imagery, and its application encompasses the realm of SAR and optical image alignment. Nevertheless, owing to the higher requirements of multi-modal image training data sets, and the complexity of imaging differences, mixed noise, and regional gray level differences between images. Sun et al. [27] described the LoFTR matching method of Canonical, which detects, describes, and matches image features on a coarse-grained basis, before refinement of the intensive subpixel matching on a fine-grained basis. Moreover, the Transformer model employs self-attention and cross-attention mechanisms as foundational components for generating feature descriptors from a pair of images. End-to-end networks can also be used to preprocess images, using techniques such as image synthesis and style transfer. Based on the imaging characteristics of different modal images, transform the style of images in different modalities, and used to expand the multi-modal image dataset or directly convert it into the same modal image form for matching.
3 Methods
3.1 Network architecture
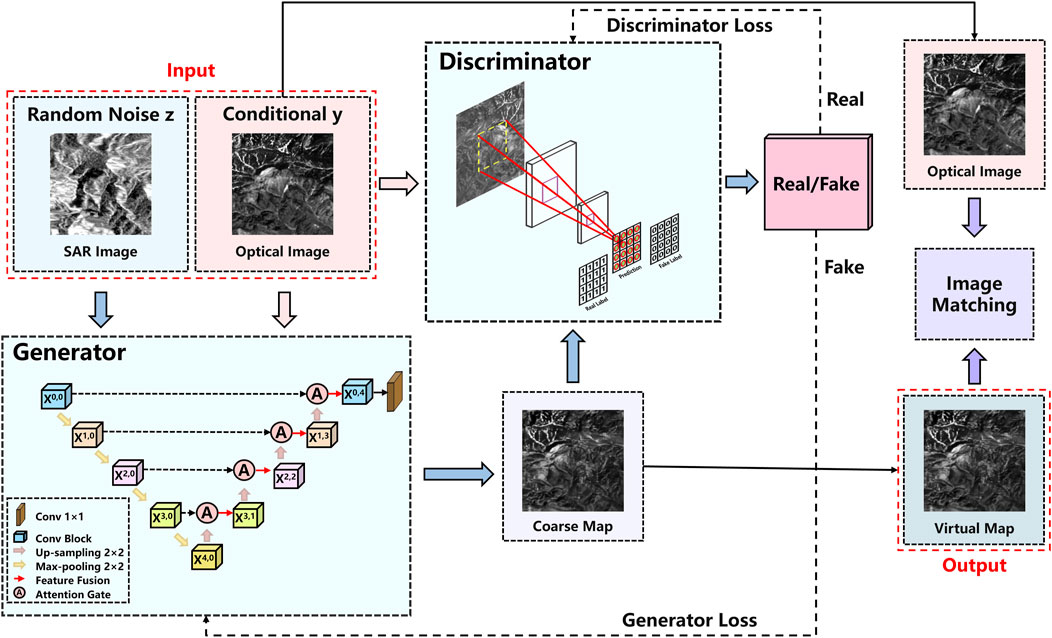
Our objective is to achieve a better matching effect between SAR images and optical images, and the key lies in reducing modal differences between them. As shown in Figure 1, the red box represents our proposed SVGNet based on GAN. By introducing the concept of style transfer, the network generates novel images that bridge the gap between single-mode and multi-modal datasets, showcasing the process of image-to-image conversion. The fundamental idea of SVGNet is to train the generative model through adversarial training. In other words, through mutual competition and learning, the generation model and the discrimination model are constantly improved to achieve the optimal state.
However, the unrestricted nature of GANs, lacking prior modeling, poses challenges in controlling them effectively for large-scale images with numerous pixels. To tackle this challenge, our proposition involves the incorporation of CGAN into the framework. According to Figure 1, the condition variable we use in this paper is the original optical image. By connecting the real optical image and its label, we can determine whether an image is a “real” image or a “fake” image. A fake label is generated as a condition for generating the optical image using the true optical image.
The proposed SVGNet has the following four improvements: (1) To enhance the network’s training capability and achieve desired data generation, we introduce CGAN and modify the unsupervised GAN [28] to a supervised GAN. This modification involves incorporating conditional information and adjusting the generator and discriminator. (2) This network uses Attention U-Net [29], which provides a more flexible structure, higher-quality image generation, and better preservation of semantic information than KCG-GAN. Optical images serve as conditional information, while the original SAR image labels serve as random noise. These two factors are fed into the generator in order to generate initial coarse maps, which then guide the optimization of feature learning. (3) On the other hand, the discriminator utilizes a fully convolutional neural network to ensure training stability and evaluate the authenticity of generated images. Optical images serve as conditional information, and the coarse map labels generated by the discriminator are used to evaluate authenticity. The discriminator plays a crucial role in determining the authenticity of refined maps. (4) Additionally, the losses of the generator and discriminator are computed. The SSIM is applied throughout the training process to enhance spatial constraints and improve image quality. Moreover, the training utilizes LSGAN to stabilize SVGNet. Once the losses reach saturation and a certain number of iterations are reached, a virtual map is generated.
With the generated virtual maps, we can perform better image matching. Below, we will discuss in more detail the specific modules and loss functions used in SVGNet.
3.1.1 Generative network
We propose to generate virtual maps to promote more efficient matching of optical and SAR images. Thus, in the generation network, it is essential for the generator to accurately and effectively extract the features of optical images. Furthermore, high-resolution input grids to high-resolution output grids are the hallmark of image-to-image transformation challenges. Additionally, the input and output appear differently on the surface, but they are both rendered with the same underlying structure. Consequently, the input and output structures are roughly aligned. We formulate the generator architecture with these considerations at its core. Therefore, we use Attention U-Net as a generator, as shown in the Generator module in Figure 1, which has image reconstruction capability and an attention mechanism. First, the proposed network consists of an encoder and a decoder. Specifically, the encoder learns the potential features of the original optical images, while the decoder is responsible for reconstructing from the low-level feature to the high-level feature to obtain the generated optical images.
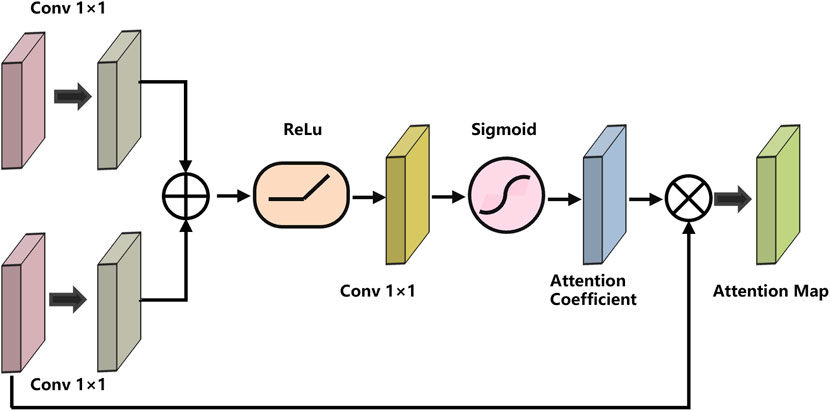
To simplify the description of the network, we refer the convolution layer [30], Batch Norm layer [31], and Rectified Linear Unit [32] as Conv, BN, and ReLu respectively. The structure of Attention U-Net can be seen in the generator module in Figure 1. The output of the node
In the equation, the functions
In general, the Attention U-Net network is used in this paper because it is capable of extracting image details well and retaining image information on different scales. The AG of Attention U-net improves the discernment and precision of the dense feature prediction model and improves the prediction accuracy. CGAN can effectively transform both deep feature information in the image and deep feature information that cannot be transformed. Attention U-Net encodes
3.1.2 Discriminant network
Compared to the original GAN discriminator, the Markov discriminator (Markovan Discriminator) is one of the discriminators in CycleGAN. As shown in Figure 1, the discriminant network is not implemented by utilizing various convolution layers that are then input into the connection layer or activation function, but by using a sliding window approach to determine whether individual patches are genuine and authentic. By upholding local coherence, this approach enables the generative network to discern finer-grained information from its contextual surroundings.
This paper divides the discriminant images into
3.2 Loss function
The loss functions used in this paper include the SSIM and LAGAN loss functions, which will be introduced in detail below.
(1) SSIM
Based on the network framework of CGAN, the algorithm replaces random noise as input. For supervised segmentation, we adopt SSIM loss [33] with the objective of making the segmentation map as close to the ground truth as possible. SSIM can be defined by Eq. 2:
Where
(2) LSGAN
Regular GAN loss can suffer from model collapse and is notoriously difficult to converge.
Due to the fact that LSGANs are more stable and have been shown in previous experiments to be capable of achieving better segmentation results, we adopt them as the loss function in our work [34], since they are more stable and have been shown to achieve better segmentation results. It is defined by Eq. 3:
Furthermore, the adversarial learning process can be notably enhanced by employing LSGAN, as expounded in Eq. 4 below:
In the Eqs 3, 4,
(3) Final loss function
The objective function for SVGNet is defined by Eq. 5:
where
4 Experiment and analysis
4.1 Datasets
This paper utilizes the widely-used SEN1-2 dataset [35], which provides a comprehensive collection of aligned Sentinel 1 SAR and Sentinel 2 optical images. In this context, the dataset consists of 282,384 image pairs with a resolution of 256 pixels and an 8-bit depth. It encompasses diverse geographical regions and countries, capturing various features such as cities, agricultural land, forests, mountains, and water bodies. The following three scenarios were selected for a comprehensive evaluation: rural (300 image pairs), semi-urban (300 image pairs), and urban (300 image pairs). The trained model then applies style transfer to the test set, generating images depicting cities, towns, and countryside landscapes. The dataset allows for a clear separation between training and testing data, enabling an unbiased performance evaluation. Notably, this dataset has been extensively used in deep learning-based alignment studies for SAR and optical images. Figure 3 provides representative samples from the dataset. There are three different scenarios: Rural, Semi-urban and Urban. Each group has optical images on the left and SAR images on the right.
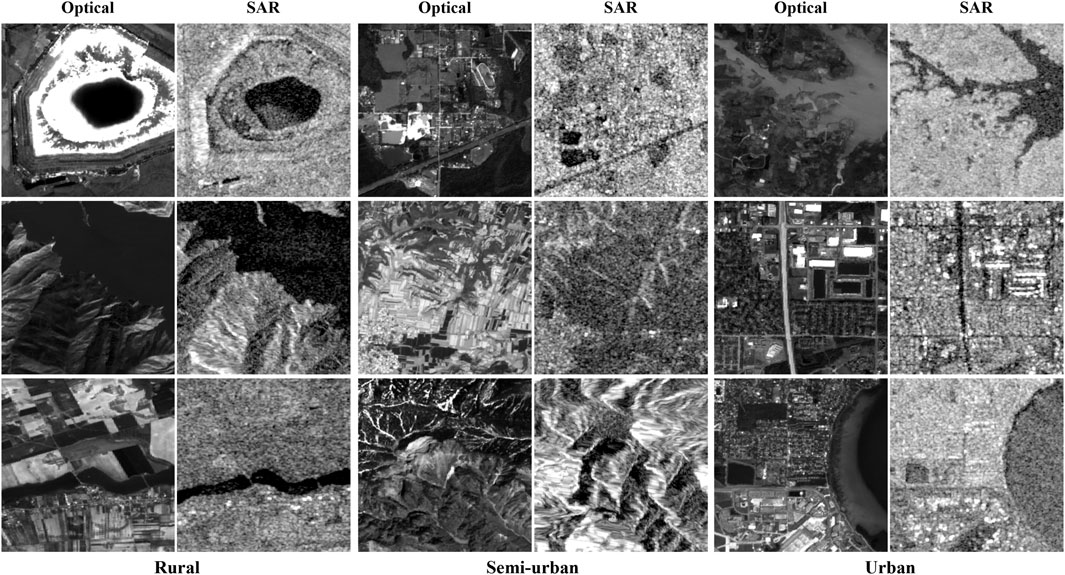
FIGURE 3. SEN1-2 data set. Three different scenarios: Rural, Semi-urban and Urban; Each group has optical images on the left and SAR images on the right.
4.2 Experimental details
4.2.1 Evaluation metrics
In this paper, we will analyze the quality of virtual maps and the effectiveness of image matching. Therefore, three metrics are selected for evaluating the effectiveness of image matching: NCM (Number of Correct Matching points), Matching success rate and RMSE (Root Mean Square Error) [16]. Evaluation Metrics for effectiveness of image matching are defined as follows:
(1) Number of Correct Matching points (NCM) indicates the number of feature points correctly matched between two images. Consequently, the higher the NCM value, the more accurate the matching results are.
(2) Matching Success Rate (MSR) is known as matching accuracy. It is a performance metric used to evaluate the accuracy of image matching algorithms. A higher matching correctness rate indicates a more reliable and accurate matching result, which is due to the algorithm’s ability to correctly identify and match corresponding points across the images. It is computed through the division of NCM by the total number of matched points. The formula can be defined as follows in Eq. 6:
(3) Root Mean Square Error (RMSE) means that the point coordinates of the same label in the benchmark image and the prepared matching image are labelled as
4.2.2 Parameter settings
All experimental endeavors are executed within the PyTorch framework, renowned for its adeptness in high-performance computation. For computation, a sole NVIDIA Tesla A100 GPU is deployed, replete with a GPU memory capacity of 80 GB. For the duration of the model’s training period, a batch size of 8 is employed, with each model undergoing a maximum of 1000 training epochs. The optimization process is facilitated by Adam, chosen for its efficacy, and initialized with a learning rate of 0.002 to circumvent issues tied to insufficient learning weight. To preclude overfitting during the training process, the early stopping technique is judiciously incorporated.
4.3 Image generation results and analysis
Visually, it is observable that the radiation difference between the SAR generated image and the original optical image is reduced. For certain images, such as the bottom row image in the Semi-urban group of Figure 4, the virtual maps generated by our SVGNet are almost identical to the optical images, with clear edge textures and nearly identical shapes. The grayscale is similar, the size, shape and relative position of the objects are almost the same. In virtual maps, the texture and fine features of the original optical image can be preserved. Several areas have been cut for enlargement display and quantitative analysis has been performed in order to better display the generation effect.
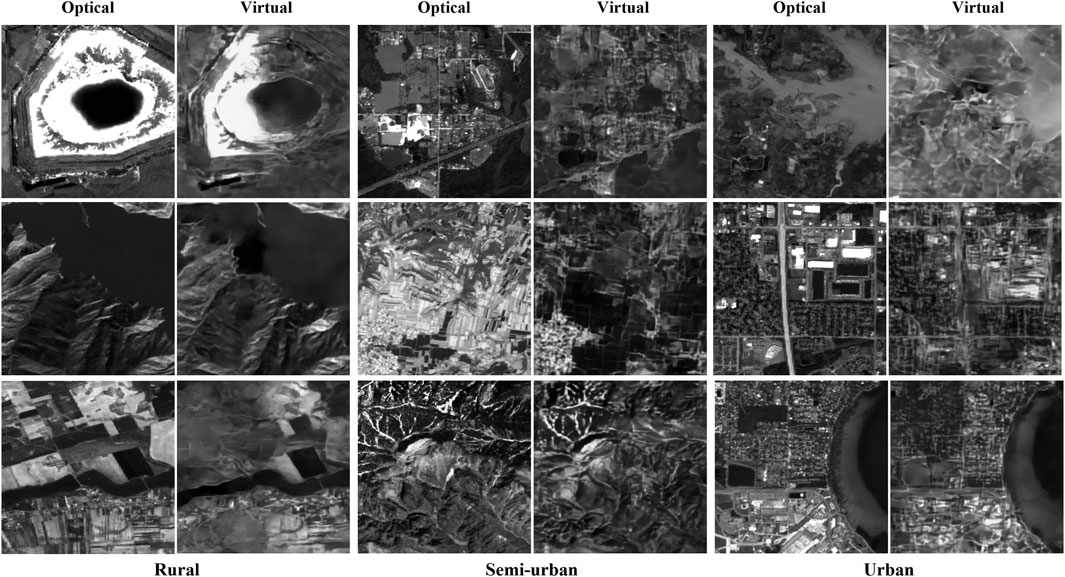
FIGURE 4. The performance of the virtual maps. There are three types of scenes: rural, semi-urban and urban, each of which shows 3 groups of images. In each group, the left column features the generated virtual maps, while the right column displays the corresponding original optical images.
For the purpose of quantitative analysis, we randomly selected 4 groups of data separately from the semi-urban and urban scenarios for testing. After that, random pixel values are extracted from rows and columns and drawn into one dimension for each group of graphs. To compare the pixel values of corresponding positions, the curve of pixel values of the two graphs is drawn on a graph, as shown in Figures 5, 6. In the result graph, it can be seen that the curve fitting degree of the pixel values is extremely high, which indicates that the virtual maps generated by SVGNet method are very similar to the optical original image, and the effect is truly remarkable.
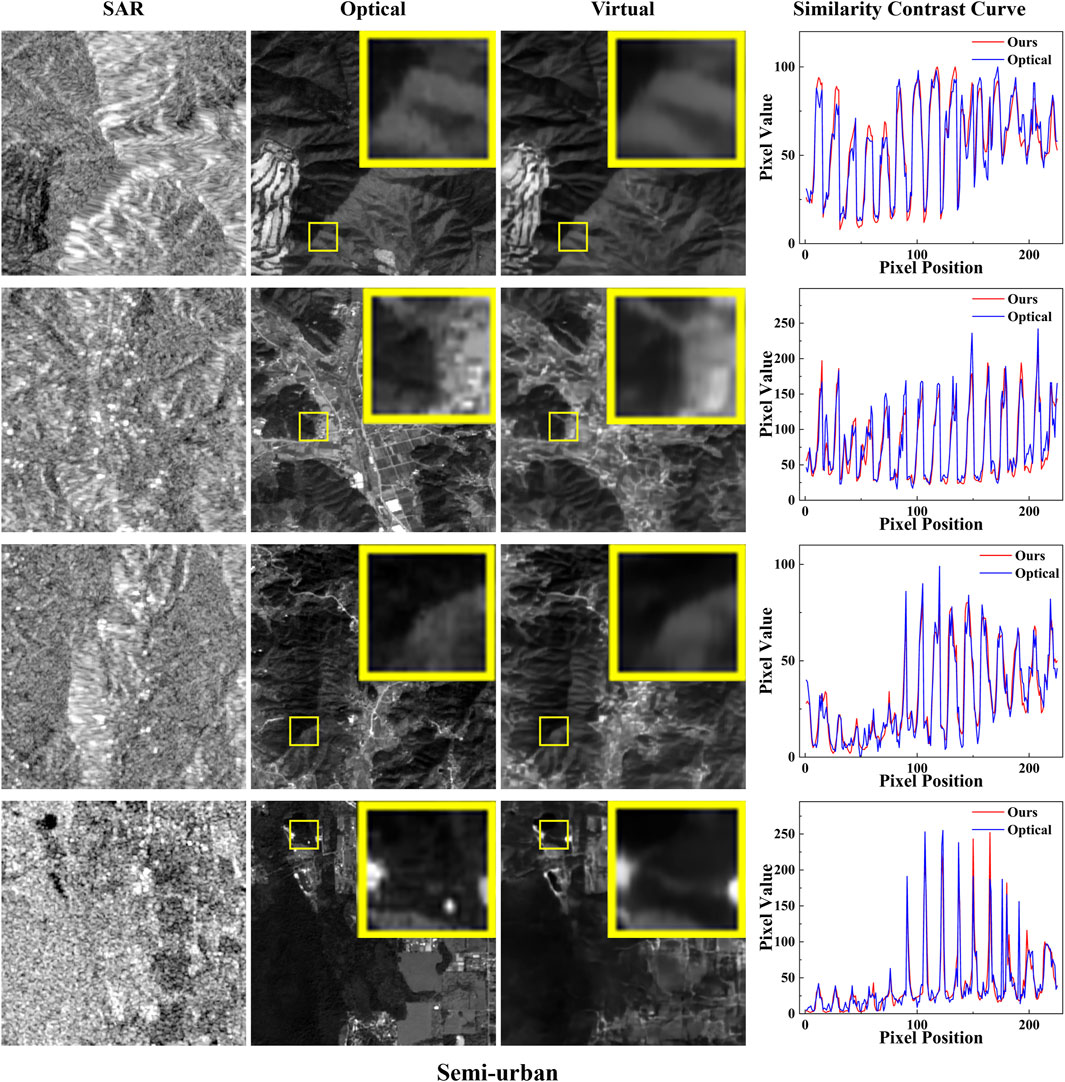
FIGURE 5. Comparison of virtual maps and optical images in the semi-urban group. From left to right are the corresponding SAR image, optical image, generated virtual maps and pixel contrast curve of the virtual maps; Mark the randomly selected test area with a pixel size of
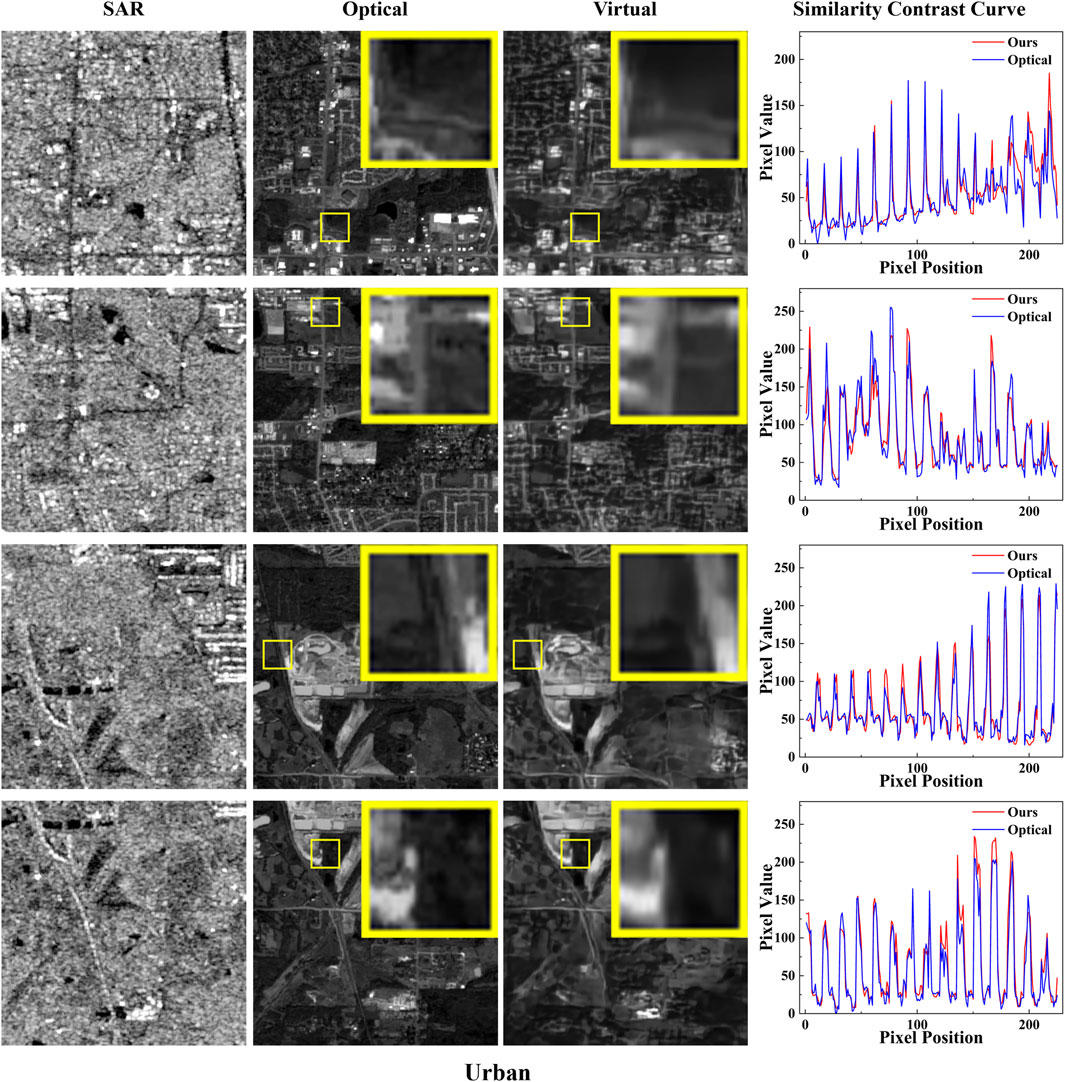
FIGURE 6. Comparison of virtual maps and optical images in the Urban group. From left to right are the corresponding SAR image, optical image, generated virtual maps and pixel contrast curve of the virtual maps; Mark the randomly selected test area with a pixel size of 30 × 30 with a yellow box and place it at the image’s upper right corner; Contrast curve of pixel values (red: the virtual maps generated by us; blue: corresponding optical image; horizontal axis: pixel position; vertical axis: corresponding pixel value).
4.4 Matching effect comparison and analysis
We compare SVGNet for image matching from two perspectives in this paper in order to evaluate its effectiveness: (1) Comparing the generated adversarial network between KCG-GAN and SVGNet in this paper, the matching method adopts the traditional RIFT algorithm; (2) Comparison of matching methods. This paper compares the proposed method to three baseline methods, including LoFTR, D2-Net, and Superglue. LoFTR is an end-to-end deep network, while D2-Net and Superglue are single-loop networks. Initially, LoFTR establishes coarse-grained image feature detection and matching, and then refines subpixel-level intensive matching to refine the results. Furthermore, Transformer uses both self-attention layers in order to obtain feature descriptors for two images, and it also utilizes mutual attention layers in order to do so. D2-Net innovatively constructs a network structure integrating detection features and feature descriptions. Descriptors were calculated by slicing CNN feature maps, and then key points are extracted by calculating descriptors. Superglue solves this problem by treating the feature matching problem as solving the differentiable optimal transport problem, and then constructing the RNN.
4.4.1 Visual performance
The traditional feature matching method, RIFT, is selected for feature extraction. We compare the generated networks between KCG-GAN and SVGNet in this paper. Compared with KCG-GAN, our SVGNet virtual maps are more realistic and have high optical consistency. In the texture of KCG-GAN maps, details and surrounding areas are more discordant, and the edges and textures are not as clear as our virtual maps.
From Figure 7, it can be observed that the matching performance of the generated images by KCG-GAN is inferior, with fewer matching points. This can be attributed to the fact that KCG-GAN may not fully preserve the semantic information of the original SAR images during the transformation process to optical images. A comparison between the virtual maps and true optical images may reveal differences in terms of object shape, structure, and other aspects, leading to less accurate matching. Moreover, KCG-GAN’s training process may be unstable, such as difficulties in achieving a proper balance between the generator and discriminator or issues such as gradient vanishing or exploding. These factors can hinder network convergence, thereby impacting the quality of generated images and the matching effectiveness. By contrast, our approach demonstrates better matching performance with a higher number of matching points and a higher proportion of correct matches between virtual and optical images. To conclude, our SVGNet generated is superior to the KCG-GAN.
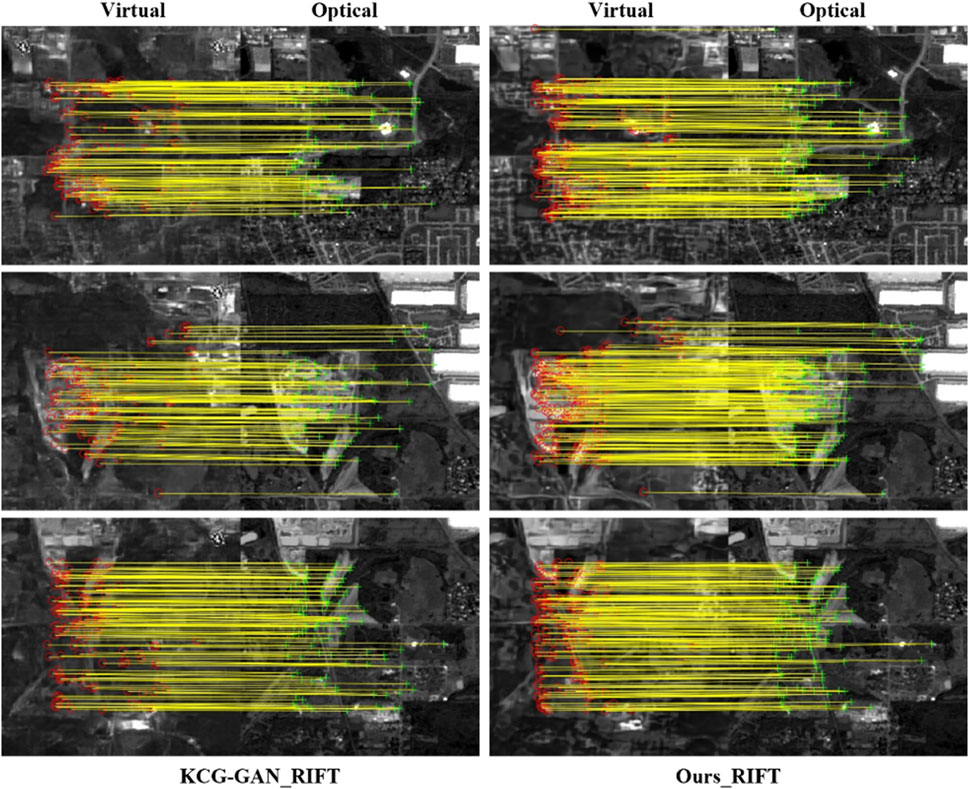
FIGURE 7. Comparison between KCG-GAN and SVMNet with RIFT matching method. The left column of each figure uses KCG-GAN, and the right side is our SVGNet in this paper. On the left side of each set of images are the generated images and on the right side are the optical images.
Demonstrated by Figure 8, we compare the matching methods, including LoFTR [27], D2-Net and Superglue [23]. The matching results of our virtual maps and optical images are better than those of the original SAR images and optical images. Considering the fact that the virtual maps generated by our SVGNet can compensate for the loss of information that may occur when the optical and SAR images are considered separately, we can provide a better level of visual information, and we can integrate the visual information and feature representation capabilities of the optical and SAR images. The virtual maps we created retain not only the shape and structure information obtained from SAR on the target, but they also retain the advantages of optical maps in terms of color and detail. These images contained many incorrect matching points, and the number of matching points is relatively small between the original SAR images and the optical images. In contrast, the virtual maps we generated match the optical images better, with more matching points, almost 10 times more than the non-generated matching results, which is a huge improvement, and the results are exciting. It shows that the virtual map generated by our generation network works well.
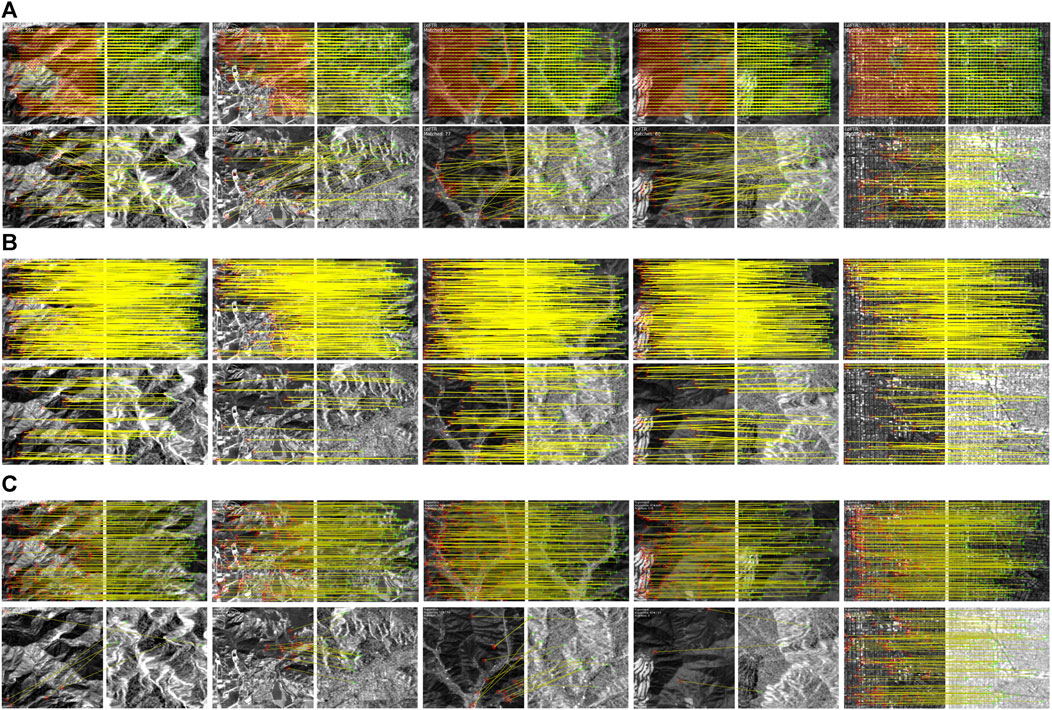
FIGURE 8. Comparison and display of image matching effect before and after generation. (A–C) represent three deep learning-based matching methods: (A) LoFTR; (B) D2-Net; (C) Superglue. In each method, the top row showcases the results of image matching after generation, while the bottom row shows the results of image matching before generation.
Overall, SVGNet reduces modal differences and achieves the desired effect. A quantitative analysis of matching methods comparison is presented in the following subsection.
4.4.2 Quantitative analysis
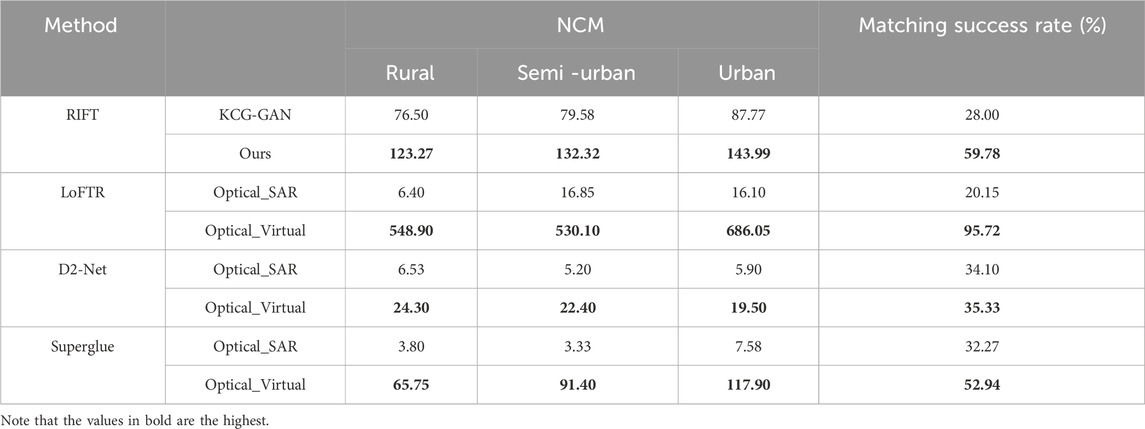
To conduct a quantitative comparison of the effectiveness of our SVGNet, the results are presented in Table 1, which includes a comparison between KCG-GAN and SVGNet, along with a comparison of the generated images before and after applying the three deep learning methods.
The upper part of Table 1 presents comparison of KCG-GAN and SVGNet, showing NCM results and the matching success rate. In three different scenarios, our generative network outperforms KCG-GAN in both NCM and matching success rate. The number of correct matching points is nearly 1.3 times higher than that of KCG-GAN, and our matching success rate (59.78%) is higher than that of KCG-GAN. SVGNet image generation ideas result in a more than double improvement in matching accuracy over direct image matching. Furthermore, our SVGNet improves the RIFT feature matching, indicating the efficiency of the proposed method.
Meanwhile, the bottom half of Table 1 showcases the comprehensive evaluation of three deep learning-based matching methods: LoFTR, D2-Net and Superglue. We use virtual maps generated by the SVGNet to calculate the NCM of matched images and the matching success rate. Prior to the generation of virtual maps, the NCM and matching success rates of the three matching methodologies in the three scenarios were significantly lower. The NCM of LoFTR with the greatest matching effect is almost 85.76 times that of SAR in virtual maps in rural scenes, and 686.05 in urban scenes. In addition, the overall matching success rate of virtual maps using LoFTR matching method reached 95.72%, which was about 4.75 times before the generation. The NCM of D2-Net matching method is about 3.72 times higher after generation, and the matching success rate is also higher than before generation. The NCM of the Superglue matching method in the semi-urban scenario is 27.44 times higher than before, and the matching success rate is also increased by 20.67%. In general, the matching effect after generation has been improved to different degrees under different matching methods. The virtual maps generated by our SVGNet have obtained inspiring results.
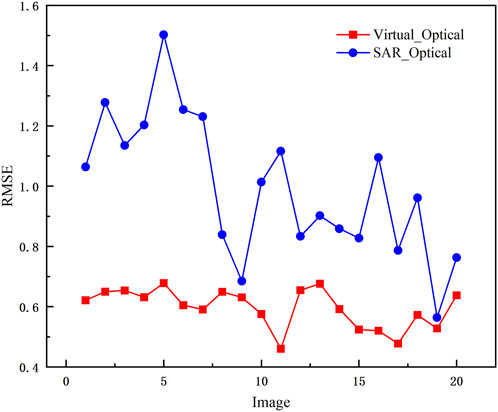
Our further evaluation of the accuracy and consistency of image matching consisted of the selection of 20 random images and the manual selection of 10 corresponding checkpoints distributed evenly on the graph after image correction. We use this method to determine the degree of difference between the predicted value and the true value, and a smaller RMSE indicates a more reliable prediction. In Figure 9, the virtual map generated by our SVGNet is shown to have lower RMSE than the original SAR image, achieving the lowest RMSE of 0.460 and the highest RMSE of 0.678. Each of the calculated images has a lower RMSE than the original SAR image. Raw SAR images and optical images have a RMSE of 0.564 in the lowest case and 1.502 in the highest case. Consequently, this result indicates that the proposed methodology can enhance matching effectiveness and effectively reduce the noise in the SAR images.
The analysis presented above illustrates the efficacy of the SVGNet for matching images. The evaluation of image matching algorithms using NCM, matching success rate, and RMSE metrics provides comprehensive insights into their performance. As a result of our study, our proposed SVGNet-based method provides superior performance in the generation of virtual maps and in the improvement of image matching accuracy.
4.5 Ablation experiment
In order to evaluate the effectiveness of AG (Attention Gate), SSIM (Structural Similarity), and the kw (sliding window), we conduct a large number of ablation experiments. The following table shows the results of the experiment. Specific experiments are as follows: (a) We remove the AG module from the generator; (b) Instead of using SSIM loss function, L1 is used instead; (c) We modify the size of the sliding window in the discriminator and replace the original 4 with 3, 5 and 7 respectively for the experiment.
The quantitative indicators are summarized in Table 2 below. We select a deep learning matching method LoFTR to evaluate the matching effect of the generated network. From the two indicators shown, removal of AG module, replacement of SSIM and different sliding window sizes will reduce the matching effect. In general, whether it is removing the AG module or replacing the SSIM used, or modifying the size of the sliding window, the matching effect will be reduced. Among them, in the network with AG module removed, although NCM is slightly higher than other methods, it has a certain advantage in matching points. However, to accurately compare the matching accuracy, it is necessary to calculate the MSR (Matching Success Rate). From the results, our results show that it is better than the network without AG module and other networks.

TABLE 2. Results of ablation experiments. (Red and blue bold letters represent the optimal and sub-optimal values, respectively. ✗ means not used, ✓ means used and numbers or specific content means alternative content.)
The visual performance of the ablation experiment is as follows. As shown in the Figure 10, in the process of matching images generated by various network modules (image A-E), there is a significant augmentation in the number of visual matching points. Notably, our SVGNet (image F) produces virtual graphs that exhibit superior matching results, characterized by the highest density of corresponding points. This underscores the effectiveness of SVGNet in enhancing the quality and richness of image matching outcomes compared to other modules. In general, the image generated by our SVGNet is better for matching, and the effect is good for different scenes.
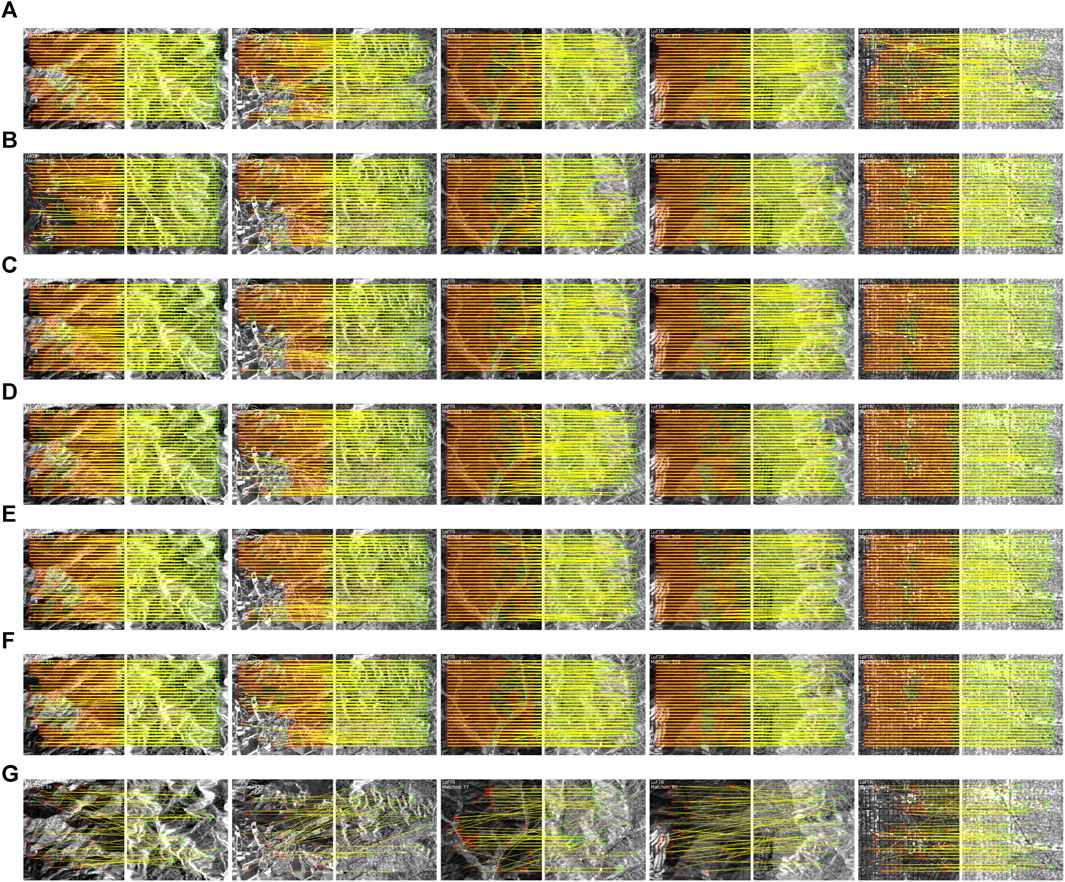
FIGURE 10. Visual performance of the ablation experiment. Use LoFTR for matching. A to H respectively represent: (A) no AG module; (B) The loss function uses L1 instead of SSIM; (C) kw = 3; (D) kw = 5; (E) kw = 7; (F) SVGNet; (G) not generated before the match.
5 Conclusion
The paper proposes the Structure Similarity Virtual Map Generation Network as a new generative adversarial network for matching optical and SAR images. The consistency transformation network constructs the U-Net network into a generating network to learn image textures and discover correlations between images. In order to deal with high frequency components effectively and reduce computation, the SSIM is used to reconstruct spatial information to improve image quality. In addition, LSGAN stabilizes GAN training. It has been shown by numerous experiments that NCM and matching success rates are higher for both the comparison network and the comparison before and after the generation, particularly in the more advanced matching method LoFTR, which has an overall matching success rate of 95.72% and a lower RMSE than the non-generated matching method. By using SVGNet in this paper, the virtual maps generated are more realistic. This diminishes the modal difference between SAR and optical images, mitigates the challenge of matching heterosource images and enhances the robustness of the model.
In the future, geometric feature-based approaches can be used to reduce modality differences and improve image alignment in SAR and optical image matching. By incorporating geometric cues and constraints, we aim to achieve more accurate and robust image matching results. This novel perspective will complement existing style transfer-based methods and pave the way for a comprehensive and effective framework for multi-modal image registration and analysis in diverse real-world applications.
Data availability statement
Original datasets are available in a publicly accessible repository: The original contributions presented in the study are publicly available. This data can be found here: https://mediatum.ub.tum.de/1474000.
Author contributions
SC: Conceptualization, Funding acquisition, Project administration, Supervision, Writing–review and editing. LM: Conceptualization, Data curation, Investigation, Methodology, Resources, Software, Supervision, Validation, Visualization, Writing–original draft.
Funding
The author(s) declare financial support was received for the research, authorship, and/or publication of this article. This research is funded by the National Natural Science Foundation of China (62276274); Hubei Province Young Science and Technology Talent Morning Hight Lift Project (202319).
Conflict of interest
The authors declare that the research was conducted in the absence of any commercial or financial relationships that could be construed as a potential conflict of interest.
Publisher’s note
All claims expressed in this article are solely those of the authors and do not necessarily represent those of their affiliated organizations, or those of the publisher, the editors and the reviewers. Any product that may be evaluated in this article, or claim that may be made by its manufacturer, is not guaranteed or endorsed by the publisher.
References
1. Zhang L, Zhang L. Artificial intelligence for remote sensing data analysis: a review of challenges and opportunities. IEEE Geosci Remote Sensing Mag (2022) 10:270–94. doi:10.1109/mgrs.2022.3145854
2. Yao Y, Zhang Y, Wan Y, Liu X, Yan X, Li J. Multi-modal remote sensing image matching considering Co-occurrence filter. IEEE Trans Image Process (2022) 31:2584–97. doi:10.1109/TIP.2022.3157450
3. Liu J, Zhang Y, Li F. Infrared and visible image fusion with edge detail implantation. Front Phys (2023) 11:1180100. doi:10.3389/fphy.2023.1180100
4. Quan D, Wei H, Wang S, Lei R, Duan B, Li Y, et al. Self-distillation feature learning network for optical and SAR image registration. IEEE Trans Geosci Remote Sensing (2022) 60:1–18. doi:10.1109/tgrs.2022.3173476
5. Ye Y, Yang C, Zhang J, Fan J, Feng R, Qin Y. Optical-to-SAR image matching using multiscale masked structure features. IEEE Geosci Remote Sensing Lett (2022) 19:1–5. doi:10.1109/lgrs.2022.3171265
6. Zhu B, Zhou L, Pu S, Fan J, Ye Y. Advances and challenges in multimodal remote sensing image registration. IEEE J Miniaturization Air Space Syst (2023) 4:165–74. doi:10.1109/jmass.2023.3244848
7. Misra I, Rohil MK, Manthira Moorthi S, Dhar D. Feature based remote sensing image registration techniques: a comprehensive and comparative review. Int J Remote Sensing (2022) 43:4477–516. doi:10.1080/01431161.2022.2114112
8. Bansal M, Kumar M, Kumar M. 2D object recognition: a comparative analysis of SIFT, SURF and ORB feature descriptors. Multimedia Tools Appl (2021) 80:18839–57. doi:10.1007/s11042-021-10646-0
9. Hassanin A-AIM, Abd El-Samie FE, El Banby GM. A real-time approach for automatic defect detection from PCBs based on SURF features and morphological operations. Multimedia Tools Appl (2019) 78:34437–57. doi:10.1007/s11042-019-08097-9
10. Li Z, Zhang H, Huang Y. A rotation-invariant optical and SAR image registration algorithm based on deep and Gaussian features. Remote Sensing (2021) 13:2628. doi:10.3390/rs13132628
11. Wang Z, Yu A, Zhang B, Dong Z, Chen X. A fast registration method for optical and SAR images based on SRAWG feature description. Remote Sensing (2022) 14:5060. doi:10.3390/rs14195060
12. Jing Y, Yang Y, Feng Z, Ye J, Yu Y, Song M. Neural style transfer: a review. IEEE Trans visualization Comput graphics (2019) 26:3365–85. doi:10.1109/TVCG.2019.2921336
13. Wang P, Fan E, Wang P. Comparative analysis of image classification algorithms based on traditional machine learning and deep learning. Pattern Recognition Lett (2021) 141:61–7. doi:10.1016/j.patrec.2020.07.042
14. Li X, Yu L, Chen H, Fu C-W, Xing L, Heng P-A. Transformation-consistent self-ensembling model for semisupervised medical image segmentation. IEEE Trans Neural Networks Learn Syst (2021) 32:523–34. doi:10.1109/tnnls.2020.2995319
15. Abu-Srhan A, Abushariah MAM, Al-Kadi OS. The effect of loss function on conditional generative adversarial networks. J King Saud Univ - Comput Inf Sci (2022) 34:6977–88. doi:10.1016/j.jksuci.2022.02.018
16. Ma J, Jiang X, Fan A, Jiang J, Yan J. Image matching from handcrafted to deep features: a survey. Int J Comput Vis (2020) 129:23–79. doi:10.1007/s11263-020-01359-2
17. Yang Z, Dan T, Yang Y. Multi-temporal remote sensing image registration using deep convolutional features. IEEE Access (2018) 6:38544–55. doi:10.1109/access.2018.2853100
18. Dusmanu M, Rocco I, Pajdla T, Pollefeys M, Sivic J, Torii A, et al. D2-net: a trainable cnn for joint detection and description of local features (2019). arXiv preprint arXiv:1905.03561.
19. Al-Masni MA, Kim D-H. CMM-Net: contextual multi-scale multi-level network for efficient biomedical image segmentation. Scientific Rep (2021) 11:10191. doi:10.1038/s41598-021-89686-3
20. Hao L, Shen P, Pan Z, Xu Y. Multi-level semantic information guided image generation for few-shot steel surface defect classification. Front Phys (2023) 11:1208781. doi:10.3389/fphy.2023.1208781
21. Ma W, Zhang J, Wu Y, Jiao L, Zhu H, Zhao W. A novel two-step registration method for remote sensing images based on deep and local features. IEEE Trans Geosci Remote Sensing (2019) 57:4834–43. doi:10.1109/tgrs.2019.2893310
22. Zhang H, Ni W, Yan W, Xiang D, Wu J, Yang X, et al. Registration of multimodal remote sensing image based on deep fully convolutional neural network. IEEE J Selected Top Appl Earth Observations Remote Sensing (2019) 12:3028–42. doi:10.1109/jstars.2019.2916560
23. Sarlin P-E, DeTone D, Malisiewicz T, Rabinovich A. Superglue: learning feature matching with graph neural networks. Proc IEEE/CVF Conf Comput Vis pattern recognition (2020) 4938–47.
24. Ma J, Jiang X, Jiang J, Zhao J, Guo X. LMR: learning a two-class classifier for mismatch removal. IEEE Trans Image Process (2019) 28:4045–59. doi:10.1109/tip.2019.2906490
25. Hughes LH, Marcos D, Lobry S, Tuia D, Schmitt M. A deep learning framework for matching of SAR and optical imagery. ISPRS J Photogrammetry Remote Sensing (2020) 169:166–79. doi:10.1016/j.isprsjprs.2020.09.012
26. Du W-L, Zhou Y, Zhao J, Tian X. K-means clustering guided generative adversarial networks for SAR-optical image matching. IEEE Access (2020) 8:217554–72. doi:10.1109/access.2020.3042213
27. Sun J, Shen Z, Wang Y, Bao H, Zhou X. LoFTR: detector-free local feature matching with transformers. Proc IEEE/CVF Conf Comput Vis pattern recognition (2021) 8922–31.
28. Zhang H, Le Z, Shao Z, Xu H, Ma J. MFF-GAN: an unsupervised generative adversarial network with adaptive and gradient joint constraints for multi-focus image fusion. Inf Fusion (2021) 66:40–53. doi:10.1016/j.inffus.2020.08.022
29. John D, Zhang C. An attention-based U-Net for detecting deforestation within satellite sensor imagery. Int J Appl Earth Observation Geoinformation (2022) 107:102685. doi:10.1016/j.jag.2022.102685
30. Kumar MS, Ganesh D, Turukmane AV, Batta U, Sayyadliyakat KK. Deep convolution neural network based solution for detecting plant diseases. J Pharm Negative Results (2022) 464–71. doi:10.47750/pnr.2022.13.S01.57
31. Lutfhi A, Rumini B. The effect of layer batch normalization and droupout of CNN model performance on facial expression classification. JOIV: Int J Inform Visualization (2022) 6:481–8. doi:10.30630/joiv.6.2-2.921
32. Macêdo D, Zanchettin C, Oliveira ALI, Ludermir T. Enhancing batch normalized convolutional networks using displaced rectifier linear units: a systematic comparative study. Expert Syst Appl (2019) 124:271–81. doi:10.1016/j.eswa.2019.01.066
33. Li J, Su J, Xia C, Ma M, Tian Y. Salient object detection with purificatory mechanism and structural similarity loss. IEEE Trans Image Process (2021) 30:6855–68. doi:10.1109/TIP.2021.3099405
34. Lee C-K, Cheon Y-J, Hwang W-Y. Least squares generative adversarial networks-based anomaly detection. IEEE Access (2022) 10:26920–30. doi:10.1109/access.2022.3158343
Keywords: structural similarity, multi-sensor, virtual map, image matching, deep learning, generative adversarial networks, SAR images
Citation: Chen S and Mei L (2024) Structure similarity virtual map generation network for optical and SAR image matching. Front. Phys. 12:1287050. doi: 10.3389/fphy.2024.1287050
Received: 01 September 2023; Accepted: 30 January 2024;
Published: 13 February 2024.
Edited by:
Huafeng Li, Kunming University of Science and Technology, ChinaReviewed by:
Feng Xu, Nanjing University of Posts and Telecommunications, ChinaJinxing Li, Harbin Institute of Technology, Shenzhen, China
Copyright © 2024 Chen and Mei. This is an open-access article distributed under the terms of the Creative Commons Attribution License (CC BY). The use, distribution or reproduction in other forums is permitted, provided the original author(s) and the copyright owner(s) are credited and that the original publication in this journal is cited, in accordance with accepted academic practice. No use, distribution or reproduction is permitted which does not comply with these terms.
*Correspondence: Liye Mei, bGl5ZW1laUB3aHUuZWR1LmNu
 Shiwei Chen1
 Liye Mei