 Tong Shao
 Xinliang Gao
 Yangguang Ke
 Quanming Lu1,2,3
94% of researchers rate our articles as excellent or good
Learn more about the work of our research integrity team to safeguard the quality of each article we publish.
Find out more
ORIGINAL RESEARCH article
Front. Phys., 28 May 2024
Sec. Space Physics
Volume 12 - 2024 | https://doi.org/10.3389/fphy.2024.1254024
This article is part of the Research TopicRadiation Belt Dynamics: Theory, Observation and ModelingView all 13 articles
Magnetosonic (MS) waves, i.e., ion Bernstein mode waves, are one of the common plasma waves in the Earth’s magnetosphere, which are important for regulating charged particle dynamics. How MS waves propagate in the magnetosphere is critical to understanding the global distribution of the waves, but it remains unclear. Although previous studies present that MS waves can be reflected by fine-scale density structures, the dissipation of waves by background plasma has long been neglected. In this study, we perform one-dimensional (1-D) particle-in-cell (PIC) simulations to study the propagation of MS waves through density structures, where both absorption and reflection have been included. We find that absorption is as important as reflection when considering the propagation of MS waves through density structures, and both of them are strongly dependent on the shape of density structures. Specifically, the reflectivity of MS waves is positively and negatively correlated with the height and width of density structures, respectively, while the absorptivity of MS waves has a positive correlation with both the height and width of density structures. Our study demonstrates the significance of absorption during the propagation of MS waves, which may help better understand the distribution of MS waves in the Earth’s magnetosphere.
Magnetosonic (MS) waves, also known as ion Bernstein mode waves, are one of the intense electromagnetic emissions observed in the Earth’s inner magnetosphere [1]. These waves were first detected by the OGO 3 satellite and named “equatorial noise” due to their occurrence within about
Understanding the propagation of MS waves in the Earth’s magnetosphere is crucial in comprehending the global distributions of these waves and their impact on energy transfer among different particle populations. Satellite observations indicate that the occurrence rate of MS waves strongly depends on the magnetic local time (MLT) outside the plasmapause, but remains nearly uniform inside the plasmapause [26]. This coincides with the scenario that MS waves are initially generated outside the plasmasphere in the noon and dusk sectors and then propagate both outward and inward, crossing the plasmapause and migrating globally over MLT [27,28]. Moreover, the occurrence rate and intensity of MS waves outside the plasmapause are higher than inside it [26] and the majority of MS waves inside the plasmapause have lower frequencies than the local proton cyclotron frequency [7,22], making radial propagation the most plausible explanation [5,6,29].
The propagation of MS waves is strongly influenced by the inhomogeneous background plasma density. By performing one-dimensional (1-D) full wave simulations with the finite difference time domain (FDTD) method, Liu et al. [30] have found that MS waves can propagate deep into the plasmasphere with only a small fraction of the MS wave power being reflected by the plasmapause. Instead, the fine-scale density structures near the outer edge of the plasmapause can effectively reflect MS waves. Such fine-scale density structures have been widely observed in the Earth’s magnetosphere [29,30–31]. However, previous simulations have also revealed that MS waves can be significantly damped by the background cold plasma [17,24,34], which was neglected in the study of Liu et al. [30] due to the limitation of their model. Therefore, we utilize the 1-D PIC model to simulate the propagation of MS waves through the fine-scale density structures, where both absorption and reflection have been considered. We have also quantified the reflectivity and absorptivity of MS waves passing through the density structure and investigated their dependences on the shape of the density structure.
In this study, we employ a 1-D PIC simulation model to investigate the effects of density structures on the propagation of MS waves. The background magnetic field
The angle between the wave vector and the background magnetic field is defined as
where P, D, R, L, and S are the Stix parameters [35,36] and
where qj, mj, and Ωcj denote the charge, mass, and cyclotron frequency of the j-component of plasma (j indicates p or e), respectively. In each run, the
For convenience, the density structure is assumed as the sinusoidal variation of density, so the plasma density as a function of r is given by Eq. 10:
where n0 is the ambient number density (outside the density structure), and H is the height of the density structure which is the ratio of the peak density to the ambient density
In the following section, we will present the simulation results of three runs in detail: Run 1 with
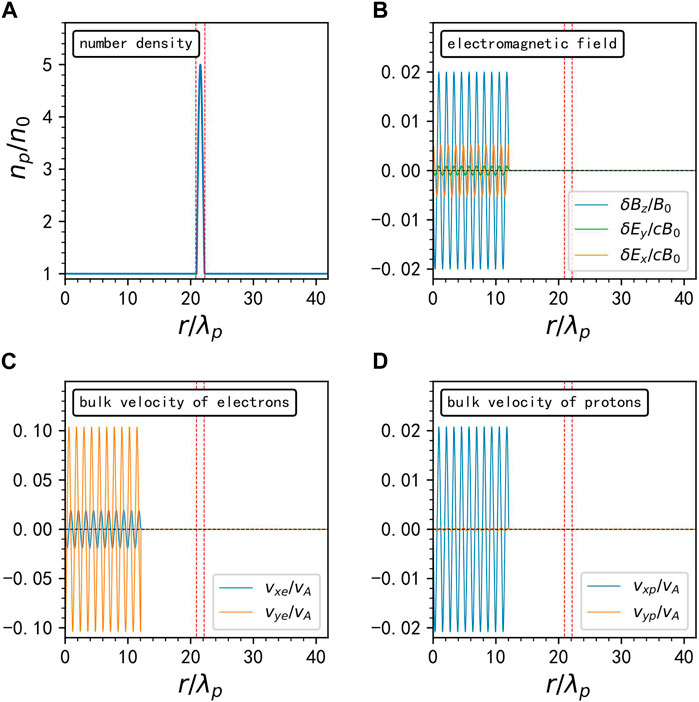
Figure 1. The initialization of the spatial distribution of (A) plasma number density, (B) wave fields
Figure 2 displays the propagation of the MS waves in Run 1 with a density structure and in Run 2 without it. Without the density structure, the MS waves propagate along the r direction (x-axis) with a constant speed of
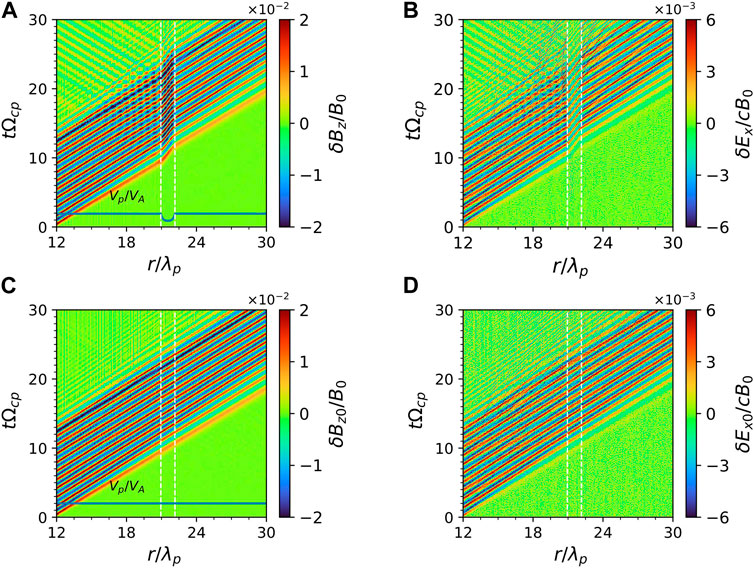
Figure 2. The temporal evolution of wave (A) magnetic field and (B) electric field in Run 1, and wave (C) magnetic field and (D) electric field in Run 2.The blue curves in (A, C) denote the variation of phase velocity along the simulation direction.
Figure 3A shows the time evolution of the energy of MS wave fields (orange line), the kinetic energy of charged particles (green line), and their sum (blue line) for Run 1. First of all, the total energy in our model is well conserved within a 0.06% margin of error. Secondly, it is clearly shown that the wave energy decreases as the particle kinetic energy increases with time, suggesting the wave dissipation takes effect during the propagation. We further display the time evolution of kinetic energies of protons and electrons inside the density structure in Figures 3B, C, respectively, where the vertical dashed lines mark the tie when the wave enters and leaves this structure. For both protons and electrons, their parallel kinetic energy remains nearly unchanged, since the perpendicular MS wave does not have the parallel electric field and cannot energize particles in the parallel direction. The perpendicular kinetic energy of protons
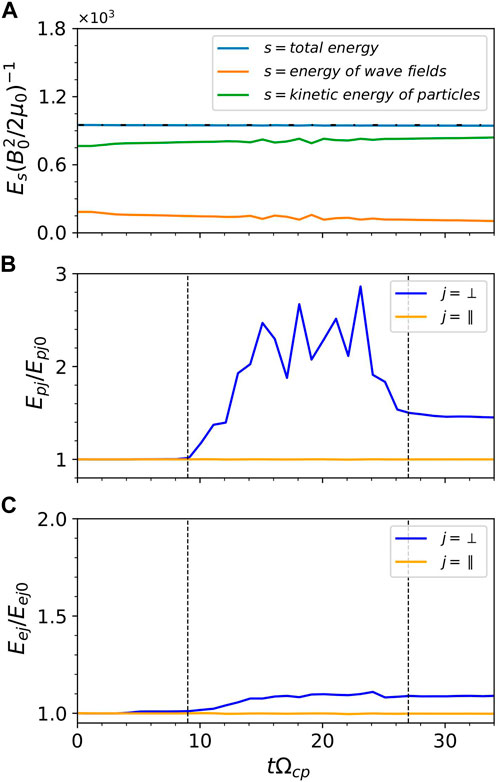
Figure 3. (A) The time evolution of the energy of the electromagnetic fields (green line), the kinetic energy of the particles (orange line), and their sum (blue line), respectively. The horizontal black dash-dotted line denotes the initial value of the total energy. The time evolution of kinetic energy of (B) protons and (C) electrons. Blue lines and orange lines denote the perpendicular direction and parallel direction, respectively.
To quantify the effects of the density structure on the propagation of MS waves, we need to calculate the reflectivity
where

Figure 4. The time evolution of the fluctuating magnetic field of (A) the incident MS wave (δBzi) and (B) reflected MS wave (δBzr) at the left boundary (x1 = 20.94λp) of the density structure, and of (C) the transmitted MS wave (δBzt) at the right boundary (x2 = 22.15λp) of the density structure for the Run 1. Red circles denote the wave peaks used to calculate the wave magnetic amplitude.
Furthermore, we have also studied the effects of the shape of density structure on the reflection and absorption of MS wave by considering the various widths
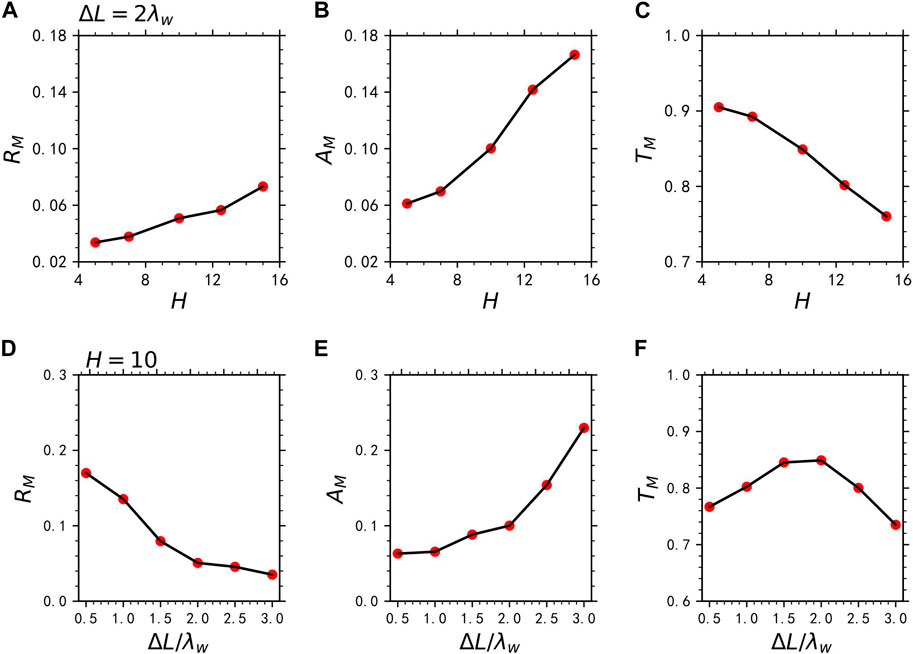
Figure 5. The (A) reflectivity
Besides the strictly perpendicular waves, we have also studied the propagation of MS waves with
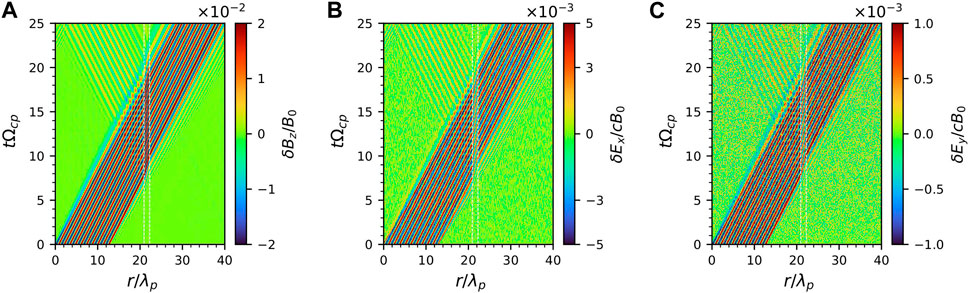
Figure 6. Temporal evolution of wave magnetic field (A)
Figure 7A displays the time history of the wave energy and particle kinetic energy for Run 3. The total energy (blue line) is well conserved in this simulation model, and the energy exchange between MS wave and plasma can be easily found. Figures 7B, C present the time evolution of the kinetic energies of protons and electrons inside the density structure, respectively. The perpendicular kinetic energy of protons and electrons inside the structure first increases as the wave enters the density structure and then decreases after the wave leaves, with a weak net increase. However, the parallel kinetic energy of electrons gradually increases when the wave passes through the structure and then remains nearly constant after the wave leaves. This is due to the efficient parallel heating of electrons by quasi-parallel MS waves (Supplementary Figure S2).
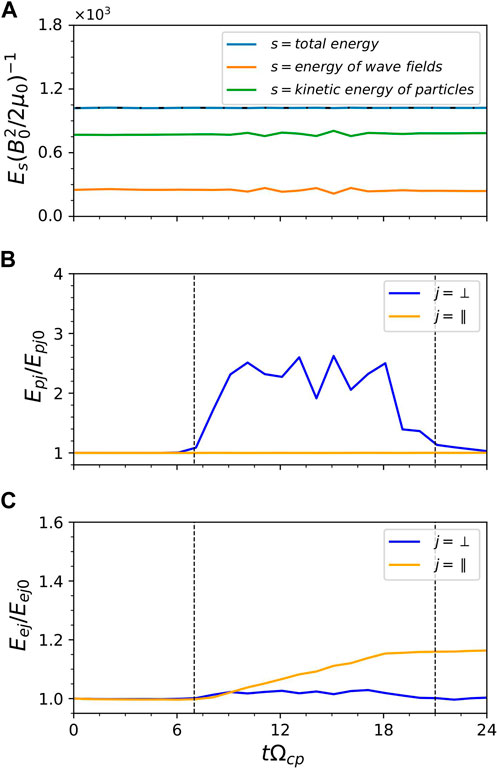
Figure 7. (A) The time evolution of the energy of the electromagnetic fields (green line), the kinetic energy of the particles (orange line), and their sum (blue line), respectively. The horizontal black dash-dotted line denotes the initial value of the total energy. The time evolution of kinetic energy of (B) protons and (C) electrons. Blue lines and orange lines denote the perpendicular direction and parallel direction, respectively.
We further investigate the effects of the shape of density structure on the reflection and absorption of the MS wave with
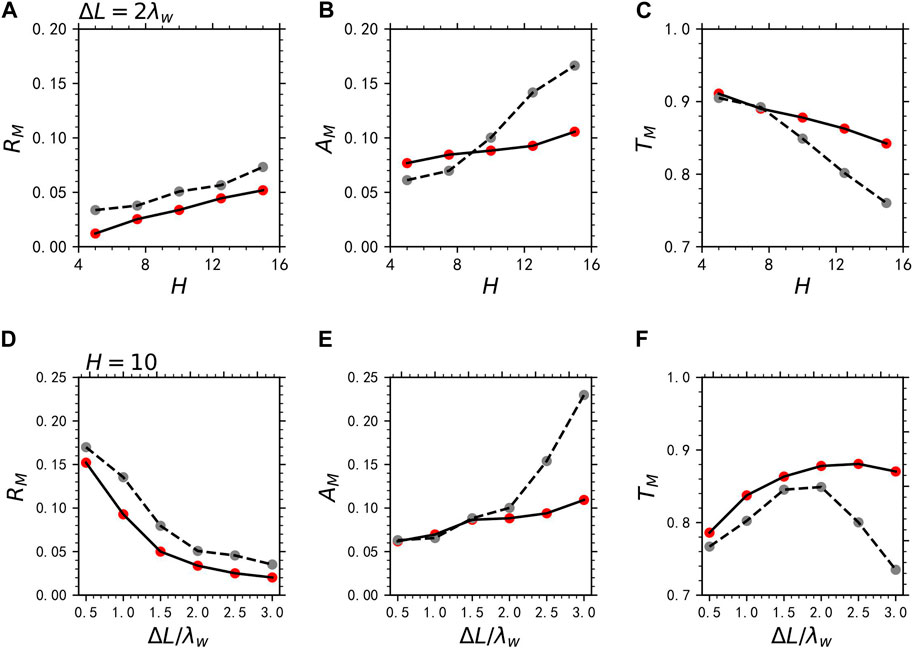
Figure 8. The (A) reflectivity
The effects of density structures on MS waves are important to understand the distribution and propagation of MS waves in the Earth’s magnetosphere, which are attracting more and more attention. However, previous simulations and theoretical models [30,36] only include the reflection of MS waves caused by the density structure. To include both the absorption and reflection of waves, we utilize a self-consistent model, i.e., PIC model, to study the propagation of MS waves across density structures. We find that both perpendicular and quasi-perpendicular propagating MS waves can be effectively reflected and absorbed by the fine-scale density structure. Generally, the absorption of MS waves is as important as the reflection when MS waves propagate through the density structure, and they are strongly dependent on the shape of the density structure. The reflection of MS waves is positively correlated with the height but is inversely related to the width of a density structure. While the absorption of MS waves is positively correlated with the height and width of a density structure. Our simulation results reveal that the absorption also plays an important role in the propagation of MS waves in the Earth’s magnetosphere, which can help better understand the properties and distribution of MS waves.
To obtain the reliable reflectivity, absorptivity, and transmissivity of the MS waves, we must ensure that the total energy of this system is conserved. As shown in Figures 3A, 7A, it is clear shown that the total energy is well conserved within a margin of error below 0.1%, which is much lower than the energy change (>5%) of charged particles or wave fields. This is true for all simulation runs in this study. Thus, the dependences of reflectivity and absorptivity of MS waves on the shape of density structure as shown in Figures 5, 8 are quite reliable. Since the reflectivity of MS wave is strongly dependent on the density gradient, so the
The original contributions presented in the study are included in the article/supplementary materials, further inquiries can be directed to the corresponding author/s. Figure data are available at https://cstr.cn/14804.41.sciencedb.space.00813.00D00D7D.
TS: Writing–original draft. XG: Writing–review and editing. YK: Writing–review and editing. QL: Writing–original draft, Writing–review and editing, Supervision. XW: Writing–original draft, Writing–review and editing, Validation.
The author(s) declare that no financial support was received for the research, authorship, and/or publication of this article. This work was supported by the NSFC grant 41774151, 42104155, B-type Strategic Priority Program of the Chinese Academy of Sciences, Grant No. XDB41000000.
The authors declare that the research was conducted in the absence of any commercial or financial relationships that could be construed as a potential conflict of interest.
All claims expressed in this article are solely those of the authors and do not necessarily represent those of their affiliated organizations, or those of the publisher, the editors and the reviewers. Any product that may be evaluated in this article, or claim that may be made by its manufacturer, is not guaranteed or endorsed by the publisher.
The Supplementary Material for this article can be found online at: https://www.frontiersin.org/articles/10.3389/fphy.2024.1254024/full#supplementary-material
1. Santolík O, Němec F, Gereová K, Macúšová E, de Conchy Y, Cornilleau-Wehrlin N. Systematic analysis of equatorial noise below the lower hybrid frequency. Ann Geophys (2004) 22:2587–95. doi:10.5194/angeo-22-2587-2004
2. Russell C, Holzer R, Smith E. OGO 3 observations of ELF noise in the magnetosphere: 1. Spatial extent and frequency of occurrence. J Geophys Res (1969) 74:755–77. doi:10.1029/JA074i003p00755
3. Russell CT, Holzer RE, Smith EJ. OGO 3 observations of ELF noise in the magnetosphere 2. The nature of the equatorial noise. J Geophys Res (1970) 75:755–68. doi:10.1029/JA075i004p00755
4. Gurnett DA. Plasma wave interactions with energetic ions near the magnetic equator. J Geophys Res (1976) 81:2765–70. doi:10.1029/JA081i016p02765
5. Xiao F, Zhou Q, He Y, Yang C, Liu S, Baker DN, et al. Penetration of magnetosonic waves into the plasmasphere observed by the Van Allen Probes. Geophys Res Lett (2015) 42:7287–94. doi:10.1002/2015GL065745
6. Ma Q, Li W, Thorne RM, Angelopoulos V. Global distribution of equatorial magnetosonic waves observed by THEMIS. Geophys Res Lett (2013) 40:1895–901. doi:10.1002/grl.50434
7. Boardsen SA, Hospodarsky GB, Min K, Averkamp TF, Bounds SR, Kletzing CA, et al. Determining the wave vector direction of equatorial fast magnetosonic waves. Geophys Res Lett (2018) 45(16):7951–9. doi:10.1029/2018GL078695
8. Kasahara Y, Kenmochi H, Kimura I. Propagation characteristics of the ELF emissions observed by the satellite Akebono in the magnetic equatorial region. Radio Sci (1994) 29(4):751–67. doi:10.1029/94RS00445
9. Ke Y, Chen L, Gao X, Lu Q, Wang X, Chen R, et al. Whistler-mode waves trapped by density irregularities in the earth's magnetosphere. Geophys Res Lett (2021) 48:e2020GL092305. doi:10.1029/2020GL092305
10. Meredith N, Horne R, Anderson R. Survey of magnetosonic waves and proton ring distributions in the Earth’s inner magnetosphere. J Geophys Res (2008) 113:A06213. doi:10.1029/2007JA012975
11. Min K, Němec F, Liu K, Denton RE, Boardsen SA. Equatorial propagation of the magnetosonic mode across the plasmapause: 2-D PIC simulations. J Geophys Res Space Phys (2019) 124:4424–44. doi:10.1029/2019JA026567
12. Bortnik J, Thorne RM. Transit time scattering of energetic electrons due to equatorially confined magnetosonic waves. J Geophys Res (2010) 115:A07213. doi:10.1029/2010JA015283
13. Bortnik J, Thorne RM, Ni B, Li J. Analytical approximation of transit time scattering due to magnetosonic waves. Geophys Res Lett (2015) 42:1318–25. doi:10.1002/2014GL062710
14. Horne RB, Thorne RM, Glauert SA, Meredith NP, Pokhotelov D, Santolık O. Electron acceleration in the Van Allen radiation belts by fast magnetosonic waves. Geophys Res Lett (2007) 34(17):L17107. doi:10.1029/2007GL030267
15. Horne RB, Wheeler GV, Alleyne HSCK. Proton and electron heating by radially propagating fast magnetosonic waves. J Geophys Res (2000) 105(27):27597–610. doi:10.1029/2000JA000018
16. Li X, Tao X. Validation and analysis of bounce resonance diffusion coefficients. J Geophys Res Space Phys (2018) 123:104–13. doi:10.1002/2017JA024506
17. Chen L, Sun J, Lu Q, Wang X, Gao X, Wang D, et al. Two-dimensional particle-in-cell simulation of magnetosonic wave excitation in a dipole magnetic field. Geophys Res Lett (2018) 45:8712–20. doi:10.1029/2018GL079067
18. Li J, Bortnik J, Thorne RM, Li W, Ma Q, Baker DN, et al. Ultrarelativistic electron butterfly distributions created by parallel acceleration due to magnetosonic waves. J Geophys Res Space Phys (2016) 121:3212–22. doi:10.1002/2016JA022370
19. Xiao FL, Yang C, Su ZP, Zhou QH, He ZG, He YH, et al. Wave-driven butterfly distribution of Van Allen belt relativistic electrons. Nat Commun (2015) 6(1):8590. doi:10.1038/ncomms9590
20. Ni BB, Zou ZY, Fu S, Cao X, Gu XD, Xiang Z. Resonant scattering of radiation belt electrons by off-equatorial magnetosonic waves. Geophys Res Lett (2018) 45(3):1228–36. doi:10.1002/2017GL075788
21. Yang C, Su Z, Xiao F, Zheng H, Wang Y, Wang S, et al. A positive correlation between energetic electron butterfly distributions and magnetosonic waves in the radiation belt slot region. Geophys Res Lett (2017) 44:3980–90. doi:10.1002/2017GL073116
22. Ma QL, Li W, Thorne RM, Bortnik J, Kletzing CA, Kurth WS, et al. Electron scattering by magnetosonic waves in the inner magnetosphere. J Geophys Res Space Phys (2016) 121(1):274–85. doi:10.1002/2015JA021992
23. Sun J, Gao X, Lu Q, Chen L, Liu X, Wang X, et al. Spectral properties and associated plasma energization by magnetosonic waves in the Earth’s magnetosphere: particle-in-cell simulations. J Geophys Res Space Phys (2017) 122:5377–90. doi:10.1002/2017JA024027
24. Yuan Z, Yu X, Huang S, Qiao Z, Yao F, Funsten HO. Cold ion heating by magnetosonic waves in a density cavity of the plasmasphere. J Geophys Res Space Phys (2018) 123:1242–50. doi:10.1002/2017JA024919
25. Zhou Q, Jiang Z, Yang C, He Y, Liu S, Xiao F. Correlated observation on global distributions of magnetosonic waves and proton rings in the radiation belts. J Geophys Res Space Phys (2021) 126:e2020JA028354. doi:10.1029/2020JA028354
26. Chen L, Thorne RM. Perpendicular propagation of magnetosonic waves. Geophys Res Lett (2012) 39:L14102. doi:10.1029/2012GL052485
27. Xiao F, Zhou Q, He Z, Tang L. Three-dimensional ray tracing of fast magnetosonic waves. J Geophys Res (2012) 117:A06208. doi:10.1029/2012JA017589
28. Santolík O, Parrot M, Němec F. Propagation of equatorial noise to low altitudes: decoupling from the magnetosonic mode. Geophys Res Lett (2016) 43:6694–704. doi:10.1002/2016GL069582
29. Liu X, Chen L, Yang L, Xia Z, Malaspina DM. One-dimensional full wave simulation of equatorial magnetosonic wave propagation in an inhomogeneous magnetosphere. J Geophys Res Space Phys (2018) 123:587–99. doi:10.1002/2017JA024336
30. Mauk BH, Fox NJ, Kanekal SG, Kessel RL, Sibeck DG, Ukhorskiy A. Science objectives and rationale for the radiation belt storm probes mission. Space Sci Rev (2013) 179(1):3–27. doi:10.1007/s11214-012-9908-y
31. Ma Q, Li W, Chen L, Thorne RM, Angelopoulos V. Magnetosonic wave excitation by ion ring distributions in the Earth’s inner magnetosphere. J Geophys Res Space Phys (2014) 119:844–52. doi:10.1002/2013JA019591
32. Boardsen SA, Hospodarsky GB, Kletzing CA, Pfaffff RF, Kurth WS, Wygant JR, et al. Van Allen Probe observations of periodic rising frequencies of the fast magnetosonic mode. Geophys Res Lett (2014) 41:8161–8. doi:10.1002/2014GL062020
33. Sun J, Lu Q, Wang X, Liu X, Gao X, Yang H. Modulation of magnetosonic waves by background plasma density in a dipole magnetic field: 2-D PIC simulation. J Geophys Res Space Phys (2021) 126:e2021JA029729. doi:10.1029/2021JA029729
35. Streltsov AV, Goyal R. Whistlers in micro ducts. J Geophys Research:SpacePhysics (2021) 126:e2021JA029868. doi:10.1029/2021JA029868
Keywords: magnetosonic wave, wave propagation, density structure, magnetosphere, paticlein-cell simulation, wave-particle interaction
Citation: Shao T, Gao X, Ke Y, Lu Q and Wang X (2024) The effects of plasma density structure on the propagation of magnetosonic waves: 1-D particle-in-cell simulations. Front. Phys. 12:1254024. doi: 10.3389/fphy.2024.1254024
Received: 06 July 2023; Accepted: 15 April 2024;
Published: 28 May 2024.
Edited by:
Chuanfei Dong, Boston University, United StatesReviewed by:
Mehran Shahmansouri, Arak University, IranCopyright © 2024 Shao, Gao, Ke, Lu and Wang. This is an open-access article distributed under the terms of the Creative Commons Attribution License (CC BY). The use, distribution or reproduction in other forums is permitted, provided the original author(s) and the copyright owner(s) are credited and that the original publication in this journal is cited, in accordance with accepted academic practice. No use, distribution or reproduction is permitted which does not comply with these terms.
*Correspondence: Xinliang Gao, Z2FveGxAdXN0Yy5lZHUuY24=; Yangguang Ke, a2V5Z0B1c3RjLmVkdS5jbg==
Disclaimer: All claims expressed in this article are solely those of the authors and do not necessarily represent those of their affiliated organizations, or those of the publisher, the editors and the reviewers. Any product that may be evaluated in this article or claim that may be made by its manufacturer is not guaranteed or endorsed by the publisher.
Research integrity at Frontiers
Learn more about the work of our research integrity team to safeguard the quality of each article we publish.