
94% of researchers rate our articles as excellent or good
Learn more about the work of our research integrity team to safeguard the quality of each article we publish.
Find out more
ORIGINAL RESEARCH article
Front. Phys., 29 January 2024
Sec. Nuclear Physics
Volume 11 - 2023 | https://doi.org/10.3389/fphy.2023.1327202
 G. Galati1*V. Boccia2,3*A. Alexandrov3B. Alpat4G. Ambrosi4S. Argirò5,6M. Barbanera4N. Bartosik6G. Battistoni7M. G. Bisogni8,9G. Bruni10F. Cavanna6P. Cerello6E. Ciarrocchi8,9S. Colombi10,11A. De Gregorio12,13G. De Lellis2,3A. Di Crescenzo2,3B. Di Ruzza14M. Donetti6,15Y. Dong7M. Durante2,16,17R. Faccini12,13V. Ferrero6C. Finck17E. Fiorina6M. Francesconi3M. Franchini11,10G. Franciosini12,18L. Galli9M. Ionica4A. Iuliano2,3K. Kanxheri4,19A. C. Kraan9C. La Tessa20,21A. Lauria2,3E. Lopez Torres6,22M. Magi12,18A. Manna10,11M. Marafini12,23M. Massa9C. Massimi10,11I. Mattei7A. Mengarelli10A. Mereghetti24T. Minniti25,26A. Moggi9M. C. Morone25,26M. Morrocchi8,9S. Muraro7N. Pastrone6V. Patera12,18F. Pennazio6F. Peverini4,19P. Placidi4,27M. Pullia15L. Ramello6,28C. Reidel17R. Ridolfi10,11L. Salvi4,19C. Sanelli29A. Sarti12,18O. Sato30S. Savazzi24L. Scavarda31A. Schiavi12,18C. Schuy15E. Scifoni20A. Sciubba18,29L. Servoli4G. Silvestre4,19M. Sitta6,32R. Spighi10E. Spiriti29V. Tioukov3S. Tomassini29F. Tommasino20,33M. Toppi12,18G. Traini12A. Trigilio29G. Ubaldi10,11A. Valetti5,6M. Vanstalle15M. Villa10,11U. Weber17R. Zarrella10,11A. Zoccoli10,11M. C. Montesi3,34
Introduction: Charged Particle Therapy plays a key role in the treatment of deep-seated tumours, because of the advantageous energy deposition culminating in the Bragg peak. However, knowledge of the dose delivered in the entrance channel is limited by the lack of data on the beam and fragmentation of the target.
Methods: The FOOT experiment has been designed to measure the cross sections of the nuclear fragmentation of projectile and target with two different detectors: an electronic setup for the identification of Z ≥ 3 fragments and a nuclear emulsion spectrometer for Z ≤ 3 fragments. In this paper, we analyze the data taken by exposing four nuclear emulsion spectrometers, with C and C2H4 targets, to 200 MeV/n and 400 MeV/n oxygen beams at GSI Helmholtzzentrum für Schwerionenforschung (Darmstadt, Germany), and we report the charge identification of produced fragments based on the controlled fading induced on nuclear emulsion films.
Results: The goal of identifying fragments as heavy as lithium has been achieved.
Discussion: The results will contribute to a better understanding of the nuclear fragmentation process in charged particle therapy and have implications for refining treatment planning in the presence of deep-seated tumors.
Despite the experience gained in proton therapy in recent years [1], there are still large fluctuations in the published data (mostly in vitro) concerning proton Relative Biological Effectiveness (RBE). RBE is the result of the interplay between physical parameters such as particle type, dose, linear energy transfer, and biological variables, including tissue type, cell cycle phase, and oxygenation level. At present, the clinically accepted RBE value is 1.1, although many studies have reported an increase towards the distal edge of the Spread Out Bragg Peak employed for patient treatments [2–4]. The additional contribution to RBE is due to fragmentation of the target nuclei and, in the case of ion beams heavier than protons, also to fragmentation of the beam [5]. The impact of target fragmentation is maximized in the beam entrance channel where healthy tissues are located [6, 7]. For clinical practice, the re-assessment of the RBE and a reduction of its uncertainty are highly relevant to allow more accurate dose delivery [8].
The lack of experimental data on target fragmentation processes of interest for proton therapy is due to the complexity of detecting the fragments produced, as they have very short ranges down to a few microns [6]. The current lack of data hinders the benchmarking of MC simulations, limiting further optimization of the software for treatment plans. The FOOT (FragmentatiOn Of Target) experiment aims to measure target fragmentation induced by proton beams and projectile fragmentation for helium, carbon and oxygen ion beams in human tissues in the energy range relevant for therapeutic applications (150–250 MeV for protons and 200–400 MeV/n for other ions). To this aim, two complementary detector set-ups, were made one by a magnetic spectrometer for high Z and low angles
The nuclear emulsion spectrometer, composed of alternating layers of nuclear emulsion films and passive materials, was designed for the reconstruction of interaction vertices and the measurement of the charge and momentum of secondary particles. The procedure to identify the charge of secondary fragments generated by the interaction of a16O (200 MeV/n) beam on a C2H4 target using the emulsion detector was reported in previous work [11]. This analysis is based on an established technique that involves controlled fading of nuclear emulsion films using different thermal treatments [12–15] that extend their dynamic range response, allowing the identification of particles with different charges and specific ionization.
In this paper, we apply an improved charge identification analysis to new data sets, due to the fragmentation of a16O (200 MeV/n) beam on a C target and by a16O (400 MeV/n) beam on C and C2H4 targets, and to the data set previously analysed due to a16O (200 MeV/n) beam on a C2H4 target. The results presented in this work will be used to evaluate the cross-sections of the target fragmentation induced by proton irradiation with energies in the range of interest for particle therapy.
A detailed description of the nuclear emulsion spectrometers is available in Ref. [11]. For the sake of clarity, a brief description is reported in the following. Nuclear emulsion spectrometers have an Emulsion Cloud Chamber (ECC) structure, which is composed of the following three sections (see Figure 1):
• Vertexing section, consisting of 30 nuclear emulsion films interleaved with layers of target passive material (C or C2H4), is designed to reconstruct the vertices where primary ions interact with atoms of the target and produce secondary fragments.
• Charge identification section, consisting of 36 nuclear emulsion films (divided into 9 cells), is designed to identify the charge of the fragments that cross it through dedicated thermal treatments of the nuclear emulsion films before chemical development.
• Momentum measurement section, consisting of a sequence of nuclear emulsion films and passive layers of different thicknesses and densities, is designed to stop fragments and measure their momentum by combining information from their range and Multiple Coulomb Scattering (MCS) [16].
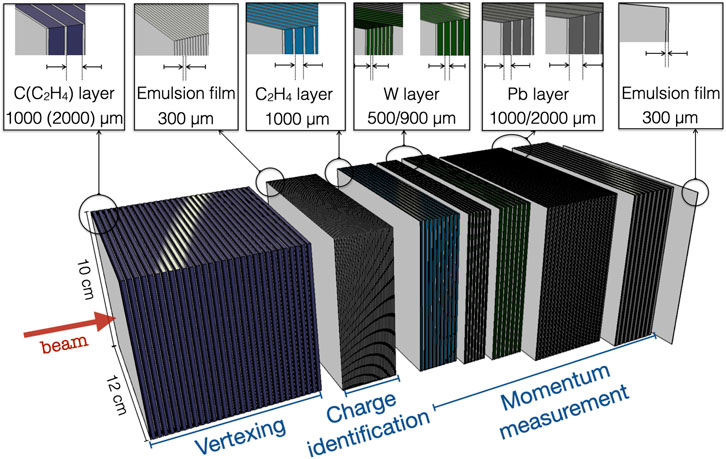
FIGURE 1. Scheme of the nuclear emulsion detector, with in evidence the three sections: the vertexing section, made by alternated layers of nuclear emulsion films and target material, the charge identification section, made only by nuclear emulsion films, and the section for the momentum measurement, made by nuclear emulsion films alternated to passive material of different thickness and density.
Nuclear emulsion films, which are the active part of the detector, consist of two sensitive layers (each 70 μm thick) deposited on both sides of a 210 μm thick plastic base, resulting in a total thickness of 350 μm. In the emulsion gelatin, AgBr crystals are embedded. When a charged particle crosses the emulsion layer, a sequence of AgBr crystals is sensitized along its trajectory, producing a latent image. After a chemical development procedure, the latent image turns into a sequence of dark silver grains, which are visible by an optical microscope [17–19]. The density of these grains is proportional to the particle’s ionisation. Nuclear emulsion films were produced by the Slavich Company1 (Russia) for Section 1 and by Nagoya University (Japan) for Sections 2 and 3. Their sensitivity is 30 grains over a track length of 100 μm for a minimum ionising particle (MIP).
Four nuclear emulsion spectrometers were realised: details of each ECC exposed to 16O beams are summarised in Table 1.
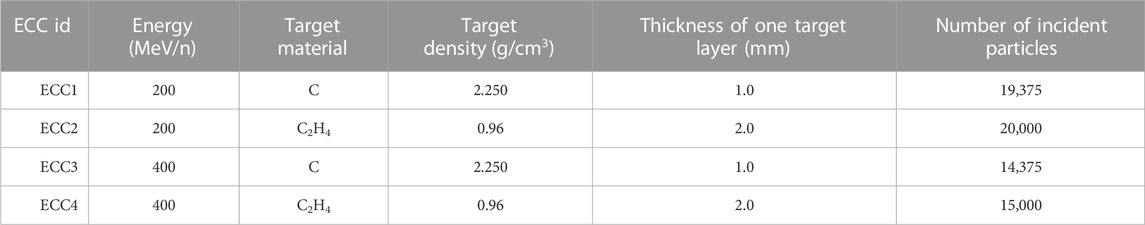
TABLE 1. Details of the four ECC exposed to 16O beams with the indication of number of incident ions for each exposure.
Data acquisition with the four emulsion spectrometers was done in cave A of the GSI Helmholtzzentrum für Schwerionenforschung facility in Darmstadt (Germany).
The incident beam flux was monitored by the Start Counter, which is made of a thin plastic scintillator, and by the Beam Monitor, consisting of a drift chamber providing the spatial distribution of the beam. A more detailed description of the monitoring detectors can be found in Ref. [9].
For each ECC, the number of incident 16O ions was optimized to achieve a maximum occupancy of
After chemical development, nuclear emulsion films are scanned using automated optical microscopes [17–19]. A dedicated software recognises clusters of dark pixels aligned in the two layers of a film and reconstructs them as a “base-track”. After aligning a sequence of films, base-tracks are connected to form “volume-tracks” that represent the path of the penetrating particle in the volume detector. A more detailed description of the track reconstruction procedure is reported in Ref. [11].
The nuclear emulsion response is proportional to the energy loss of particles over a certain dynamic range, which means that the grain density is proportional to the specific ionisation of the particle. Highly ionizing particles produce a saturation of the nuclear emulsion’s response due to the finite range of the grain density, preventing the measurement of their charges. To overcome the saturation effect with the aim of identifying the charge of the fragments, we adopted a procedure based on thermal treatments as already assessed in previous works ([11–15]). These treatments consist of keeping nuclear emulsion films for 24 h at temperatures above 28°C with a relative humidity (R.H.) of around 95%. By tuning the temperature, a controlled fading is induced, which can partially or totally erase grains, according to the particle’s ionization [20]. Section 2 was divided into nine cells of four films each, denoted Rx, with x ∈ {0, 1, 2, 3}. Each film underwent a specific thermal treatment according to its position in the cell: R0 films did not undergo any treatment, while R1, R2, and R3 films were kept for 24 h at 95% R.H. and temperatures of 28°C, 34°C, and 36°C, respectively. By the application of this technique, a fraction of MIP larger than 99% is erased in R1, while proton base-tracks were erased with an efficiency larger than 96% in R2 [11]. Only particles with Z ≥ 2 survived in the R2 and R3 films.
The procedure used to identify fragments’ charge was previously described in Ref. [11] and will be shortly repeated here. For the purpose of this paper, the ECC Section 2 is considered as a stand-alone detector.
For each track the following variables were measured and reconstructed:
• tan θ: the tangent of the slope of most upstream fitted track segment w.r.t. the Z-axis, parallel to the beam direction;
• NRx: the number of base-tracks belonging to the track for each set of thermal treatments Rx, with
• VRx: for each base-track, a variable named “volume” is defined as the sum of the pixel brightness and expressed in arbitrary units related to particles’ ionization;
•
To separate MIP cosmic rays from nuclear fragments with Z ≤ 2, a cut-based (CB) approach was used. To identify charges Z ≥ 2 the Principal Components Analysis (PCA) [21] was applied.
The CB approach uses the slope of the tracks with respect to the direction of the beam and the volume variables ⟨VR0⟩ and ⟨VR1⟩ to separate charge populations with sharp cuts. With respect to the previous work [11], the cut shape has been improved to achieve a better discrimination between signal and background (MIP cosmic rays). However, the CB approach is not powerful enough to distinguish the charges of Z ≥ 2 fragments, and the PCA is used to achieve this goal.
The PCA is used to calculate the linear combinations of ⟨VRx⟩ with the highest variance possible. These combinations represent the most significant features for classification purposes. In the following, we will adopt this notation: given the variables ⟨VRxav⟩, ⟨VRyav⟩ and ⟨VRzav⟩ (where x, y, z ∈ {0, 1, 2, 3}), the variable obtained with the PCA will be indicated as VPxyz. It can be shown that the coefficients used in the combination are definite positive, meaning that the correlation between the average volume variables and the specific ionisation of particles is preserved after the transformation. By definition, higher VP values will correspond to higher specific ionizations. The charges of the most ionising fragments have been determined by fitting the distributions of the VP variables and applying the same probabilistic approach as in Ref. [11].
At 200 MeV/n, the Oxygens Bragg peak occurs in the downstream part of Section 1. Therefore tracks in Section 2 were either left by nuclear fragments and cosmic rays, or they are a background due to the random association of base-tracks during the reconstruction of the track. To reduce the background, tracks with no base-tracks in the untreated (R0) films have been discarded (about 1% of all tracks). Cosmic-ray tracks, instead, can be identified thanks to their lower energy deposition and large incident angle with respect to the direction perpendicular to the films. This is visible in Figure 2, showing the distributions of ⟨VR0⟩ as a function of tan θ for all tracks having at most one base-track in the thermally treated films. In the plots two populations are clearly visible: tracks below the red line in Figure 2 have been identified as cosmic MIPs due to their lower average volume and their wide angular distribution. The cut to separate the two distributions, based on an exponential function, allows more closely matching of the distribution shapes, improving the results already presented, only for ECC2, in the previous work [11] where the cut was a linear function. In particular, the estimated fraction of Z = 1 tracks differs by about 3% with respect to the previous cut.
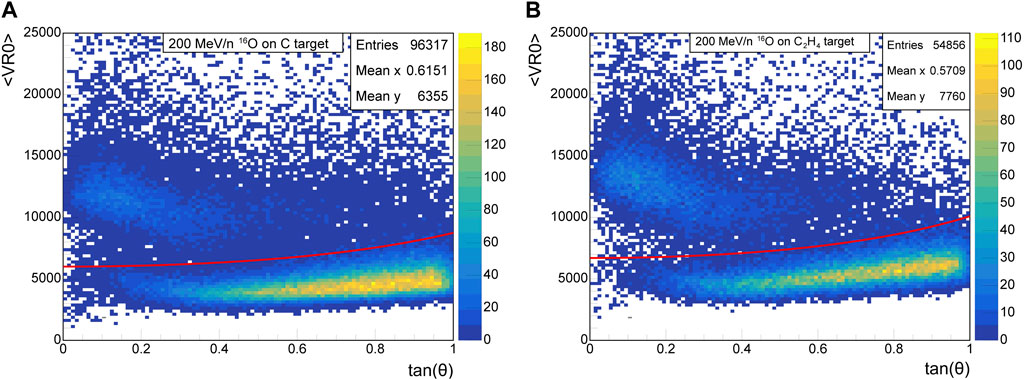
FIGURE 2. ⟨VR0⟩ vs. tan θ distribution for tracks in Section 2 for ECC1 (A) and ECC2 (B) satisfying the cut NR1 < 2, NR2 < 2, NR3 < 2. Two distinct populations are visible, identified respectively as cosmic MIPs (below the red curve) and Z = 1 fragments (above the red curve).
In a previous study [15] it was shown that all thermal treatments (R1, R2, R3) cancel proton tracks with energy larger than 80 MeV. Therefore, since these particles have not left a track in R1 − R3, we identify the tracks above the red line as Z = 1 fragments with energy above 80 MeV. Figure 3A, B shows the distribution of the variable ⟨VR1⟩ for ⟨VR0⟩ for all fragments that meet the cut NR1 ≥ 2. Two different populations can be identified by the use of a sharp horizontal cut: below the red curve the peak of ⟨VR1⟩ is around 4,000 a. u. while above it the peak is around 7,000 a. u. For a better classification of these tracks, we take into account the effects of R2 and R3 thermal treatments. To this aim, the cut NR2 < 2, NR3 < 2 is applied, and the resulting distribution is shown in Figure 3C. Fragments in the region below the cut survive R1 treatment but do not survive more aggressive R2 and R3 treatments. For this reason, they are identified as a lower energy component of Z = 1 fragments. Above the red line, there are Z ≥ 2 fragments, and among those, the ones satisfying the cut NR2 < 2, NR3 < 2 belong to the less ionizing particles and are identified as Z = 2 fragments.
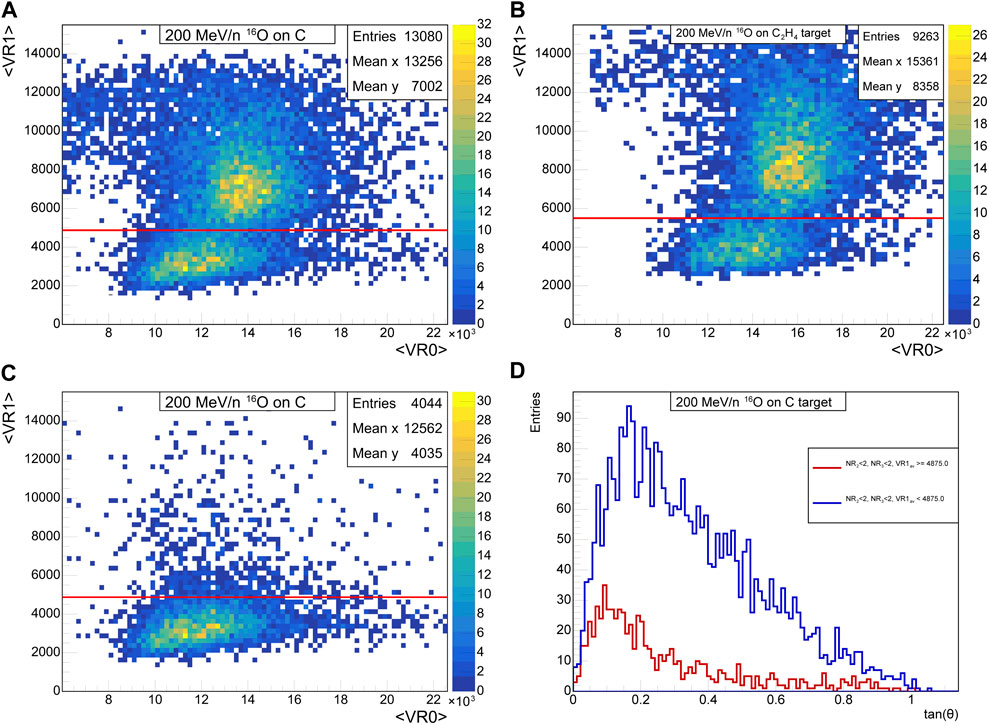
FIGURE 3. (A) ⟨VR1⟩ vs. ⟨VR0⟩ distribution for all tracks in Section 2 identified as fragments and satisfying the cut NR1 ≥ 2 for ECC1 and ECC2 (B). (C) ⟨VR1⟩ vs. ⟨VR0⟩ distribution for all tracks in Section 2 satisfying the cut NR2 < 2, NR3 < 2 for ECC1. (D) Angular distribution of fragments below the red line on the left, classified as Z = 1 and, above it, classified as Z = 2.
The angular distributions of the fragments reported in Figure 3A are shown in Figure 3D. Fragments above the red line (identified as Z = 2) have a narrower angular distribution, and this is consistent with their higher mass. No further distinction can be achieved with ⟨VR1⟩, ⟨VR2⟩ and ⟨VR3⟩, as can be seen in Figure 4. To overcome this limitation, the information given by each average volume variable was combined with PCA. Among the different possible combinations, the most effective one for charge identification is VP123. This variable has been used to classify all tracks having at least one base-track in R1, R2 and R3 regions that have been excluded by previous cuts (i.e., having at least two base-tracks in either R2 or R3). The VP123 data distribution is shown in Figure 5 (a) for ECC1 and (b) for ECC2. This distribution has been fitted with the sum of three Gaussian curves, each corresponding to a different atomic species: Z = 2, Z = 3 or Z ≥ 4. Charges Z ≥ 4 could not be disentangled because of the saturation of the response of the nuclear emulsion films.The fit curves for ECC2 shown in 5 (right) differ from those reported in [11] because the track selection has changed as a result of different cuts and tracking parameters. The vertical dashed line indicates the threshold above which the fit starts, as the left tail of the Gaussian data distribution has been erased because a fraction of Z = 2 fragments (with high energy) have already been classified (see comment on Figure 3).
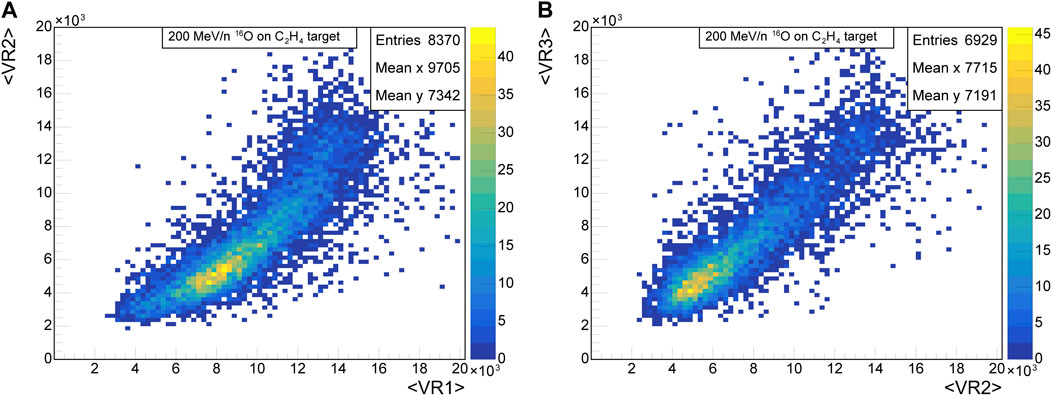
FIGURE 4. (A) ⟨VR2⟩ vs. ⟨VR1⟩ distribution for all tracks satisfying the cut NR1 ≥ 1, NR2 ≥ 1. (B) ⟨VR3⟩ vs. ⟨VR2⟩ distribution for all tracks that meet the cut NR2 ≥ 1, NR3 ≥ 1 for ECC2 Section 2.
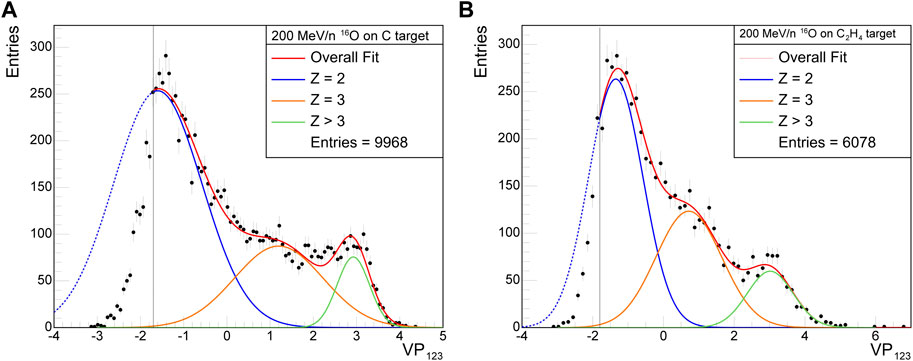
FIGURE 5. VP123 variable obtained with the PCA for all the tracks in ECC1 (A) and ECC2 (B) satisfying either NR1 ≥ 1, NR2 ≥ 1, NR3 ≥ 2 or NR1 ≥ 1, NR2 ≥ 2, NR3 ≥ 1. The distribution has been fitted with the sum of three Gaussian functions.
The variable VP123 is used if ⟨VR1⟩, ⟨VR2⟩, and ⟨VR3⟩ are available. Otherwise, the classification was performed using alternative combinations of VRx. A small fraction of the tracks were left unclassified (around 2% for ECC1 and ECC2). Overall, more than 96% of tracks’ charges were measured.
For data taken at 400 MeV/n, the position of the Bragg peak of the primary oxygen ions is beyond Section 2, meaning that a significant fraction of them will cross it. Moreover, nuclear fragments are continuously produced up until the Bragg Peak and a fraction of them is produced in Section 2.
The different initial kinetic energy of the primary beam naturally translates into a different fragment energy spectrum. Because of the higher average energies, particles belonging to the same atomic species will have a lower specific ionization, and therefore a different response to the thermal treatments used for charge identification is expected.
The lower average specific ionization of the fragments translates into a lower ⟨VR0⟩ (ranging from 7,000 to 10,000 a. u. at 400 MeV/n compared to 10,000 to 15,000 a. u. at 200 MeV/n), making the separation between Z = 1 fragments and cosmic rays less clear. For this reason, and to further reduce the combinatorial background included in the analysis, the cut NR0 ≥ 3 has been applied, and ⟨VRx⟩ has been used for classification purposes only if the track had at least 2 base-tracks in the corresponding Rx region. This cut does not affect the number of fragments that will be treated with the PCA.
Figure 6 shows ⟨VR0⟩ vs. tan θ for all tracks reconstructed in Section 2 for ECC3 (a) and ECC4 (b) with at least three base-tracks in R0 and no more than one base-track in the other regions. Tracks below the red curve are identified as cosmic rays, while tracks above the red curve are identified as nuclear fragments.
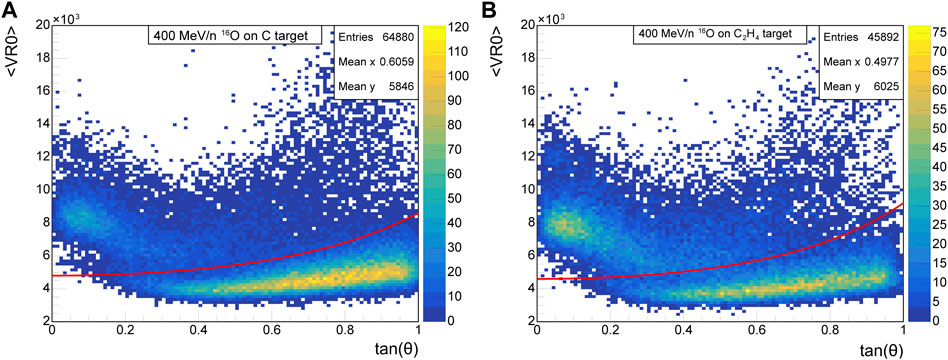
FIGURE 6. ⟨VR0⟩ vs. tan θ for tracks in Section 2 satisfying NR0 ≥ 1, NR1 < 2, NR2 < 2, NR3 < 2 for ECC3 (A) and ECC4 (B). Due to the lower specific ionization of the fragments, the two populations are closer.
The ⟨VR1⟩ vs. ⟨VR0⟩ distribution is shown in Figure 7 for all tracks that were not classified as cosmic rays, for ECC3 (a) and ECC4 (b).
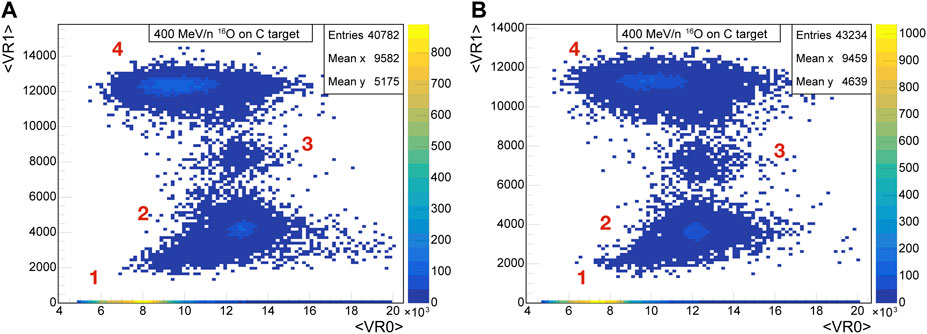
FIGURE 7. ⟨VR1⟩ vs. ⟨VR0⟩ distribution for all tracks in Section 2 identified as either primary oxygen ions or nuclear fragments for ECC3 (A) and ECC4 (B).
In Figure 7, four populations can be identified:
• fragments with ⟨VR1⟩ = 0 and ⟨VR0⟩≃ 7,500 a. u. that did not survive the R1 thermal treatment. They show the lowest specific ionization and are identified as Z = 1 particles;
• fragments with ⟨VR1⟩≃ 4,000 a. u. and ⟨VR0⟩ ranging from
• fragments with ⟨VR1⟩≃ 8,000 a. u. and ⟨VR0⟩≃ 13,000 a. u. having a sufficiently high specific ionization to survive the R1 treatment;
• fragments with ⟨VR1⟩≃ 12,000 a. u. and ⟨VR0⟩ ranging from about
The population with ⟨VR1⟩av ≃ 4,000 a. u. can be naturally distinguished from the others by observing which tracks have a statistically significant number of segments in the R2 and R3 regions. This is shown in Figure 8A, B for ECC3. These results confirm that the majority of fragments with ⟨VR1⟩av ≃ 4,000 a. u. have a significantly lower specific ionization compared to fragments in the upper population and are identified as a separate atomic species.
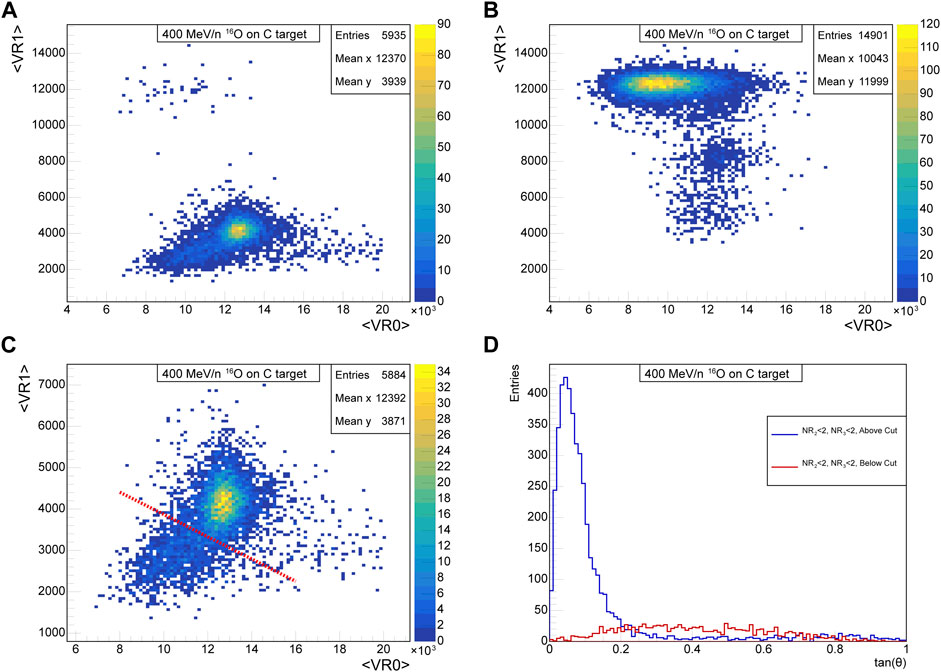
FIGURE 8. ⟨VR1⟩ vs. ⟨VR0⟩ for tracks in ECC3 Section 2 identified above the red curve in Figure 6 (A) satisfying ⟨VR1⟩ > 0 and NR2 < 2, NR3 < 2 (a) or NR2 ≥ 2, NR3 ≥ 2 (B). (C) Close up of the ⟨VR1⟩ vs. ⟨VR0⟩ distribution for the fragments in subfigure (A). (D) Angular distribution of fragments below and above the red cut.
To determine the atomic species of fragments belonging to the distribution shown in Figure 8A, it is useful to apply a further separation, which is shown in Figure 8C as a red line. Fragments below the red line have a wider angular spectrum compared to those above the line (Figure 8D, respectively). This leads to the identification of the former as a tail of fragments of Z = 1 and of the latter as Z = 2.
Because there is no sharp separation between the two populations, a more rigorous classification was obtained by combining ⟨VR1⟩ and ⟨VR0⟩ using PCA. The resulting variable is denoted as VP01 and its distribution was fitted with a sum of two Gaussian functions, interpreted as fragments of Z = 1 and Z = 2 (see Figure 9).
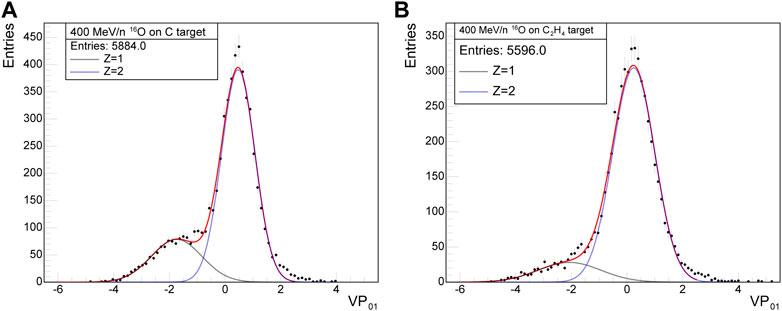
FIGURE 9. Fit of the VP01 distribution with a sum of two Gaussian functions for tracks satisfying the selection in Figure 8 (A) for ECC3 (A) and ECC4 (B).
Tracks remaining are those with at least 2 segments in the R2 or R3 regions (Figure 8B for ECC3). To proceed with their classification, the distribution ⟨VR3⟩ versus ⟨VR2⟩ is analyzed (Figure 10). The different atomic species starting from Z = 2 up to Z = 5 are clearly recognisable, before reaching saturation for the highest charges (Z ≥ 6), which include heaviest fragments and primary oxygens. This is shown in Figure 10 for ECC3 (a) and ECC4 (b).
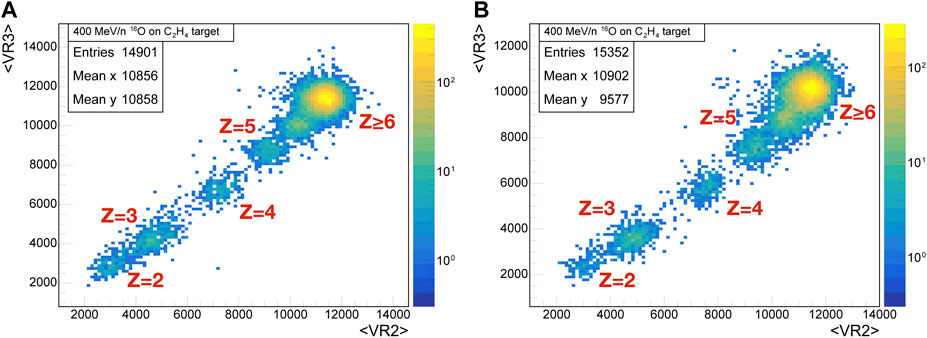
FIGURE 10. ⟨VR3⟩ vs. ⟨VR2⟩ distribution for all tracks in ECC3 (A) and ECC4 (B) identified as signal and having ⟨VR1⟩ > 0 and NR2, NR3 > 1.
To classify the different charges, the VP123 variable is calculated.
The VP123 distributions were fit with a sum of 6 Gaussian functions (Figure 11). Because of the saturation effects, which prevent the disentanglement of Z ≥ 6 particles, a significant tail can be seen in Figure 10 and motivated the inclusion of a sixth Gaussian in the fit. To classify the remaining fragments, the variables VP012 and VP013 have been calculated. Overall, more than 98% of the reconstructed tracks with NR0 ≥ 3 were classified.
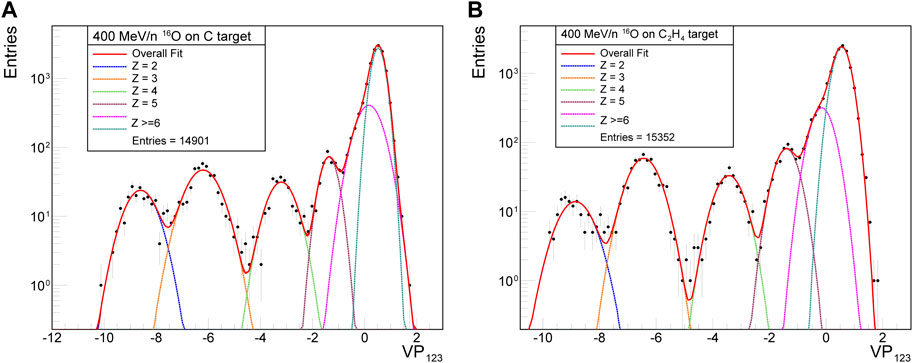
FIGURE 11. Fit with a sum of six Gaussians of the VP123 distribution produced for Section 2 tracks in ECC3 (A) and ECC4 (B).
Errors in the charge identification procedure can arise from the choice of a sharp cut or uncertainties associated with the fits of the VP variables. To estimate the systematic error associated with sharp cuts, the upper and lower boundaries have been defined, and the classification has been performed in each case. Therefore, ERROR = (Max-Min)/2 was estimated. In the formula, Max and Min represent the maximum and minimum numbers of fragments belonging to each population given by the different cuts.
Regarding errors arising from the fitting of the VP variables, three error components have been identified: a systematic fit uncertainty (due to the plot binning and the lower limit), a fit parameter error, and a statistical error (due to the size of the sample). Details on their evaluations are reported in Ref. [11]. An example of systematic uncertainty evaluation is shown in Figure 12 for sharp cuts (a) and for fitting the VP variables (b).
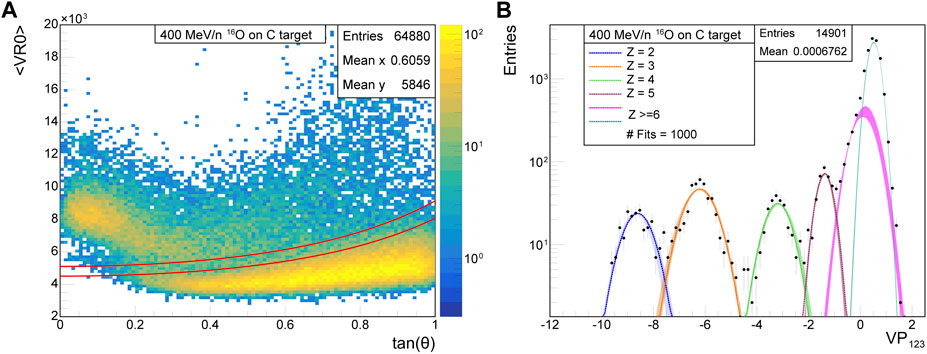
FIGURE 12. Evaluation of the systematic errors for ECC3: (A) sharp cut, (B) VP variables fits.
For each fit, the charge assignment was performed and, for each Z, the average number of particles over the 1,000 random generations was calculated. The final estimates were obtained as the weighted average of these partial results produced by different fits.
Table 2 shows the total number of fragments classified in each data set using the CB or the PCA method. For each charge, the number of tracks identified with the cut-based analysis and by the PCA is reported, as well as the fraction relative to the total number of fragments and the estimated errors.
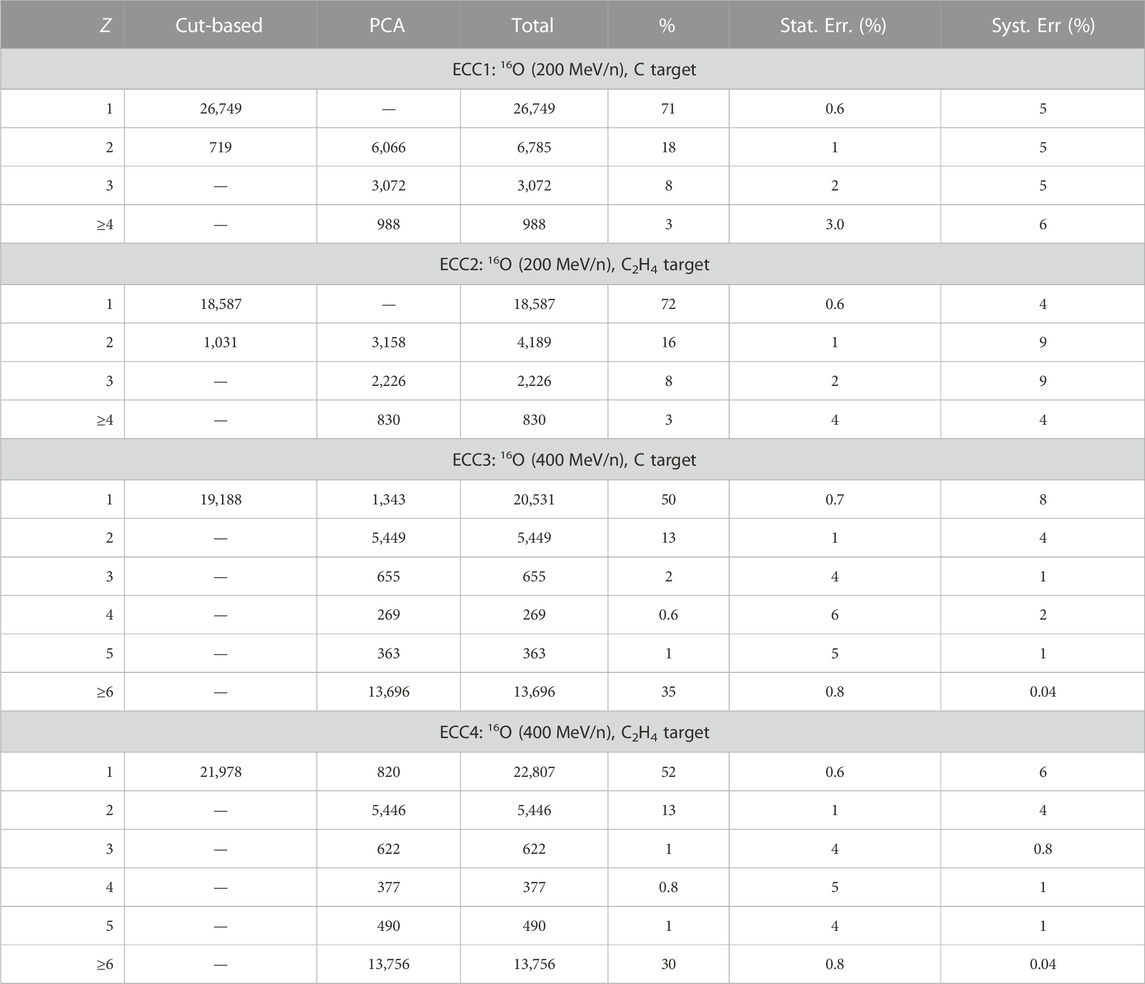
TABLE 2. Summary of fragments classified in each ECC. For each charge, the number of tracks identified with the CB and PCA method is shown as well as the fraction relative to the total number of fragments.
The results show that in most cases the leading contribution to the total uncertainty comes from the systematic component, mostly due to the CB method. This can be seen, for example, in the comparison between the systematic errors of the Z = 2 populations of ECC1 and ECC2: the latest has larger errors because the fraction of tracks classified with cuts (i.e., 1,031 out of 4,189) is larger compared to ECC1 (719 out of 6,785). The distributions of VP123 obtained at 200 MeV/n and 400 MeV/n (Figure 5; Figure 11, respectively) show a clearer separation of the charge populations at the higher energies. This is due to the linearity of the detector’s response in this energy range.
In Figure 13, the angular distributions of the fragments identified for the four ECCs are shown. As expected, the angular distributions of the heavier fragments are more forward-peaked.
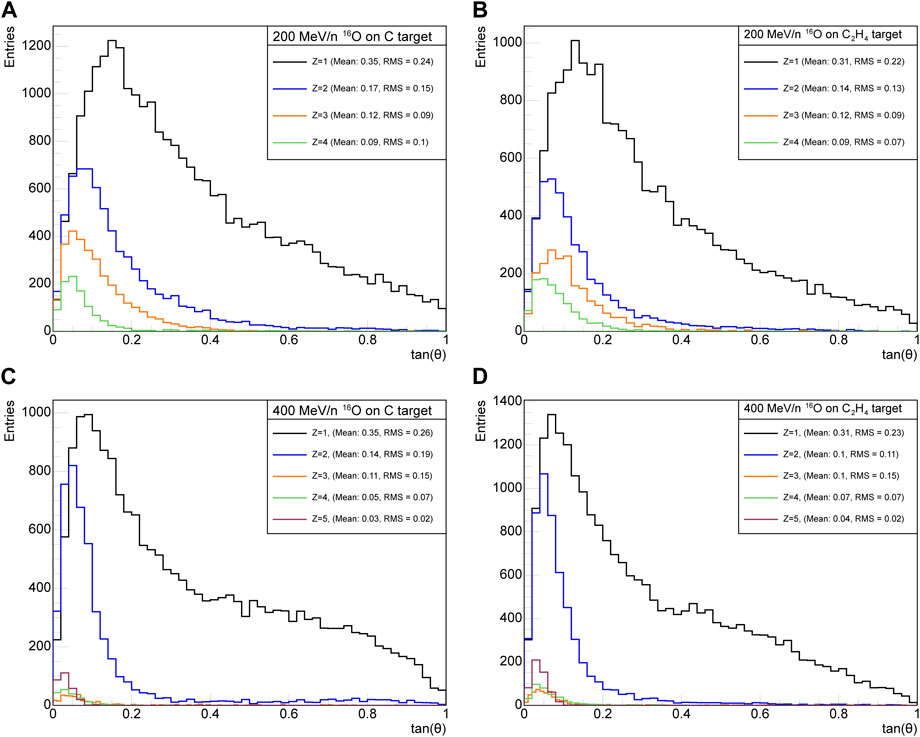
FIGURE 13. Angular distributions of fragments classified for ECC1 (A), ECC2 (B), ECC3 (C) and ECC4 (D).
In this paper, we present the identification of the charge of fragments (Z < 5) produced in interactions of 200 MeV/n and 400 MeV/n oxygen ions with C and C2H4 targets. Adopting an analysis method based on the controlled fading induced on nuclear emulsion films, the charges of fragments were separated and classified based on a cut-based (CB) and principal component analysis (PCA). The total number of reconstructed fragments ranges from 25,832 for ECC2 to 43,498 for ECC4. Concerning exposures with a beam energy of 200 MeV/n, the most abundant secondary fragments are Z = 1 and Z = 2 particles (71% and 16% for the carbon target; 72% and 18% for the polyethylene target, respectively). Concerning the exposures with a beam energy of 400 MeV/n, the fraction of Z = 1 fragments is 50% (C target) and 52% (C2H4 target) while the fraction of Z = 2 fragments is 13% for both targets. It is not possible directly to compare the fraction of fragments produced at different energies because at 200 MeV/n no primary oxygen particles cross Section 2 of the detector, while at 400 MeV/n some primary oxygen particles are still present, and they are included in Z > 5. As expected, the mean values of the angular distributions (shown in Figure 13) decrease with Z. In this study we achieved the goal of identifying fragments as heavy as lithium due to the interaction of an oxygen ion beam on C and C2H4 targets, as required by the FOOT experiment. For future data collection, the dominant systematic uncertainty will be reduced by optimising thermal treatments to obtain better separation between fragments with different charges.
The raw data supporting the conclusion of this article will be made available by the authors on request, without undue reservation.
GG: Writing–original draft, Writing–review and editing, Conceptualization, Data curation, Methodology, Supervision, Validation, Investigation. VB: Writing–original draft, Writing–review and editing, Conceptualization, Data curation, Formal Analysis, Investigation. AA: writing–review and editing, Data curation, Software. BA: writing–review and editing. GA: writing–review and editing. SA: writing–review and editing. MB: writing–review and editing. NB: writing–review and editing. GiB: writing–review and editing. MGB: writing–review and editing. GrB: writing–review and editing. FC: writing–review and editing. PC: writing–review and editing. EC: writing–review and editing. SC: writing–review and editing. ADG: writing–review and editing. GDL: writing–review and editing, Supervision, Validation, Funding acquisition. ADC: writing–review and editing, Data curation, Methodology, Supervision, Validation. BDR: writing–review and editing. MDo: writing–review and editing. YD: writing–review and editing. MDu: writing–review and editing. RF: writing–review and editing. VF: writing–review and editing. CF: writing–review and editing. EF: writing–review and editing. MrF: writing–review and editing. MtF: writing–review and editing. GF: writing–review and editing. LG: writing–review and editing. MI: writing–review and editing. AI: writing–review and editing, Data curation, Software. KK: writing–review and editing. ACK: writing–review and editing. CLT: writing–review and editing. AL: Writing–original draft, writing–review and editing, Data curation, Supervision, Validation. ELT: writing–review and editing. MMg: writing–review and editing. AlM: writing–review and editing. MMr: writing–review and editing. MMs: writing–review and editing. CM: writing–review and editing. IM: writing–review and editing. AbM: writing–review and editing. AeM: writing–review and editing. TM: writing–review and editing. AnM: writing–review and editing. MCMr: writing–review and editing. MMo: writing–review and editing. SM: writing–review and editing. NP: writing–review and editing. VP: writing–review and editing. FPn: writing–review and editing. FPv: writing–review and editing. PP: writing–review and editing. MP: writing–review and editing. LR: writing–review and editing. CAR: writing–review and editing. RR: writing–review and editing. LuS: writing–review and editing. CSa: writing–review and editing. ASa: writing–review and editing. OS: writing–review and editing. SS: writing–review and editing. LoS: writing–review and editing. ASc: writing–review and editing. CSc: writing–review and editing. EmS: writing–review and editing. AdS: writing–review and editing. LeS: writing–review and editing. GS: writing–review and editing. MS: writing–review and editing. RS: writing–review and editing. ElS: writing–review and editing. VT: writing–review and editing, Data curation, Investigation. ST: writing–review and editing. FT: writing–review and editing. MT: writing–review and editing. GT: writing–review and editing. AT: writing–review and editing. GU: writing–review and editing. AV: writing–review and editing. MVa: writing–review and editing. MVi: writing–review and editing. UW: writing–review and editing. RZ: writing–review and editing. AZ: writing–review and editing. MCMt: Writing–original draft, Writing–review and editing, Data curation, Supervision, Validation, Funding acquisition.
The author(s) declare financial support was received for the research, authorship, and/or publication of this article. The GSI data were taken in the IBER 006 experiment, supported by the European Space Agency (ESA)—IBER17 project, in the frame of FAIR Phase-0. This work was supported within the frame of FAIR Phase-0 and by the GSI Helmholzzentrum für Schwerionenforschung.
We thank GSI for the successful operation of their facilities during the data taking. The FOOT Collaboration acknowledges the INFN for its support in building and running the detector. We would like to acknowledge all the personnel of the CNAO and GSI centres that provided us support during the operational tests performed using proton, 12C and 16O beams at their facilities.
Author LoS was employed by the Aerospace Logistic Technology Engineering Company.
The remaining authors declare that the research was conducted in the absence of any commercial or financial relationships that could be construed as a potential conflict of interest.
All claims expressed in this article are solely those of the authors and do not necessarily represent those of their affiliated organizations, or those of the publisher, the editors and the reviewers. Any product that may be evaluated in this article, or claim that may be made by its manufacturer, is not guaranteed or endorsed by the publisher.
1. Particle Therapy Co Operation Group. Patient statistics for particle therapy treatments worldwide (2021). Available at: www.ptcog.
2. Paganetti H. Relative biological effectiveness (rbe) values for proton beam therapy. variations as a function of biological endpoint, dose, and linear energy transfer. Phys Med Biol (2014) 59:R419–72. doi:10.1088/0031-9155/59/22/r419
3. Tang J, Inoue T, Yamazaki H, Fukushima S, Fournier-Bidoz N, Koizumi M, et al. Comparison of radiobiological effective depths in 65-mev modulated proton beams. Br J Cancer (1997) 76:220–5. doi:10.1038/bjc.1997.365
4. Grün R, Friedrich T, Krämer M, Zink K, Durante M, Engenhart-Cabillic R, et al. Physical and biological factors determining the effective proton range. Med Phys (2013) 40:111716. doi:10.1118/1.4824321
5. Cucinotta FA, Katz R, Wilson JW, Townsend LW, Shinn J, Hajnal F. Biological effectiveness of high-energy protons: target fragmentation. Radiat Res (1991) 127:130–7. doi:10.2307/3577956
6. Bocci V, Capparella E, Collamati F, Donnarumma R, Faccini R, Ioannidis G, et al. Development of a radioguided surgery technique with beta-decays in brain tumor resection. Radiother Oncol (2016) 1:S39–S40. doi:10.1016/s0167-8140(16)30081-0
7. Bellinzona EV, Grzanka L, Attili A, Tommasino F, Friedrich T, Krämer M, et al. Biological impact of target fragments on proton treatment plans: an analysis based on the current cross-section data and a full mixed field approach. Cancers (2021) 13:4768. doi:10.3390/cancers13194768
8. Sørensen BS, Pawelke J, Bauer J, Burnet NG, Dasu A, Høyer M, et al. Does the uncertainty in relative biological effectiveness affect patient treatment in proton therapy? Radiother Oncol (2021) 163:177–84. doi:10.1016/j.radonc.2021.08.016
9. Battistoni G, Toppi M, Patera V, The Foot Collaboration . Measuring the impact of nuclear interaction in particle therapy and in radio protection in space: the foot experiment. Front Phys (2021) 8:568242. doi:10.3389/fphy.2020.568242
10. Dudouet J, Juliani D, Labalme M, Cussol D, Angélique J, Braunn B, et al. Double-differential fragmentation cross-section measurements of 95 mev/nucleon 12 c beams on thin targets for hadron therapy. Phys Rev C (2013) 88:024606. doi:10.1103/physrevc.88.024606
11. Galati G, Alexandrov A, Alpat B, Ambrosi G, Argirò S, Diaz RA, et al. Charge identification of fragments with the emulsion spectrometer of the foot experiment. Open Phys (2021) 19:383–94. doi:10.1515/phys-2021-0032
12. De Lellis G, Buontempo S, Capua FD, Marotta A, Migliozzi P, Petukhov Y, et al. Emulsion Cloud Chamber technique to measure the fragmentation of a high-energy carbon beam. J Instrumentation (2007) 2:P06004. doi:10.1088/1748-0221/2/06/p06004
13. De Lellis G, Buontempo S, Di Capua F, Di Crescenzo A, Migliozzi P, Petukhov Y, et al. Measurement of the fragmentation of carbon nuclei used in hadron-therapy. Nucl Phys A (2011) 853:124–34. doi:10.1016/j.nuclphysa.2011.01.019
14. Aea L, Consiglio L, De Lellis G, Di Crescenzo A, Montesi MC, et al. Measurement of large angle fragments induced by 400 mev n- 1 carbon ion beams. Meas Sci Tech (2015) 26:094001. doi:10.1088/0957-0233/26/9/094001
15. MeaFC M. Ion charge separation with new generation of nuclear emulsion films. Open Phys (2019) 17(1):233–40. doi:10.1515/phys-2019-0024
16. Agafonova N, Aleksandrov A, Altinok O, Anokhina A, Aoki S, Ariga A, et al. Momentum measurement by the Multiple Coulomb Scattering method in the OPERA lead emulsion target. New J Phys (2012) 14:013026. doi:10.1088/1367-2630/14/1/013026
17. Alexandrov A, Buonaura A, Consiglio L, D’Ambrosio N, De Lellis G, Di Crescenzo A, et al. A new fast scanning system for the measurement of large angle tracks in nuclear emulsions. J Instrumentation (2015) 10:P11006. doi:10.1088/1748-0221/10/11/p11006
18. Alexandrov A, Buonaura A, Consiglio L, D’Ambrosio N, De Lellis G, Di Crescenzo A, et al. A new generation scanning system for the high-speed analysis of nuclear emulsions. J Instrumentation (2016) 11:P06002. doi:10.1088/1748-0221/11/06/p06002
19. Alexandrov A, Buonaura A, Consiglio L, D’Ambrosio N, Lellis GD, Crescenzo AD, et al. The continuous motion technique for a new generation of scanning systems. Scientific Rep (2017) 7:7310. doi:10.1038/s41598-017-07869-3
20. Nakamura T, Ariga A, Ban T, Fukuda T, Fukuda T, Fujioka T, et al. The opera film: new nuclear emulsion for large-scale, high-precision experiments. Nucl Instr Methods Phys Res Section A: Acc Spectrometers, Detectors Associated Equipment (2006) 556:80–6. doi:10.1016/j.nima.2005.08.109
Keywords: particle therapy, fragmentation, cross sections, nuclear emulsion detector, protons RBE, charge measurement, hadron therapy
Citation: Galati G, Boccia V, Alexandrov A, Alpat B, Ambrosi G, Argirò S, Barbanera M, Bartosik N, Battistoni G, Bisogni MG, Bruni G, Cavanna F, Cerello P, Ciarrocchi E, Colombi S, De Gregorio A, De Lellis G, Di Crescenzo A, Di Ruzza B, Donetti M, Dong Y, Durante M, Faccini R, Ferrero V, Finck C, Fiorina E, Francesconi M, Franchini M, Franciosini G, Galli L, Ionica M, Iuliano A, Kanxheri K, Kraan AC, La Tessa C, Lauria A, Torres EL, Magi M, Manna A, Marafini M, Massa M, Massimi C, Mattei I, Mengarelli A, Mereghetti A, Minniti T, Moggi A, Morone MC, Morrocchi M, Muraro S, Pastrone N, Patera V, Pennazio F, Peverini F, Placidi P, Pullia M, Ramello L, Reidel C, Ridolfi R, Salvi L, Sanelli C, Sarti A, Sato O, Savazzi S, Scavarda L, Schiavi A, Schuy C, Scifoni E, Sciubba A, Servoli L, Silvestre G, Sitta M, Spighi R, Spiriti E, Tioukov V, Tomassini S, Tommasino F, Toppi M, Traini G, Trigilio A, Ubaldi G, Valetti A, Vanstalle M, Villa M, Weber U, Zarrella R, Zoccoli A and Montesi MC (2024) Charge identification of fragments produced in 16O beam interactions at 200 MeV/n and 400 MeV/n on C and C2H4 targets. Front. Phys. 11:1327202. doi: 10.3389/fphy.2023.1327202
Received: 24 October 2023; Accepted: 12 December 2023;
Published: 29 January 2024.
Edited by:
Marco La Cognata, Laboratori Nazionali del Sud (INFN), ItalyReviewed by:
Domenico Santonocito, Laboratori Nazionali del Sud (INFN), ItalyCopyright © 2024 Galati, Boccia, Alexandrov, Alpat, Ambrosi, Argirò, Barbanera, Bartosik, Battistoni, Bisogni, Bruni, Cavanna, Cerello, Ciarrocchi, Colombi, De Gregorio, De Lellis, Di Crescenzo, Di Ruzza, Donetti, Dong, Durante, Faccini, Ferrero, Finck, Fiorina, Francesconi, Franchini, Franciosini, Galli, Ionica, Iuliano, Kanxheri, Kraan, La Tessa, Lauria, Torres, Magi, Manna, Marafini, Massa, Massimi, Mattei, Mengarelli, Mereghetti, Minniti, Moggi, Morone, Morrocchi, Muraro, Pastrone, Patera, Pennazio, Peverini, Placidi, Pullia, Ramello, Reidel, Ridolfi, Salvi, Sanelli, Sarti, Sato, Savazzi, Scavarda, Schiavi, Schuy, Scifoni, Sciubba, Servoli, Silvestre, Sitta, Spighi, Spiriti, Tioukov, Tomassini, Tommasino, Toppi, Traini, Trigilio, Ubaldi, Valetti, Vanstalle, Villa, Weber, Zarrella, Zoccoli and Montesi. This is an open-access article distributed under the terms of the Creative Commons Attribution License (CC BY). The use, distribution or reproduction in other forums is permitted, provided the original author(s) and the copyright owner(s) are credited and that the original publication in this journal is cited, in accordance with accepted academic practice. No use, distribution or reproduction is permitted which does not comply with these terms.
*Correspondence: G. Galati, giuliana.galati@uniba.it; V. Boccia, vincenzo.boccia@na.infn.it
Disclaimer: All claims expressed in this article are solely those of the authors and do not necessarily represent those of their affiliated organizations, or those of the publisher, the editors and the reviewers. Any product that may be evaluated in this article or claim that may be made by its manufacturer is not guaranteed or endorsed by the publisher.
Research integrity at Frontiers
Learn more about the work of our research integrity team to safeguard the quality of each article we publish.