- 1Postgraduate Department, China Academy of Railway Sciences, Beijing, China
- 2Institute of Computing Technology, China Academy of Railway Sciences Corporation Limited, Beijing, China
- 3School of Computer Science and Technology, Xi’an Jiaotong University, Xi’an, China
Emergency disposal is a critical aspect for railway stations to ensure safety. This requires the implementation of emergency plan simulations and cost-effective immersive drills. In the paper, we incorporate a set of disposals for events into emergency processes and model the personnel, supplies, and equipment to create multiple emergency scenarios. Additionally, we introduce a digital twin-based solution for multiple scenarios of emergencies. This solution completely restores the key components of a station in the information space and provides an immersive way for emergency disposals. The four-dimensional model used in the solution simulates and interacts with the station, and it is composed of the details of passenger station physical entity, multi-scenario emergency virtual entity, digital twin connection, and emergency twin service. The digital twin for versatile emergency events such as fire disaster, natural disaster (e.g., flood, earthquake), social security incident, and public health event have been constructed using the model. The solution was tested at Qinghe, a station during Beijing-Zhangjiakou high-speed railway in China. By utilizing the actual operation data of Qinghe, we validated the multi-scenario emergency drills, simulated the corresponding emergency disposal plans, and assessed the proposed solution from three aspects: the fidelity of the real-world simulation, coverage of the multiple emergency scenarios, and the user-friendliness. The evaluations indicate that the proposed solution attains good score and the acceptable level of system usability scale.
1 Introduction
In China, the safety of passengers who board and alight at train stations is of utmost importance. Emergency events [1] such as fire disaster, natural disaster, public health event, and social security incident directly threaten the passengers’ lives and property. According to regulations [2,3], station staff address these issues through emergency measures that comprise regular drills and validation of plans during emergencies. Existing emergency drill uses either tabletop exercises or live drills to enhance response capabilities, but they both have limitations. Tabletop exercises lack an immersive experience, while live drills waste resources and are limited in simulating multiple potential hazards. Additionally, management cannot ascertain the effectiveness of response plans during emergencies, nor assess their scientific validity. Recently, the research [4] proposes to use IoT for Railway Emergency Detection and Response System. In China, currently the Intelligent Railway Passenger Station (IRPS) [5] system is used to enable real-time tracking of emergency processes and develop emergency drill plan for staff. Additionally, research has focused on railway 3-dimensional (3D) exercises, providing staff with single-scenario training [6,7]. To provide staff with a method to instantly validate emergency plans and offer immersive training in multiple disaster scenarios, we introduce digital twin technology. By replicating the real-world scenarios in a virtual environment and using actual data from station personnel, equipment, trains, passengers, and the environment, we enable the simulation of emergency processes and immersive training for various disaster events. The primary contributions of this paper can be summarized as follows.
• This study builds upon existing station emergency management protocols to meticulously construct a comprehensive outline of multi-emergency scenario, including fire, natural disaster (such as flood, earthquake), social security incident, and public health event. This outline provides a systematic approach to analyze and manage these situations.
• In analyzing emergency disposal process, this paper employs the Generalized Stochastic Petri Net (GSPN) [8] model. We have transformed each step of the response process into places, tokens, and transitions within the GSPN. The model calculates the duration of each transition through parallel, branching, and sequential structures. GSPN is then formulated as a Markov chain. It enables the study to identify weaknesses in the emergency disposal process, providing a basis for personnel adjustments.
• This research successfully integrates digital twin technology into emergency management. In this paper, we use a Digital Twin-Based model for Multi-Scenario Emergency (ED4D) to provide a detailed description of the process, which will furnish digital twin for process entities, facilitate interfaces to interact with reality, and offer services to manage emergency events. This model consists of the Passenger Station Physical Entity, Multi-Scenario Emergency Virtual Entity, Digital Twin Connections and Emergency Twin Services. By replicating the actual situation of the physical world in a virtual environment in real time, we allow the information exchange between both spaces. The characteristics facilitates the deduction of emergency processes and immersive drills for various disaster events.
• The ED4D model was validated at Qinghe Station, encompassing fire disasters, natural disaster (e.g., flood, earthquake), social security incidents, and public health events. By utilizing actual operational data from Qinghe Station (such as passenger numbers, staff, emergency resources, equipment status) through digital twin connections, we confirmed the effectiveness of the solution. This enables us to simulate emergency processes and conduct more efficient emergency drills.
2 Related works
2.1 Modeling techniques for emergency process
There are numerous tools proposed for modeling the common business process, such as the conditional directed graph [9], extended event-driven process Chain [10], Petri Net [8,11], and Integrated Computer Aided Manufacturing [12]. Among these methods, Petri Net and its extension have the strongest ability to explain the stochastic nature of events in business process. As a result, they are well-suited for representing random events that occur with a certain probability in business processes. Petri Net has gained extensive usage in the modeling of processes across diverse fields. In the context of emergency processes, they have found application in modeling emergency decision-making [13], scenario evolution of mass emergency events [14], emergency response to flood [15], and emergency capability assessment of meteorological disasters [16]. In the field of railway processes, Petri Net has been employed in the modeling of customs clearance analysis of the China-Laos railway [17], emergency dispatching and cooperative disposal of high-speed railways [18], emergency evacuation of complex passenger flow in railway passenger stations [19], as well as safety assessment and risk control [20].
2.2 Digital twin technology
The concept of the digital twin, as referenced in [21], involves creating a replica of the physical world in a digital space. This allows for the exchange of data between the two realms. By connecting with real-world entities, it is able to gather real-time data on the current state of affairs, mimic real-life situations, simulate operational scenarios, make intelligent decisions, and relay this information back to the existing system for control interaction. This technology has found its way into various fields such as industry [22–24], culture [25,26], medicine [27–29], construction [30]; [31], and intelligent maritime transportation [32]. In the railway operation industry, digital twin technology can be leveraged to merge different data sources and models for monitoring [33], turnout management [34], diagnostics [35], and prognostics [36]. It has the advantages of acquiring the actual state, mirroring the real situation, simulating the operation scenario, making generation-assisted decisions, and realizing control interaction.
2.3 Emergency drill based on 3D technology
The advancement of computer technology has facilitated the integration of 3D technology in skill training programs, including automobile maintenance training [37], railway axle disc brake maintenance [38], tunnel fire emergency drills [39], ship fire emergency drills [40], railway workers’ skill training [41], and train crew management [42]. The use of 3D technology enables the creation of a natural world in the information space that dynamically simulates disaster occurrences with negative outcomes, such as damages, losses, injuries, and fatalities. This technology resolves the challenge of large resource consumption and enhances the sense of immersion.
2.4 Systems usability evaluation
User evaluation is a common approach to determine whether a software application is meeting its intended usage requirements. The system usability scale (SUS) [43] is a widely accepted questionnaire standard that consists of ten questions designed to assess usability. The after-scenario questionnaire [44] is composed of three questions that evaluate time, difficulty, and information support. The usability metric for user experience [45] is a rating system that involves four questions covering three dimensions: usefulness, efficiency, and satisfaction. The Happiness-Engagement-Adoption- Retention-Task Success (HEAR) framework [46] is an evaluation tool used for internal enterprise software applications, which assesses the time required to complete tasks and their level of difficulty.
3 The modeling of multi-scenario emergency
Multi-Scenario Emergency is a comprehensive framework that encompasses various types of emergency situations. A scenario, which is a delineation of emergency events, serves as the impetus for emergency response procedures and the mobilization of resources by personnel to execute a series of disposal actions aimed at mitigating and controlling the escalation of the situation. There are several types of emergencies in the station, categorized into four groups[1]: fire disaster, natural disaster, social security incident, and public health event. In the paper, we focus on five events for Multi-Scenario Emergency: fire, flood, earthquake, social security incident, and public health event. Although the fundamental process of emergency disposal remains constant for different events, the disposal personnel, resources and tasks differ. This paper provide a detailed outline of the disposal scenes for various emergency events in Section 3.1 and present a GSPN to describe the process of emergency disposal in Section 3.2, thereby defining a multi-scenario emergency disposal model.
3.1 Multiple emergency scenarios
Scenarios consist of a combination of events, equipment, personnel, resources, and individual actions. In accordance with the chronological progression of events, personnel execute a series of action measures to steer the events towards the intended outcome. In relation to transportation stations confronted with circumstances such as fire, flood, earthquake, social security incident, and public health event, we have undertaken an evaluation of emergency procedures, outlining personnel requirements, resource allocation, equipment utilization, and disposal methodologies. The specifics are presented as follows.
• Fire disaster. In the occurrence of a fire alarm signal, the passenger station is responsible for taking prompt measures to guarantee the security of its passengers. The primary action involves reporting the occurrence to the station manager, who will evaluate the extent of the incident and determine whether to initiate the emergency response plan. Pursuant to the plan, station employees must conduct various tasks, including consoling passengers, safely evacuating them, contacting local rescue services for aid, utilizing firefighting equipment, and extinguishing the fire. After the fire has been contained, the site must be restored, and a post-event summary should be created to evaluate the efficiency of the emergency response.
• Natural disaster. Upon receipt of an earthquake or severe weather alarm, the station manager initiates an assessment of the situation to determine the appropriate emergency response level. Subsequently, in compliance with the emergency plan’s provisions, the station staff undertakes emergency tasks, including passenger reassurance, passenger evacuation, itinerary modifications, coordination with local rescue teams, acquisition of emergency resources, on-site rescue operations, and other related duties. Post-disaster, the site is restored to its previous state, and the emergency is concluded upon completion of the restoration process.
• Social security incident. Upon discovery of violent acts at the train stations, the staff promptly notifies and reports to the station manager. The manager evaluates the situation and implements the emergency response plan in accordance with established guidelines. The staff carries out emergency duties such as passenger evacuation, coordination with the police department, and on-site rescue operations. Once the offenders are apprehended, the site is restored to its original state. Ultimately, a post-incident analysis is performed.
• Public health event. When a case that is suspected to involve a contagious disease is reported, the station without delay informs the station manager for evaluation. Depending on the assessment, the station personnel are required to undertake several emergency tasks, which include, but are not limited to, providing reassurance to passengers, ensuring their safe evacuation, reaching out to the local disease control department, implementing on-site isolation measures, and more. Once all the individuals suspected of carrying the disease have been transported, the site must be restored to its original state, and a post-incident review must be carried out to determine the effectiveness of the response and identify areas for improvement.
To provide a succinct overview, the alarm circumstances exhibit a range of fluctuations in accordance with the emergency situations. In the course of these situations, personnel undertake assorted duties, necessitate a diverse array of external rescue measures, and obtain access to a variety of emergency resources. The specifics pertaining to these factors are concisely encapsulated in Table 1.
3.2 The GSPN model for multi-scenario emergence processes
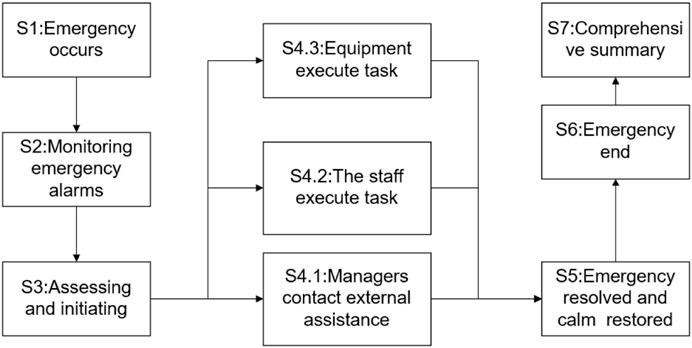
A strategy for managing various emergency situations is established as a common disposal protocol, as depicted in Figure 1. The procedure is initiated by monitoring emergency alarms and determining their seriousness level, as illustrated by S1, S2 and S3 in Figure 1. During an emergency, the station activates multiple staff members to participate in the disposal effort, as exemplified by S4.1, S4.2 and S4.3 in Figure 1. Once the situation has been resolved and the site has been restored, the emergency will be concluded, followed by a comprehensive summary of the emergency process, as illustrated by S5, S6 and S7 in Figure 1. The aforementioned process can be represented as a sequence S1 and S2 as shown in Figure 1, branching S3 and S4 as depicted in Figure 1, and parallel parts S4.1, S4.2 and S4.3 as illustrated in Figure 1. These components can be effectively portrayed by using a Petri Net [8,11].
Petri Net [8,11], a graphical mathematical modeling tool, is comprised of four essential components: place, transition, token, and directed arc. Place represents the current state of the system, transition signifies state changes, and token represents system resources. Directed arc, on the other hand, illustrates the relationship between Place and transition while also indicating the direction of token flow. However, Petri Net is not equipped to handle cases where the transition is a random delay, and the state space grows exponentially with the increase of the problem. The GSPN addresses this issue [18,47,48]. The introduction of time values and random numbers in GSPN enhances Petri net, allowing for the modeling of features such as random delay, variable time, and randomness. Therefore, we adopt it to model the comprehensive emergency process. As the emergency process proceeds, tasks must be continuously adapted to site conditions, and each task may require varying amounts of time to complete.
The GSPN for emergencies disposal [15] is a directed graph described by eight elements:
Here, the raised index i is used to differentiate a variety of emergency occurrences and assumes values from a set of {1, 2, 3, 4, 5}. Specifically, 1 represents fire, 2 flood, 3 earthquake, 4 social security incident, and 5 public health event. The meaning of the eight constituents is outlined as follows.
• P denotes a finite collection of places that serve as a container for tokens. In this article, the term Place specifically refers to different sets of information, while token denotes specific pieces of information.
• T represents a finite assortment of transitions that bring about changes in emergency situations.
• F comprises the set of directed arcs that establish a connection between P and T.
• W is the collection of arc weights that specify the maximum number of tokens that can traverse each arc.
• M serves as a status flag, representing the quantity of tokens within each P, for each state.
• λ is associated with the occurrence probability. Upon fulfillment of specific conditions, the related transitions occur; the occurrence of the transition is independent of each other. λ then parametrizes the distribution function for the occurrence.
• PIT signifies the moment when the transition undergoes a change, represented by {Timei}.
• BT keeps track of the time delay for each transition in T.
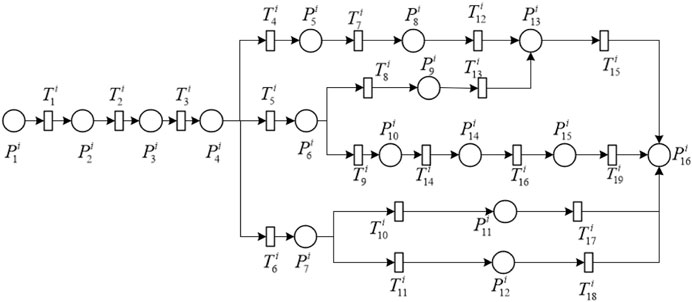
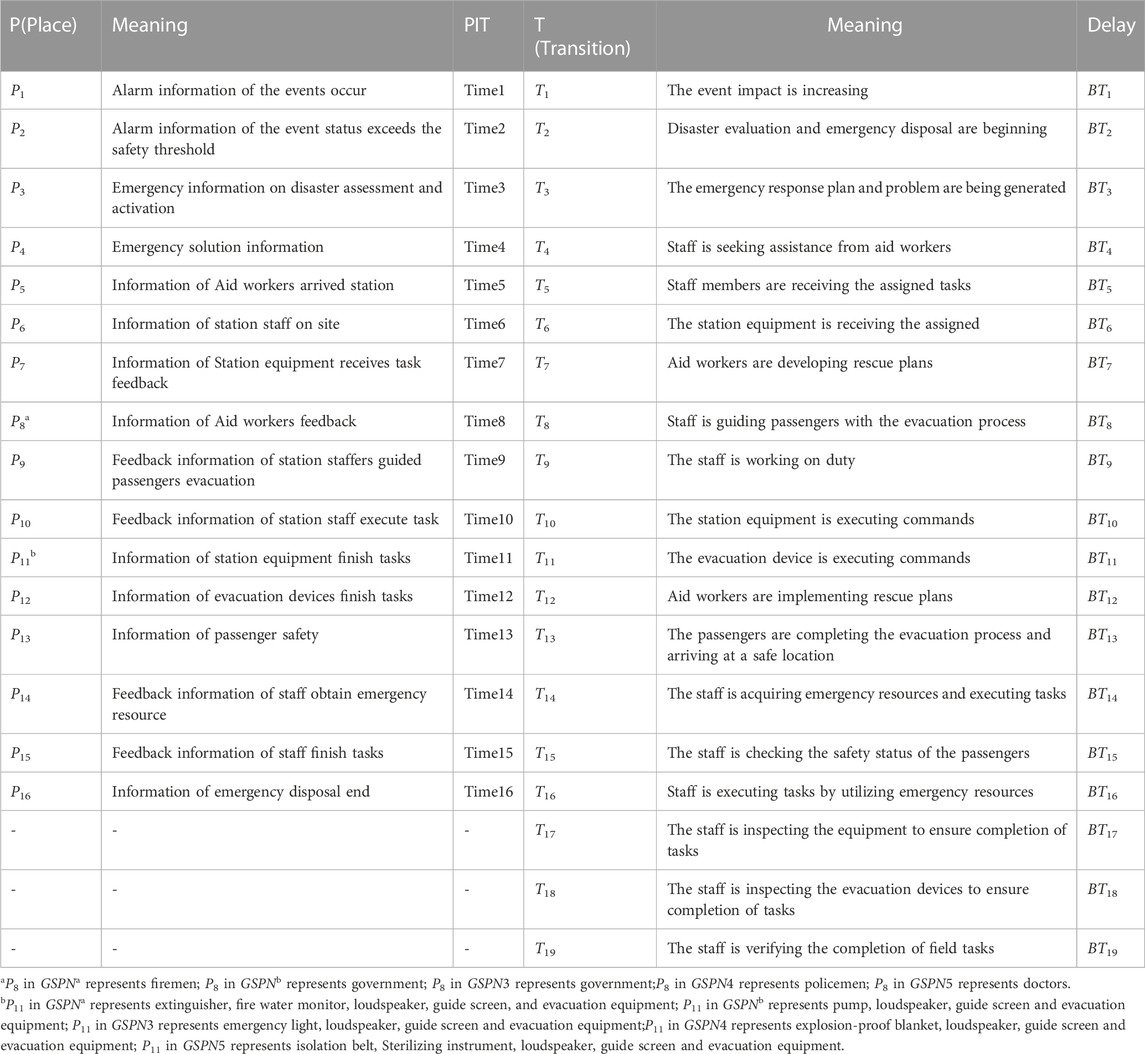
The entire process, beginning with monitoring and ending with the emergency summary, is modeled by GSPN, which encompasses all stages, as indicated in Figure 2. The GSPN model is made up of 16 place and 19 transitions, which effectively represent all crucial aspects of the emergency process within a restricted set. Further information regarding P, T, PIT, BT is available in Table 2.
The initial data set P1 is made available at Time0, and the values of Timei are derived using Eq. 2. Through calculations, we can establish the corresponding point-in-time for every Pk, which in turn allows us to make an estimate of the total time required for the emergency process. As illustrated in Figure 2, the time for P8 is determined by the leading P5 as the start time, plus the duration needed to execute T7. The start time of P13, is determined as the maximum of two sums; one is the sum of the start time of P8 plus the duration needed to execute T12, and the other is the start time of P9 plus the duration needed to execute T13. The P13 can only start after the completion of both branches.
The transfer of the token from one P to another signifies a shift in the system’s state. We set the flag for token changes in GSPN as denoted by vector set M in Eq. 3. The magnitude of vector Mi corresponds to the quantity of P. Each element in the vector Mi represents the quantity of tokens present in the P [49]. In the paper, the M is comprised of a set of 15 vectors, and each vector has 16 elements, as depicted in Eq. 3.
The model’s initial sign is M1, upon the occurrence of a token in P1 that means the events occur alarm information, the transition T1 is triggered with probability λ1 and the token is transferred to P2. The transition T1 requires BT1 time units and results in a change from M1 to M2, as depicted by the sequence shown in Figure 1 S1 to S2. In this moment, the token is in P2 and the status is M2 as Eq. 3, which means the event status exceeds the safety threshold. Similarly, the fourth status change is indicated by M4, where P4 possesses a token and signifies the current state of emergency disposal plan determination.
Subsequently, the token in P4 split into three, as depicted by the branching shown in Figure 1 (S3 to S4), transitioning the status from M4 to M5. The transition T4 describes one token changes from P4 to P5, which represents the assistance seeking from Aid workers. The transition T5 describes other token changes from P4 to P6, which denote staff task reception. The transition T6 describes another token changes from P4 to P7, which indicate station equipment task reception. M5 corresponds to the fifth state change, with P5, P6, and P7 containing one token each as Eq. 3, and the parallel shown in Figure 1 (S4.1, S4.2 and S4.3).
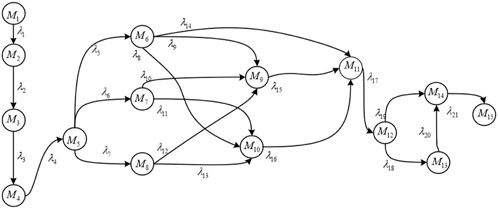
In GSPN, token transitions exhibit a certain degree of randomness. Given that the Markov chain is a type of stochastic process, GSPN can be effectively analyzed for system stability using Markov chain methods. GSPN having a finite number of places and tokens are equivalent to a one-dimensional continuous-time Markov chain model [49]. To gain a comprehensive grasp of the entire emergency process, we utilize Markov chain to analyze potential weaknesses. We can obtain Markov chain that are isomorphic to the simplified GSPN model, as shown in Figure 3. The Markov chain is obtained by using the probability occurrence λk of the triggered transitions as the directed edge. In branching scenarios, different states are generated due to varying branch duration. Branching starts from P4, resulting in multiple states corresponding to M5 and its subsequent transitions. During the transition from M5 to M6, M7, and M8, due to different branch times for P5, P6, and P7, there is a probability λ5 that P5 has completed while P6 and P7 remains incomplete, as M6. The same applies to the generation of M7 and M8. After the completion of P5 and P6, M9 is generated, and after the completion of P6 and P7, M10 is generated. Therefore, from M6, M7, and M8, we can reach both M9 and M10. M9 corresponds to P7, P8, P9 and P10, M10 corresponds to P9, P10, P11 and P12.
By utilizing Markov to calculate the average time on each state Mi of the GSPN, the determination of the duration of stay at different states is enabled [49]. Specifically, for the evacuation of passengers in group P8 and P9 to P13, the duration BIT is closely linked to the number of passengers present, which poses a high risk of stagnation in state transition. P13 can lead to deadlock states in a Petri net, where the system is unable to progress and emergency procedures cannot be executed properly. By analyzing bottleneck P13 and promptly adjusting or supplementing them, we can optimize the entire emergency process and ensure smooth emergency handling.
4 Digital twin-based model for multi-scenario emergency
Utilizing the innovative digital twin technology as outlined in [21], we have developed a groundbreaking model consisting of four key components that effectively address emergency scenarios that may arise within passenger stations. This comprehensive model takes into account emergency events, personnel, equipment, resources, and individual actions, with designated personnel implementing a series of emergency response measures in a specific sequence. The 4-dimensional multi-scenario emergency model for passenger stations, known as ED4D, is formulated as a set of guidelines that are designed to effectively manage multiple potential emergency situations.
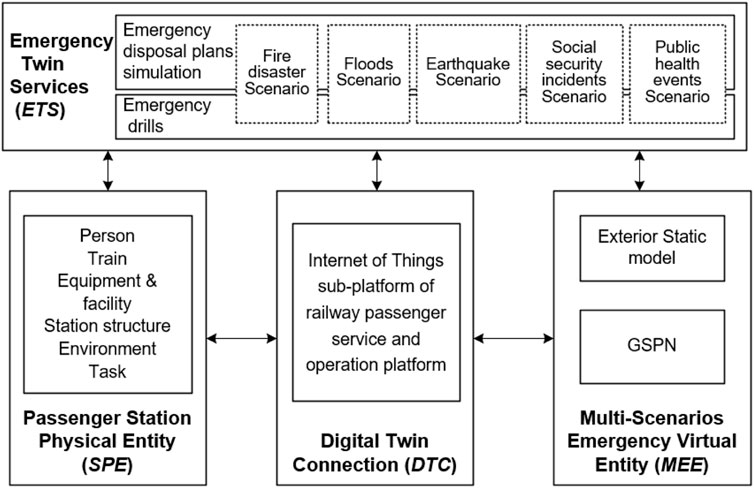
The set ED4D, as depicted in Eq. 4, has been established for multi-scenario emergency and disposal at passenger stations. This model consists of four crucial components, namely, the Passenger Station Physical Entity (SPE), Multi-Scenario Emergency Virtual Entity (MEE), Digital Twin Connection (DTC), and Emergency Twin Service (ETS), which are clearly depicted in Figure 4. The following sections provide a detailed explanation of each component. The passenger station physical entity refers to a physical location designed to hold passengers as they board and alight. On the other hand, the multi-scenario emergency virtual entity is a virtual replica connected to its corresponding physical counterpart. The digital twin connection serves as an effective medium for exchanging data between the two realms, while the emergency twin service provides essential services to handle emergencies at the station.
4.1 Passenger station physical entity (SPE)
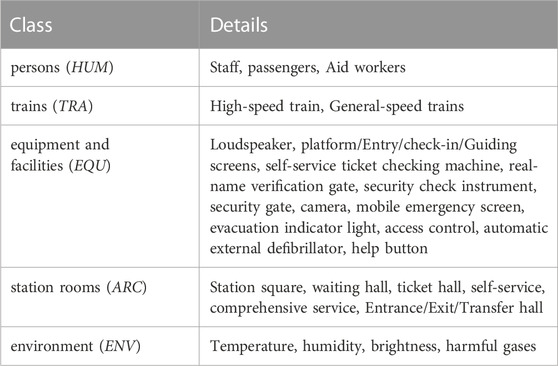
The Passenger Station Physical Entity is comprised of human (HUM), train (TRA), equipment and facility (EQU), station room (ARC), and environment (ENV), as follows:
The precise details regarding every constituent element have been illustrated in Table 3. Nevertheless, the aid worker, equipment, and facility employed in an emergency situation may vary depending on the type of incident. For additional information of the incidents, please refer to Table1.
4.2 Multi-scenario emergency virtual entity (MEE)
In order to create a virtual representation of the passenger station, it is necessary to accurately replicate both the stationary and moving attributes of physical objects within the digital realm. The multi-scenario emergency virtual entity comprises a Static model of the exterior, as well as a Dynamic Behavior Model that outlines the emergency response process based on the GSPN framework detailed in Section 3.2.
4.2.1 Exterior static model
To obtain a 3D representation and external image of a physical entity, on-site surveying is necessary to obtain geometry and texture information for trains, equipment, and facilities. One must retrieve the necessary geometric and texture information. In the case of a station structure, construction drawings are utilized for basic geometric information, while on-site photos are utilized for texture information. Personnel are differentiated based on their attire, with staffers further differentiated by gender.
4.2.2 Emergency process dynamic behavior model
In Section 3.2, the GSPN framework is utilized to create a multi-scenario emergency disposal process. The model is implemented in C# using object-oriented programming principles and involves ontology attributes and data related to personnel, trains, equipment, station houses, and environment. The emergency process comprises of different stages such as alarm, start of emergency, disposal, recovery, end, and summary. To simulate passenger arrival parameters, a log-normal distribution is used [50]. Staff are determined by the day’s schedule, and train scheduling follows the charting plan for the day. Equipment operation is based on the equipment operation plan, and if an emergency disposal process encounters equipment failure, the Boolean value of the equipment status is changed accordingly.
4.3 Digital twin connection (DTC)
The physical entity of the passenger station and the Multi-Scenarios Emergency Virtual Entity both utilize the Internet of Things subsystem of the IRPS for integrated access and management, facilitating connectivity and interaction. In terms of person-to-person connection, staff members use Bluetooth positioning to obtain real-time location information and handheld terminals to send and receive information. The platform and dispatching system-level interface are utilized to obtain information about train arrivals and departures. Common protocols are used to interactively control electronic equipment such as self-service ticket machines, real-name verification gates, speakers, and various types of screens. Additionally, for system-level interfaces like equipment and trains, we use the HTTP protocol for data acquisition, updating it at predetermined intervals. For real-time train arrival and departure information, the GET method is used, with an approximate cycle of 20 s. For train ticket availability, the POST method is adopted, with a frequency of about once per minute. For passenger and staff information, the POST protocol is utilized, while for equipment, the GET protocol is employed with a 1-min cycle. Fire extinguishers and disinfection sprayers are accessed by Radio Frequency Identification and maintained by staff. Real-time sensors such as smoke sensors and water level meters are used to obtain information about the state of the station environment.
4.4 Emergency twin service (ETS)
The digital twin emergence service offers a range of emergency scenario simulation and drill functions for various events. In terms of simulation, the service employs GSPN to automatically calculate the emergency disposal time and effectiveness based on a range of factors including the onset of the emergency, the station’s trains, the number of passengers, the real-time location of staff, and the status of emergency resources and equipment. With regards to drills, the platform facilitates the setting of parameters such as the number of participating passengers, staff, and emergency resources to simulate the emergency disposal process. Both service functions provide real-time information on the status, video inspection, and maintenance of inspected equipment, such as fire extinguishers, fire hydrants, sprinklers, mobile emergency screens, and evacuation instructions.
5 A case study for Qinghe station
At Qinghe station, we conducted the validation of digital twin-based solution. The components of the station psychical entities include HUM (staff and passengers), TRA (high-speed trains), EQU, ARC (one underground level and three above-ground levels), and ENV. Utilizing 3D Max software, we captured on-site real scenes to generate the Exterior Static Model, employing these models to create a multi-scenario virtual entity of Qinghe Station. We utilized Unity3D [7] to develop GSPN processes to create the Emergency Process Dynamic Behavior model, enabling the implementation of all ETS functionalities. DTC was used to interact with reality and obtain real-time data from the Internet of Things subsystem of IRPS, including the train data, tasks, staff information, and more. The ETS can simulate the entire process of emergency disposal and display the number of personnel involved, the nature of resources required for disposal operations, and the duration of the evacuation process. The hardware environment used an Intel(R) Core(TM) i9-10900K CPU@3.7 GHz processor, a NVIDIA GeForce RTX 3080 Ti graphics card with 12 GB memory, 32 GB of DDR4 memory, and the Windows 10 operating system. The final size of this model is 3.8 GB.
5.1 Fire
We have developed an extensive plan for a fire emergency, which covers the entire process from its initial outbreak to the conclusion. In the event of a fire, the ETS will share information about the burning chair (P1 in GSPN) as indicated in Figure 5A. The rate of flame combustion may differ based on the material, resulting in varying values for the duration (BT1). Once the burning surpasses the safety threshold (P2), the station manager assesses the severity of the situation and activates emergency protocols before any information regarding the emergency is activated (P3). Next, the staff executes the emergency disposal plan, with some of them seeking help from aid workers, such as firefighters (T5). The ETS then gives information about staff present on the site (P6), as well as the evacuation equipment executing the emergency disposal (P7), which provides guidance on the prescribed evacuation route, as shown in Figure 5B. In addition to displaying the staff members responsible for organizing passenger evacuation (T8), the ETS also provides instructions for a group of passengers (T13) to follow and evacuation equipment to use in order to ensure a smooth evacuation process, as illustrated in Figure 5C. Additionally, during the disposal process, the ETS displays the staff responsible for extinguishing the fire (T14) and those involved in restoring the scene after the fire has been extinguished, as depicted in Figure 5D. Finally, the ETS delivers the concluding information (P16), and a report on the emergency disposal is produced to document the resolution of the incident.
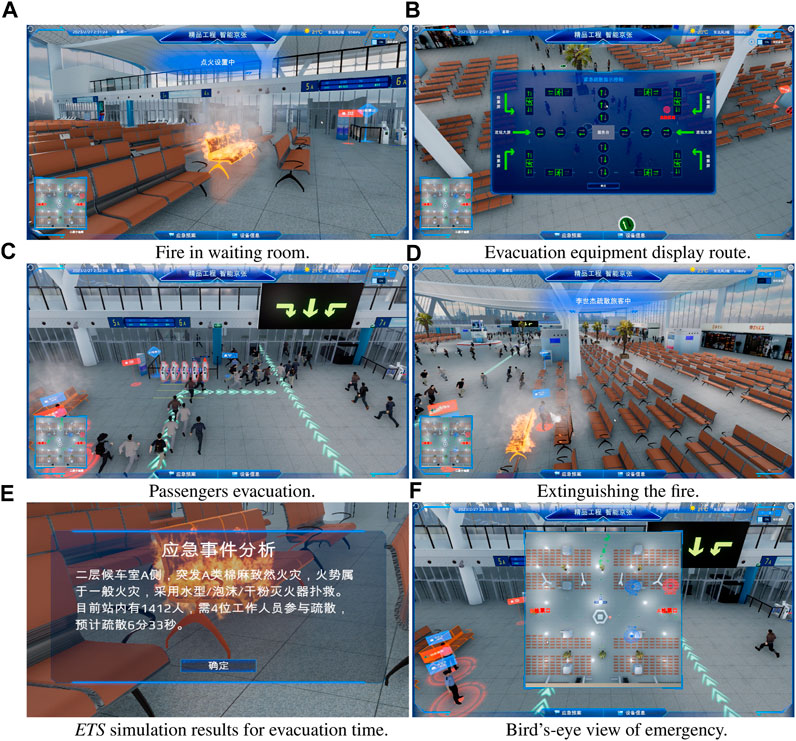
FIGURE 5. Fire scenario. (A) Fire in waiting room. (B) Evacuation equipment display route. (C) Passengers evacuation. (D) Extinguishing the fire. (E) ETS simulation results for evacuation time. (F) Bird’s-eye view of emergency.
By simulating emergency disposal plans in the event of a fire scenario, ETS can improve the disposal process and achieve desired outcomes. These outcomes are illustrated in Figure 5E, which displays the analysis and results of the simulation of fire disaster emergency disposal plans. The station has 1,412 individuals, and four staff members are responsible for guiding passenger evacuation (T8). The evacuation takes 6 min and 33 s to complete. Conducting emergency drills for ETS in fire scenarios allows staff to practice responding to simulated fire outbreaks in various locations, thereby enhancing their preparedness. It also provides an overview of the entire emergency disposal process, including resource location, disaster location, and passenger evacuation, among other elements, as shown in Figure 5F. The red circle marks the location of the accident, while the blue circle indicates the position of emergency resources.
5.2 Flood
For the scenario of flood, we set up a overall process covering the water-level rise, report, disposal, and conclusion. Initially, the monitoring system provides an overview of the floodwater level entering the interior. As the water level continued to rise (T1), the floodwater submerged the security check instruments, as depicted in Figure 6A (highlighted in red). The station manager evaluated the severity of the disaster and instructed the implementation of emergency procedures (T2). At this point, the emergency level was determined to be level 3, and the ETS signaled the initiation of the emergency response (P3). The emergency tasks were assigned to staff members at each location. These tasks included running to designated locations (P6) and executing assigned duties (T8) for some staff members, while equipment displayed emergency information (T6 and T10), and some staff members directed the evacuation of passengers (P9).
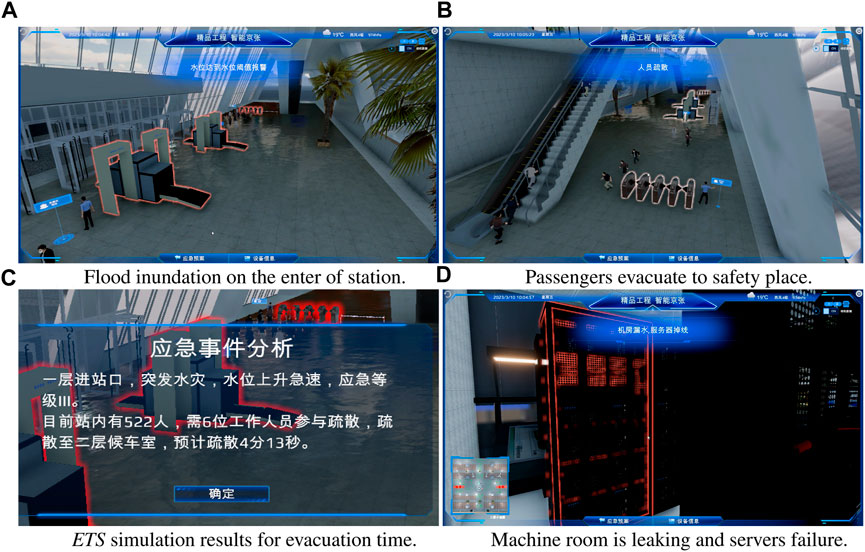
FIGURE 6. Flood scenario. (A) Flood inundation on the enter of station. (B) Passengers evacuate to safety place. (C) ETS simulation results for evacuation time. (D) Machine room is leaking and servers failure.
The passengers adhered to the instructions given by the staff and utilized the evacuation equipment in order to carry out an organized evacuation process (T13), as illustrated in Figure 6B. The staff then proceeded to open the pump (P14) and restore the scene once the pumping was completed at (P15). A report was compiled to document the conclusion of the incident, which is known as the emergency disposal report (P16). Additionally, the emergency disposal plan simulation outlines the plans execution process and results. The flood simulation results, presented in Figure 6C, indicate that the disposal process involved the utilization of pumping pumps, the participation of 6 workers, and the evacuation of 522 individuals from the station. All these actions were successfully executed within a time frame of 4 min and 13 s. Furthermore, conducting emergency drills in flood scenario allows for setting the scale of water and simulating damage to various equipment, such as machine room leakage, as demonstrated in Figure 6D. This facilitates the smooth execution of the flood emergency drill.
5.3 Earthquake
For the scenario of earthquake, passengers experienced a sense of panic upon receiving an earthquake warning (P1), as illustrated in Figure 7A. The staff on duty immediately responded to the warning and notified the station manager, who evaluated the situation and initiated the emergency protocol (T3). The assigned staff members were responsible for implementing emergency procedures, including contacting the local earthquake rescue department (T5), moving quickly to designated locations (T6), and disseminating information about the emergency train stop (P7), as demonstrated in Figure 7B. The staff successfully coordinated the evacuation of passengers (P9), guiding them in an orderly manner using evacuation equipment and staff assistance (T13), as shown in Figure 7C. The entire earthquake scenario was simulated by the solution, which provided valuable insights into the implementation process and the outcomes of the plans. The results of the earthquake simulation, as presented in Figure 7D, indicated that there were 1,478 individuals present in the station during the evacuation, involving the participation of 12 workers and lasting for a duration of 9 min and 46 s.
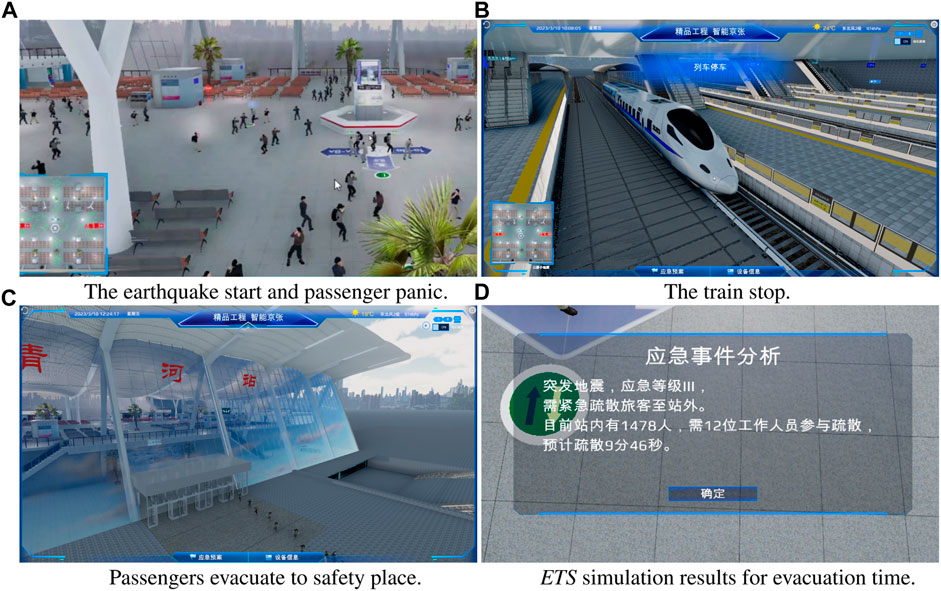
FIGURE 7. Earthquake scenario. (A) The earthquake start and passenger panic. (B) The train stop. (C) Passengers evacuate to safety place. (D) ETS simulation results for evacuation time.
5.4 Social security incident
The social security situation is employed to tackle the disturbance created by individuals who present a threat to the station. An undisciplined person set fire to their carry-on luggage (T1), as illustrated in Figure 8A. The responsible staff detected it and immediately notified the station manager to commence emergency disposal. The manager evaluated and initiated the emergency response (T3). Subsequently, the station staff contacted the local public security department (P5), and the public security personnel quickly arrived at the designated location (T5), while the station staff equipped with mobile screens arrived at the assigned site (P6) as depicted in Figure 8B.
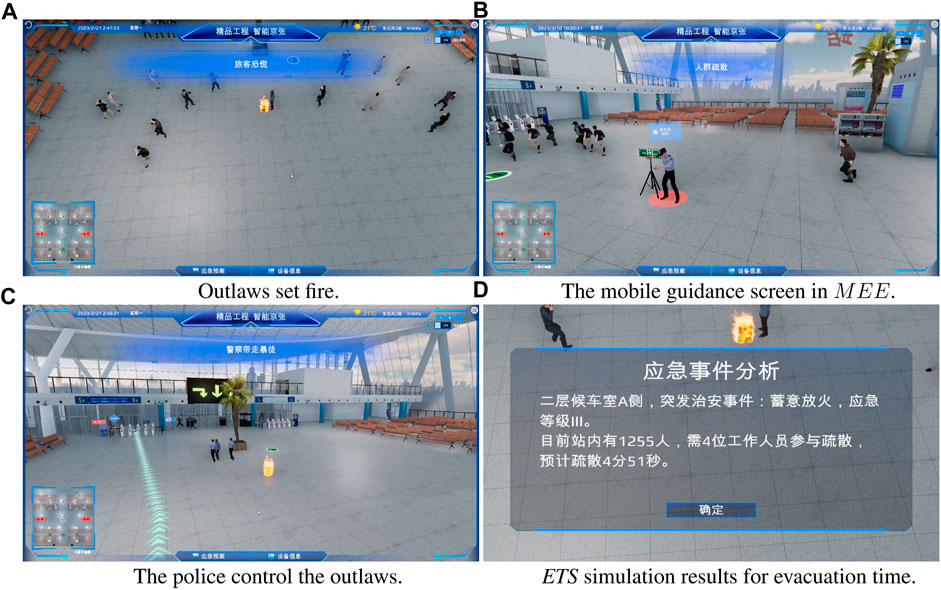
FIGURE 8. Social security incident scenario. (A) Outlaws set fire. (B) The mobile guidance screen in MEE. (C) The police control the outlaws. (D) ETS simulation results for evacuation time.
Simultaneously, additional personnel obtained fire extinguishers to handle the fire (P6), while a staff member organized the passengers’ evacuation according to prescribed procedures (P9). Public security personnel apprehended the culprits (T12) and restored order to the scene, as shown in Figure 8C. The passengers ensured an orderly evacuation process by complying with staff instructions and the displayed evacuation equipment routes (T13). Lastly, a report on emergency disposal was compiled to document the conclusion of the incident (P16). The simulation process and results are provided by ETS. According to Figure 8D, there were 1,255 individuals in the station, requiring the involvement of 4 personnel for guidance, with the entire evacuation process taking 4 min and 51 s.
5.5 Public health event
In the event of a public health emergency at a station, the station personnel will receive notification of a passenger carrying a contagious disease. The alert message will appear on the ETS (P1), prompting the station manager to initiate emergency protocols and release information to staff members (P3). A staff member will then contact the local epidemic department (T4), while another staff member locates the infected passenger at the designated location (P6) as illustrated in Figure 9A, closing the entrance gate to prevent further spread of the disease (P7) as illustrated in Figure 9B. The epidemic prevention department will then rescue the passenger (P8).
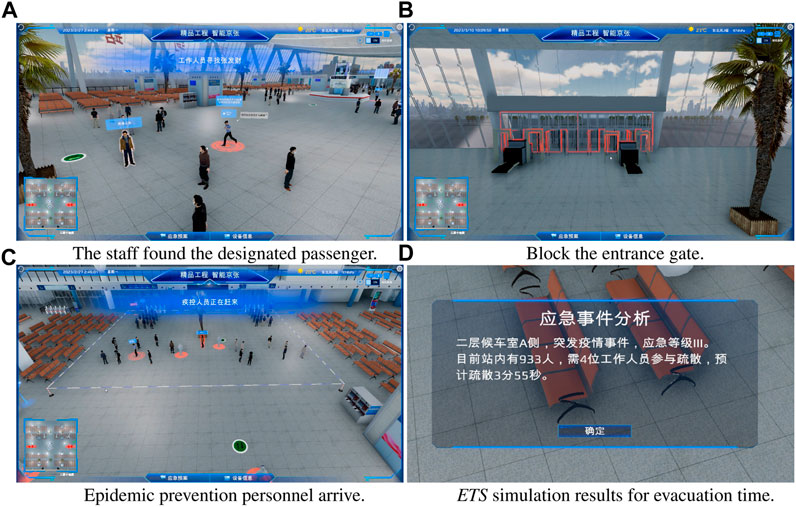
FIGURE 9. Public health event scenario. (A) The staff found the designated passenger. (B) Block the entrance gate. (C) Epidemic prevention personnel arrive. (D) ETS simulation results for evacuation time.
To prevent the spread of the disease, individuals who have had no contact with the infected passenger will be screened and evacuated according to staff guidance (T13). The disposal staff will erect an isolation barrier (P14) as illustrated in Figure 9C. Once the situation is fully under control, emergency protocols will be terminated, and an emergency disposal document will be created (P16). The simulation results of public health event are presented in Figure 9D, showing that 933 people were in the station and that four workers were required for the evacuation task, which took 3 min and 55 s.
6 Usability evaluation
In order to validate the efficacy and efficiency of the ED4D, we conducted an assessment from three different perspectives: replication of real-world scenarios, simulation of emergency scenarios, and user-friendliness. The replication of real-world scenarios was utilized to gauge the degree of similarity between the virtual entity’s and the physical entity’s location, structure, quantity, and information data. The simulation of emergency scenarios was employed to assess the functional accuracy of the emergency process, with a focus on verifying whether the emergency treatment digital twin meet actual operational requirements and whether any critical steps are missing or inconsistent with reality. User-friendliness was measured by evaluating the ease of use and acceptability of the digital twin during practical use, including aspects such as ease of operation and the difficulty of task completion.
6.1 Questionnaire design
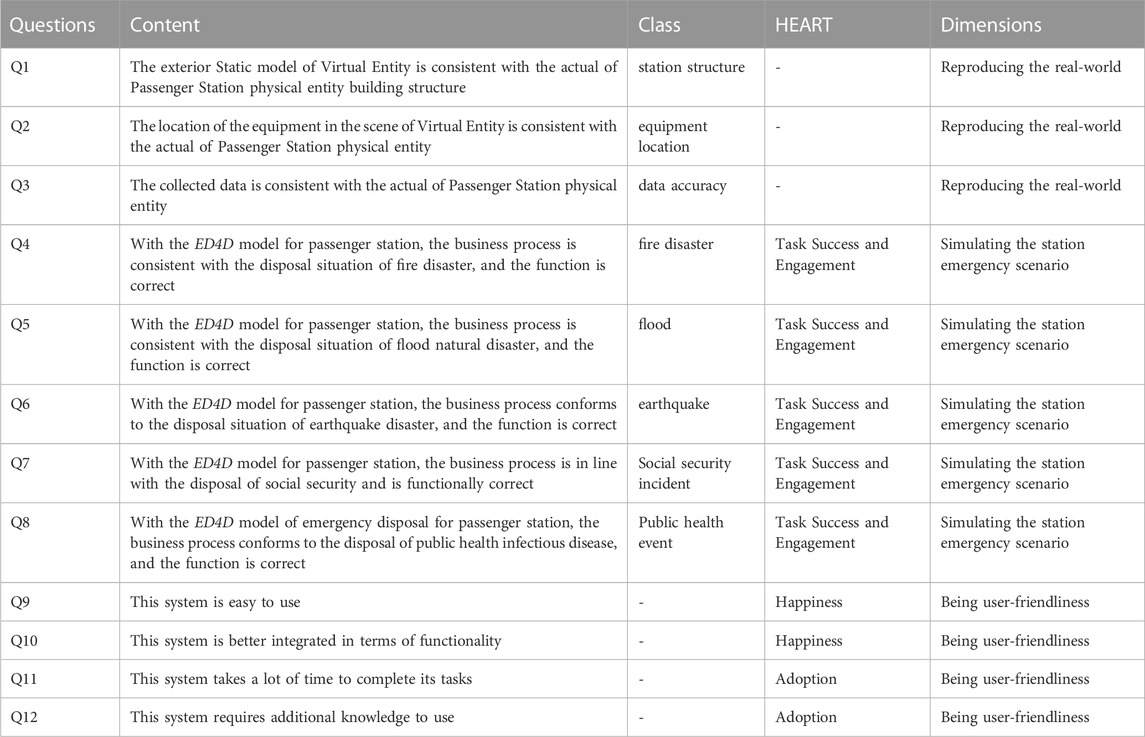
The questionnaire was specifically designed to cover the three evaluation aspects. The questionnaire was developed based on the usability metric from user experience framework [44], incorporating the core principles of HEART [45]. The scores were calculated using the SUS [43] based on the search questionnaire. Retaining happiness, engagement, adoption, and task success, the core idea of HEART discarded retention, which was not relevant to the application scenario, as it is intended as a tool in the workplace. After-Scenario Questionnaire [44] was utilized to assess usability, and the results were obtained through questionnaire research and subsequently analyzed.
The questionnaire consists of 12 inquiries, whose specifics are presented in Table 4. The inquiries for reproducing the real-world were designed in terms of station structure, equipment location, and data accuracy. For the simulation of the station emergency scenario, we asked questions about the correctness of the process in five scenarios by using the engagement and task success contents of the core idea of HEART [45]. The being user-friendliness concerns the happiness and adoption of system.
Each inquiry is graded on a scale of “1″ to “5″, wherein “1″ represents strong opposition, “2″ denotes opposition, “3″ represents neutrality, “4″ means agreement, and “5” signifies strong agreement. Questions 1 through 10 are intended to measure positive attitudes, while questions 11 and 12 are for negative attitudes. The SUS score (Brooke, 2013) is determined using Eq. 6.
Where Ps represents the cumulative sum of positive questions by an individual, Ns represents the cumulative sum of negative; S represent an individual’s score, 12 represents the total number of questions, c signify a correction factor expressed as a percentage. The scores of each participant are tallied, with the positive question score being the original score minus 1. Meanwhile, the negative question score is obtained by subtracting the original score from 5. The scores for all 12 questions are added up and converted to a percentage scale. For the purpose of our analysis, we shall designate c as 4.
6.2 Experimental evaluations
In our evaluation, a group of 9 individuals participated, among which 6 had previous experience in passenger transportation, while 2 held managerial experience. Notably, 7 of them, accounting for 77.7%, possessed expertise in emergency disposal. The average age of the participants was calculated to be 34.22 years, with an average career length of 10.33 years. The evaluator conducted the trial through an online platform, utilizing a hardware configuration that consisted of a NVIDIA GeForce RTX 3080Ti graphics card.
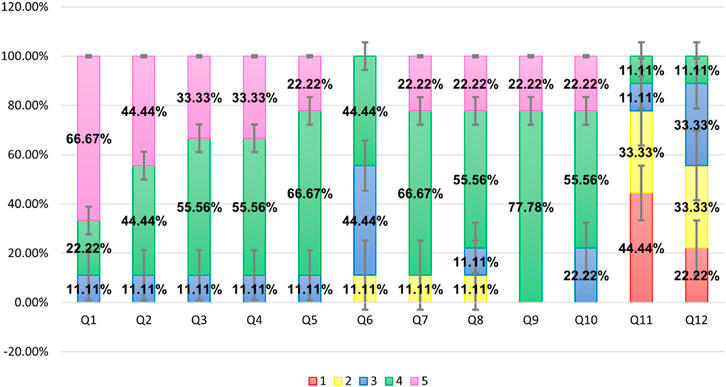
In Figure 10, one can observe the distribution of scores for each inquiry, where the color red corresponds to a score of “1″, yellow of “2″, blue of “3″, green of “4″, and purple of “5”. For the first question, six individuals, accounting for 66.7%, provided a raw score of 5. For inquiries two to seven, eight individuals gave a raw score of 4 or greater. With respect to inquiries 8 and 10, seven individuals provided a raw score of 4 or greater. As for inquiry 9, all individuals provided a score of 4 or greater. For inquiry 11, which follows a “the smaller, the better” format, four individuals selected a score of 1. Concerning inquiry 12, five individuals selected a score of 2 or less. In regards to inquiries 4, 5, and 7, the present disposal process aligns with our simulations, underscoring the effectiveness of the ED4D model that has been developed. The short error bars illustrated in the graph suggest the data’s reliability.
The data in Table 5 presents the mean and standard deviation for each question. The assessment of inquiry 1, 2, and 3 pertains to the precision of simulating real-world scenarios. The mean scores for each inquiry are 4.56, 4.33, and 4.22, respectively. Their aggregate mean score is 4.37, with a standard deviation of 0.01. The examination results validate that the exterior static model of MEE of ED4D agrees well with SPE.
The inquiries 4, 5, 6, 7, and 8 serve to assess the accuracy of the simulation of emergency scenarios. The assessment reveals an overall mean score of 3.91, with a standard deviation of 0.11. More specifically, the mean scores for each individual inquiry are 4.22, 4.11, 3.33, 4.00, and 3.89. The results of the evaluation demonstrate that scenarios related to fire disaster, flood, and social security incident accurately represent reality with a high degree of precision. With regards to inquiry 6, which pertains to the disposal process for earthquake emergency, users contend that the magnitude of the earthquake should factor into the process, with earthquake below level 3 not requiring consideration. The existing process aligns with the disposal process for earthquake between levels 3 and 6, but is not applicable for earthquake of level 8 or higher. Lastly, in relation to inquiry 8, the existing process for the disposal of public health event scenario is consistent with the prescribed disposal process for the period spanning 2020 to December 2022. However, it is no longer applicable to the disposal process for the new crown epidemic, as policy adjustments were made in 2023.
The inquiries 9 and 10 are utilized to assess the level of contentment. The overall average score obtained stands at 4.11, with a standard deviation of 0.12. The average rating for each question is established at 4.22 and 4.00 respectively. Inquiries 11 and 12 are employed to assess the level of acceptance. The overall average score obtained is 2.11 (note that a lower score indicates better performance), with a standard deviation of 0. The average rating for each question is established at 1.89 and 2.33 respectively. The evaluation results clearly indicate that the functioning of ETS is uncomplicated and user-friendly.
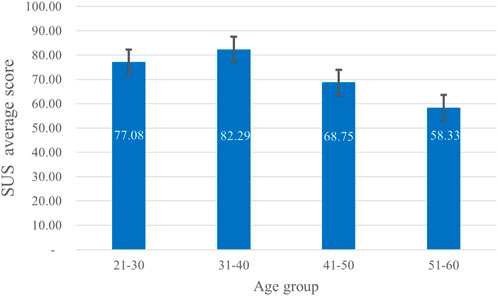
The distribution chart in Figure 11 illustrates the mean scores and number of survey participants in each age group for SUS scores. The evaluation revealed that the 21–30 age group obtained an average score of 77.08, while the 31–40 age group achieved the highest mean score of 82.29. In contrast, the 41–50 age group scored 68.75, and the 51–60 age group scored 58.33. The error bar is relatively short. Furthermore, the nine evaluators who participated in the survey received a mean score of 76.38 points, surpassing the minimum score of 74.1 points, which earned the system a rating of acceptable and the evaluators a grade of good [51,52].
7 Conclusion
To facilitate the training of station personnel in emergency protocols, this research paper has implemented a digital-twin-based approach to create an ED4D model for emergency simulation. The model entails the extraction of various emergency scenarios, which are then digitized using GSPN. This process replicates the actual conditions of the physical world within a virtual environment and facilitates the exchange of information between the two spaces. The successful application of this model in constructing multiple emergency scenarios at Qinghe Station, including simulations of fire, natural disasters such as flood and earthquake, social security incident, and public health event, has enabled the effective simulation of emergency procedures and the execution of emergency drills with greater efficiency. In comparison to tabletop exercises and live drills, this solution offers an immersive experience while conserving resources, making it easily adaptable to various potential hazards.
Furthermore, we have evaluated the application in three key aspects: the replication of the real world, the simulation of the station emergency process, and user-friendliness. Based on the System Usability Scale (SUS) evaluation, the overall conclusion was graded as good, indicating that the application is suitable for emergency response in passenger stations. This model allows for the validation of emergency plans and the identification of vulnerabilities in the response process. It assists personnel in adjusting resource allocation and strengthening weak areas, thereby enhancing the efficiency of emergency response strategies. Additionally, it establishes a solid foundation for the digitalization and informatization of the emergency response modeling process. Furthermore, the ED4D model enables immersive drills for various disaster events, thereby improving the emergency response skills of staff members.
The developed ED4D model demonstrates significant applicability as it can encompass the entire process of various disasters, including pre-event preparation, mid-event management, and post-event recovery. Moreover, the design of the GSPN model allows for easy adaptation to other railway passenger stations, highlighting its wide-ranging applicability. Exterior Static models, such as personnel, trains, and equipment, can also be adjusted and reused in different scenarios, further enhancing the practical value and potential for widespread adoption of this research. It is worth noting that the system developed in this study is currently only operational on computers. Moving forward, our plan is to utilize mixed reality devices to observe staff behavior, thereby achieving an emergency twin service that accurately reflects the composition of real multi-class passengers.
Data availability statement
The original contributions presented in the study are included in the article/Supplementary Material, further inquiries can be directed to the corresponding author.
Author contributions
XW: Methodology, Software, Validation, Writing–original draft, Writing–review and editing. WB: Software, Validation, Writing–original draft, Writing–review and editing. YS: Writing–original draft, Writing–review and editing. GY: Software, Validation, Writing–original draft. CL: Software, Validation, Writing–original draft. XL: Software, Validation, Writing–original draft. KP: Software, Writing–original draft. JL: Validation, Writing–original draft.
Funding
The author(s) declare financial support was received for the research, authorship, and/or publication of this article. This paper Supported by the National Natural Science Foundation of China-China State Railway Group Co., Ltd. Railway Basic Research Joint Fund (Grant No.U2268217) and Scientific Funding for China Academy of Railway Sciences-Corporation Limited (No.2023YJ125, No.2021YJ183). The funder was not involved in the study design, collection, analysis, interpretation of data, the writing of this article, or the decision to submit it for publication.
Conflict of interest
Authors WB, GY, CL, XL, KP, and JL were employed by Institute of Computing Technology, China Academy of Railway Sciences Corporation Limited.
The remaining authors declare that the research was conducted in the absence of any commercial or financial relationships that could be construed as a potential conflict of interest.
Publisher’s note
All claims expressed in this article are solely those of the authors and do not necessarily represent those of their affiliated organizations, or those of the publisher, the editors and the reviewers. Any product that may be evaluated in this article, or claim that may be made by its manufacturer, is not guaranteed or endorsed by the publisher.
References
1. Lei L, Fuzhang W. Railway incident and emergency decision-making research. J Inst Disaster Prev (2012) 14:58–63. doi:10.3969/j.issn.1673-8047.2012.03.012
2. Zhuguo Y. Analysis and optimization strategies of emergency disposal for high speed railway. Railway Transport And Economy (2022) 44:90–5. doi:10.16668/j.cnki.issn.1003-1421.2022.07.14
3. Xiaoqing C, Liming J, Yong Q. Research on railway emergency management. J China Railway Soc (2012) 34:7–13. doi:10.3969/j.issn.1001-8360.2012.03.002
4. Lipare S, Bhavathankar P. Railway emergency detection and response system using iot. In: 2020 11th International Conference on Computing, Communication and Networking Technologies (ICCCNT); July 1-3, 2020; Kharagpur, India (2020). p. 1–7.
5. Tianyun S, Chunjia Z. Overall design and evaluation of intelligent railway passenger station system. Railway Comp Appl (2018) 27:9–16.
6. Jianxi X, Zhao T, Xiaolin Y, Yinyu N, Zong M, Xihui W, et al. A vr-based the emergency rescue training system of railway accident. Entertainment Comput (2018) 27:23–31. doi:10.1016/j.entcom.2018.03.002
7. Xingyu L. Research on emergency desktop drill system based on unity3d (2022). p. 3–13. Available at: https://cdmd.cnki.com.cn/Article/CDMD-10619-1022524942.htm.
8. Yuefeng Z, Jianmin H, Jianhua H. Modeling and analysis of emergency management workflow based on gspn. Stat Decis (2012) 4:44–7.
9. Peng W, Qiang H, Guozhu L. Xml oriented workflow modeling based on restricted digraph. Nat Sci Edition (2007) 28:240–3. doi:10.3969/j.issn.1672-6987.2007.03.015
10. Yuren S, Ying D. Comparison of eepc and petri net in modeling of business process improvement. J Chongqing Univ Technology (Natural Sci) (2013) 25:87–91. doi:10.3969/j.issn.1674-8425-B.2011.07.011
11. Molloy M. Performance analysis using stochastic petri nets. IEEE Trans Comput (1982) 31:913–7. doi:10.1109/tc.1982.1676110
12. Yi X, Renzhong T, Yaping M. Storage and retrieval of business process simulation models based on idef3. Syst Eng Theor Pract (2005) 25:69–75. doi:10.3321/j.issn:1000-6788.2005.12.011
13. Qing L, Wei L, Mengzhen G, Hongwei S. Modeling and analysis of emergency decision making based on logical probability game petri net. Comp Sci (2022) 49:294–301. doi:10.11896/jsjkx.210300224
14. Xunqing W, Yongjian L, Huali S. A scenario evolution model for mass emergencies based on stochastic petri nets. Manag Rev (2014) 26:53–62+116. doi:10.14120/j.cnki.cn11-5057/f.2014.08.046
15. Chao Q, Lanjun L. Analysis of flood disaster case based on event chain and generalized stochastic petri nets. J Wut (Information Manag Engineering) (2017) 39:130–4. doi:10.3963/j.issn.2095-3852.2017.02.002
16. QiuQing L, XueLin W. Evaluation of meteorological disaster emergency capability based on fuzzy petri net. J Henan Polytechnic Univ (Natural Science) (2018) 37:32–7. doi:10.16186/j.cnki.1673-9787.2018.03.5
17. Runchao M, Xiangwei L, Yixuan C, Haiyan D. Research on customs clearance mode of China-laos railway based on petri-Markov chain. China Transportation Rev (2023) 02:1–9. Available at: https://kns.cnki.net/kcms/detail/11.1197.u.20220512.0948.002.html.
18. Zhibo Z, Qiyuan P, Lingshuan Z, Denghui L, Bin L. Research on structural analysis thod of high speed raitway emergency dispatching cottaborative disposal process. Railway Transport and Economy (2021) 43:120–7. doi:10.16668/j.cnki.issn.1003—1421.2021.04.19
19. Zixian Y, Junhua C. A simulation study of emergency evacuation of railway passenger station under complex passenger flow condition. Railway Transport and Economy (2020) 42:66–71. doi:10.16668/j.cnki.issn.1003-1421.2020.11.12
20. Zelong L. In: MS thesis, editor. Beijing: Beijing Jiaotong University (2021). p. 26–43.Research on passenger safety evaluation and risk control of high speed railway station based on fuzzy petri net and mop
21. Fei T, Weiran L, Meng Z. Digital twins five-dimensional model and its application in ten fields. Comp Integrated Manufacturing Syst (2019) 25:1–18. doi:10.13196/j.cims.2019.01.001
22. Singh M, Srivastava R, Fuenmayor E, Kuts V, Qiao Y, Murray N, et al. Applications of digital twin across industries: a review. Appl Sci (2022) 12:5727. doi:10.3390/app12115727
23. Yicheng S, Yuqian L, Jinsong B, Fei T. Prognostics and health management via long short-term digital twins. J Manufacturing Syst (2023) 68:560–75. doi:10.1016/j.jmsy.2023.05.023
24. Baicun W, Huiying Z, Xingyu L, Geng Y, Pai Z, Ci S, et al. Human digital twin in the context of industry 5.0. Robotics and Computer-Integrated Manufacturing (2024) 85:102626. doi:10.1016/j.rcim.2023.102626
25. Luther W, Baloian N, Biella D, Sacher D. Digital twins and enabling technologies in museums and cultural heritage: an overview. Sensors (2023) 23:1583. doi:10.3390/s23031583
26. Maria P, Valentina Y, Ekaterina R, Natalia K, Peter T, Tatiana D. Digital twin concept: healthcare, education, research. J Pathol Inform (2023) 14:100313. doi:10.1016/j.jpi.2023.100313
27. Falkowski P, Osiak T, Wilk J, Prokopiuk N, Leczkowski B, Pilat Z, et al. Study on the applicability of digital twins for home remote motor rehabilitation. Sensors (2023) 23:911. doi:10.3390/s23020911
28. Rajanikanth A, Swapna M, Kaladevi A, Rohith C, Sandhya M, Bhat CR. The novel emergency hospital services for patients using digital twins. Microprocessors and Microsystems (2023) 98:104794. doi:10.1016/j.micpro.2023.104794
29. Yilong H, Yinbo L, Yongkui L, Bin Y, Lingyan C. Digital twinning for smart hospital operations: framework and proof of concept. Tech Soc (2023) 74:102317. doi:10.1016/j.techsoc.2023.102317
30. Valerian Vanessa T, Joseph Handibry Mbatu T, Fonbeyin Henry A. Technologies for digital twin applications in construction. Automation in Construction (2023) 152:104931. doi:10.1016/j.autcon.2023.104931
31. Victor Adetunji A, Robert Christian M, Yihai F. Digital twin technology for thermal comfort and energy efficiency in buildings: a state-of-the-art and future directions. Energ Built Environ (2023). doi:10.1016/j.enbenv.2023.05.004
32. Liu J, Li C, Bai J, Luo Y, Lv H, Lv Z. Security in iot-enabled digital twins of maritime transportation systems. IEEE Trans Intell Transportation Syst (2021) 1–9. doi:10.1109/tits.2021.3122566
33. Vladimir A, Alexander S, Andrey B, Aleksey R. Utilizing digital twin for maintaining safe working environment among railway track tamping brigade. Transportation Res Proced (2022) 61:600–8. XII International Conference on Transport Infrastructure: Territory Development and Sustainability (TITDS-XII). doi:10.1016/j.trpro.2022.01.097
34. Sakdirat K, Qiang L. Digital twin aided sustainability-based lifecycle management for railway turnout systems. J Clean Prod (2019) 228:1537–51. doi:10.1016/j.jclepro.2019.04.156
35. Shiyang Z, Alexander M, Yuxi X, Manfred G. A machine-learning-based surrogate modeling methodology for submodel integration in the holistic railway digital twin platform. Proced CIRP (2023) 119:345–50. doi:10.1016/j.procir.2023.02.141
36. Shiyang Z, Stefan D, Rebecca N, Rainer R, Ozan K, Martin K, et al. A conceptual model-based digital twins platform for holistic large-scale railway infrastructure systems. Proced CIRP (2022) 109:362–7. doi:10.1016/j.procir.2022.05.263
37. Baek S, Gil H, Kim Y. Vr based job training system using tangible interactions. Sensors (2021) 21:6794. doi:10.3390/s21206794
38. Kwon J, Lee I, Park H, Kim S. Design of augmented reality training content for railway vehicle maintenance focusing on the axle-mounted disc brake system. Appl Sci (2021) 11:9090. doi:10.3390/app11199090
39. Dunwen L, Haoran J, Jian Yinghua J, Fengkai Q, Hui Y. Construction and research of emergency training system for tunnel fire based on virtual reality technology. J Saf Sci Tech (2019) 15:131–7.
40. Bo Z, Jun S, Lei S, Hongji X, Cheng Y. Design and realization of ship virtual fire training system based on hmd. J Syst Simulation (2019) 31:43–52. doi:10.16182/j.issn1004731x.joss.17-0182
41. Ping Z, Ruijiang P, Ziding C. Research on safety quality improvement of railway staff based on 3d emergency drill. China Saf Sci J (2018) 28:138–42.
42. Pei S, Weifang D, Wei Y. Research on the construction of a practical training system for railroad crew emergency drills based on vr technology. Sci Tech Vis (2018) 05:187–8.
43. Brooke J. Sus: a retrospective. Usability Stud (2013) 08:29–40. Available at: https://www.researchgate.net/publication/285811057_SUS_a_retrospective.
44. Lewis RJ. An after-scenario questionnaire for usability studies: psychometric evaluation over three trials. ACM SIGCHI Bull (1991) 23:79. doi:10.1145/126729.1056077
45. Finstad K. The usability metric for user experience. Interacting Comput (2010) 22:323–7. doi:10.1016/j.intcom.2010.04.004
47. Shenping H, Shengyuan L. Simulation modeling on emergency response process for lng-fueled vessel via gspn-mc method. China Saf Sci J (2021) 31:174–81. doi:10.16265/j.cnki.issn1003-3033.2021.10.024
48. Jianzhong C, Liangyou C. Extended event-process chain (eepc) and it’s application in brp. Syst Eng (2000) 01:42–8.
49. Yanxiang H, Hua S. Rules and implementation of converting stochastic petri net model to Markov chain. J Front Comp Sci Technolog (2013) 07:55–62. doi:10.3778/j.issn.1673-9418.1209025
50. Jialin Y, Siyuan Z. Research on the calculation model of the maximum assembling passengers in large high-speed railway station. J Railway Sci Eng (2019) 16:34–41. doi:10.19713/j.cnki.43-1423/u.2019.01.005
51. Jiajun H, Ruihua X, Ling H, Zhaohong H. Simulation model of evacuation process in metro station under dynamic and uncertain environment. J Transportation Syst Eng Inf Tech (2011) 18:164–70. doi:10.16097/j.cnki.1009-6744.2018.02.025
Keywords: railway passenger stations, digital twin, emergency, emergency drill, disposal plan
Citation: Wang X, Bai W, Su Y, Yang G, Li C, Lv X, Peng K and Li J (2024) Digital twin for multi-scenario emergency of railway passenger stations. Front. Phys. 11:1291785. doi: 10.3389/fphy.2023.1291785
Received: 10 September 2023; Accepted: 12 December 2023;
Published: 04 January 2024.
Edited by:
Jianrong Wang, Shanxi University, ChinaCopyright © 2024 Wang, Bai, Su, Yang, Li, Lv, Peng and Li. This is an open-access article distributed under the terms of the Creative Commons Attribution License (CC BY). The use, distribution or reproduction in other forums is permitted, provided the original author(s) and the copyright owner(s) are credited and that the original publication in this journal is cited, in accordance with accepted academic practice. No use, distribution or reproduction is permitted which does not comply with these terms.
*Correspondence: Wei Bai, YmFpd2Vpc3h1QDE2My5jb20=
 Xiaoshu Wang
 Wei Bai2*
 Yuanqi Su
