- 1School of Electronic Engineering, Xi’an Aeronautical Institute, Xi’an, China
- 2School of Optoelectronic Engineering, Xi’an Technological University, Xi’an, China
Cherries are a nutritionally beneficial and economically significant crop, with fruit ripeness and decay (rot or rupture) being critical indicators in the cherry sorting process. Therefore, accurately identifying the maturity and decay of cherries is crucial in cherry processing. With advancements in artificial intelligence technology, many studies have utilized photographs for non-destructive detection of fruit appearance quality. This paper proposes a cherry appearance quality identification method based on the Swin Transformer, which utilizes the Swin Transformer to extract cherry image feature information and then imports the feature information into classifiers such as multi-layer perceptron(MLP) and support vector machine(SVM) for classification. Through the comparison of multiple classifiers, the optimal classifier, namely, MLP, in combination with the Swin Transformer is obtained. Furthermore, performance comparisons are conducted with the original Swin-T method, traditional CNN models, and traditional CNN models combined with MLP. The results demonstrate the following: 1) The proposed method based on the Swin Transformer and MLP achieves an accuracy rate of 98.5%, which is 2.1% higher than the original Swin-T model and 1.0% higher than the best-performing combination of traditional CNN model and MLP. 2) The training time required for the Swin Transformer and MLP is only 78.43 s, significantly faster than other models. The experimental results indicate that the innovative approach of combining the Swin Transformer and MLP shows excellent performance in identifying cherry ripeness and decay. The successful application of this method provides a new solution for determining cherry appearance ripeness and decay. Therefore, this method plays a significant role in promoting the development of cherry sorting machines.
1 Introduction
Cherry is a highly productive fruit that is widely grown in world wide. Compared to other fruits, cherry is high in microelement of iron which can enhance the hematopoietic function of the human body and alleviate anemia symptoms. Tieton cherry is a late-ripening cherry varieties, which is not only rich in vitamin A and vitamin C to maintain healthy organ functioning, but also contain antioxidants to strengthen the immune system, reduce inflammation. Besides the Tieton cherry also provides calcium to protect bones and teeth. Tieton cherry is a seasonal fruit which can usually be made into fresh fruit or dried fruit [1]. The ripeness and decay of cherries is one of the important evaluation indexes of fruit quality. Agricultural wastage is partly due to the poor marketability of the related agricultural products [2]. Cherries with bright colors and regular shapes can attract customers in domestic and foreign markets. Therefore, grading and sorting processes play an important role in providing high quality fruits to consumers. With the rapid growth of cherry production, the demand for cherry grading and sorting is increasing. Currently, most cherries are sorted manually by workers, which is tedious and have low sorting efficiency [3]. The efficiency of cherry sorter operation affects the rate of sales of products in the market. Consequently, it is necessary to develop a high-performance cherry sorting machine to improve the efficiency of cherry appearance ripeness and decay identification, and improve the speed of sorting and processing. This would further allow high quality cherries to access fruit markets.
In recent years, advancements in computer performance have greatly enhanced deep learning-based object recognition techniques [4–7]. Concurrently, this has also introduced novel solutions for crop identification. As a result, nowadays, the control and monitoring of fruit appearance quality by electronic ways such as machine vision and deep learning has been increasingly taking the place of manual means in some developed countries [8–11]. Compared with the manual detection of cherry appearance quality, the advantages of machine vision and deep learning techniques include high accuracy and detection speed, high flexibility and low costs, program-mability. The most important is that electronic ways can achieve non-destructive identification. Elmasry et al. (2012) utilized visual machine to identify irregularly shaped potatoes images, and the average accuracy of this method was 96.2% [12]. Femling et al. used machine learning to create a system to achieve vegetables and fruits identification in the retail market [13]. This system minimizes the number of human computer interactions and speeds up the recognition process. Sambasivam et al. achieve cassava disease detection and classification with deep convolutional neural networks, and reported an accuracy score of over 93% [14]. Bao et al. set up a lightweight CNN model to identify wheat ear diseases. They obtained 94.1% accuracy for the model meanwhile the parameters are only 2.13 M [15]. Gao et al. selected spectral features and utilized CNN to classify the ripe and early ripe strawberry, which obtained the accuracy of 98.6% for strawberry dataset [16]. Dong et al. proposed a diseases and pests automatic recognition system based on improved AlexNet model which has a good performance [17]. In order to maximize the profit of cucumbers fruit, Kheiralipour and Perma (2017) proposed graded system of different cucumber forms using image processing technique and artificial neural networks. This method has an accuracy of 97.1% for identifying cucumber forms [18].
Although CNN has achieved satisfactory achievement in the task of fruit identification, these methods of based on CNN still have some shortcomings, since these methods have limitations in the modeling of global information [19]. When CNN extracting target features, only if stack many layers can obtain the global features. With the emergence of more efficient structures, visual tasks with transformer have become a new research orientation in order to reduce structural complexity and improve training efficiency. Transformer captures spatial patterns and non-local dependencies by the attention mechanisms [20], which has been successfully used to language recognition [21], image generation [22], object detection [23], text image synthesis [24], and video understanding [25]. Some transformer-based architectures demonstrate powerful capabilities for visual task processing, such as Visual Transformer (ViT) [26]. Zheng et al. uses ViT-B/32 extract the class token and imports it into the support vector machine to identify the appearance quality of strawberry, eventually accuracy achieving 98.1% [27]. In addition, Swin Transformer is an innovative vision model for transformers that uses a hierarchical architecture to obtain the flexibility to model at a variety of scales [28]. Zheng et al. utilizes the Swin Transformer to extract image features and import the features into MLP for identifying strawberry, and the accuracy reaches 98.45% [29].
Among the many physical characteristics used as the evaluation criteria of agricultural products in the grading process of cherries, the level of ripeness and decay are the most important. Therefore, one of the requirements set by the market standards for cherry is the appearance quality of the product. Therefore, the aim of this research is to propose a practical method based on improved Swin Transformer to classify cherry appearance quality with a very high accuracy. Firstly, Swin Transformer is used to extract cherry image features, and then imported into MLP to realize cherry recognition. Compared with other methods, this method can achieve higher recognition accuracy.
2 Materials and methods
2.1 Materials
2.1.1 Dataset and experimental environment
In this study, the data set consisted of 4,669 cherry images taken by a mobile phone (HUAWEI nova 9) from the cherry orchard of Bailuyuan in Xi’an. The cherry dataset utilized in this study exclusively comprises a single cultivar, namely, Tieton cherry. Cherries are classified into three levels of ripeness: immature, mature, and over-mature. Adding broken categories, the cherry dataset is divided into four categories. Examples of cherry images with different ripeness and decay are shown in Figure 1. The appearance of each class has a very distinct character, such as the skin of broken cherries is wrinkled, rotten or cracking (Figure 1A); immature cherries have laurel-green or red-orange skin (Figure 1B); the surface of mature cherry is positive bright red (Figure 1C); it can be seen that if cherries are over mature, they would be dark purple, even black hues (Figure 1D); The size of the original image collected is large in this experiment, which reduces the accuracy and improves the training time during image analysis and processing [30]. Thus, in order to achieve higher recognition accuracy and less training time, the images were resized to 224 × 224. The 4,669 images are divided into training set and test set in the ratio of 8:2. Training and test samples are independent of each other in order to reduce the correlation between them.
The training of all network-models is done in a Personal Computer (PC). The experimental hardware environment includes an Intel Core i9-9900X CPU (3.50 GHz) and a NVIDIA RTX 2080Ti GPU. The software environment consists of Ubuntu 18.04 operating system, CUDA10.1 and cuDNN 8.04 for deep learning, Pytorch 1.7 as the neural network framework, and other important packages such as numpy 1.21.5 and scikit-learn 1.0.2.
2.1.2 Images enhancement
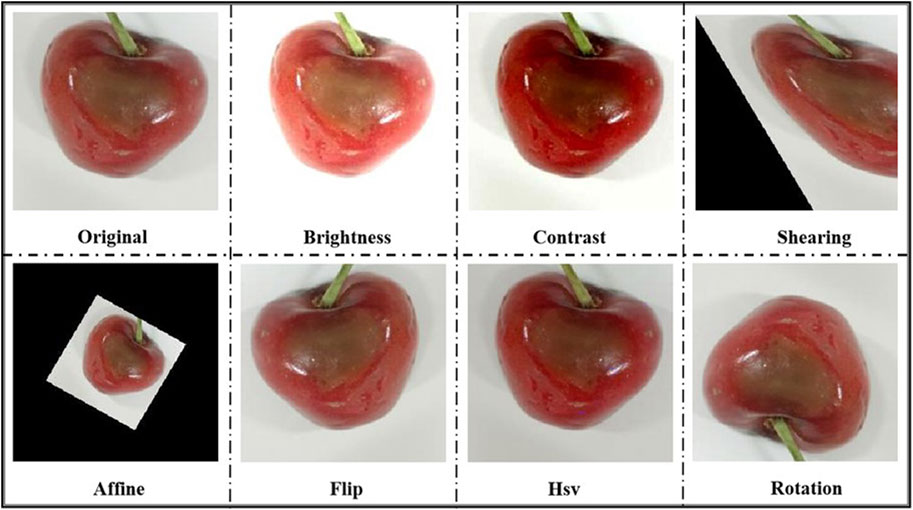
When deep learning training network, enough data is needed to complete the training process to satisfy the training requirements of convolutional neural network. And appropriate expansion of data set can improve the accuracy of recognition. Since the number of images broken category is not enough, data enhancement was used to increase the size of the data set. In the experiment, seven enhancement methods are applied to the images of broken category: 1) Randomly adjust the brightness of the image; 2) Randomly change the image contrast to obtain a new image; 3) Rotate at random angles; 4) Flip the cherry image vertically or horizontally; 5) Apply an affine transformation to obtain an enhanced image; 6) The dislocation transformation based on the horizontal or vertical direction to realize image geometric deformation; 7) Achieve HSV image enhancement by selecting a Hue value, a saturation value, and a lightness value. Eventually 1,302 images of broken category are produced, and Figure 2 shows the results of data enhancement.
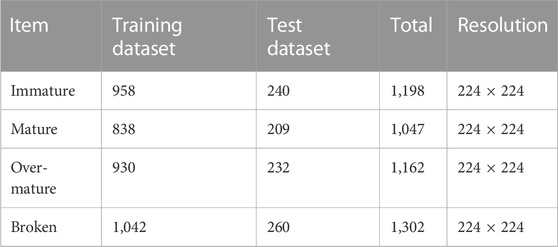
The final data distribution is shown in Table 1. The four types of datasets are evenly distributed, which avoids the overfitting of single sample data by the network and improves the generalization ability of the model.
2.2 Swin transformer
Swin Transformer is a deep learning model based on Transformer. Unlike the previous Vision Transformer (ViT), Swin Transformer is efficient and accurate, and can be used as the backbone of a universal computer vision. As shown in Figure 3A, in existing ViT, the feature image size is fixed and without being segmented, causing the computational complexity is quadratic to image size. In contrast, Swin Transformer constructs hierarchical feature maps, and the hierarchical feature representation was constructed by small image element and layer by layer neighborhood merging as illustrated in Figure 3B. Starting with small-sized gray patches and gradually merging with adjacent patches in deeper layers. The number of patches in red windows is fixed, and so the complexity is linear to image size. However, this approach will reduce connection between each window. To solve this problem, Swin Transformer adopts that shift of window partition, as shown in Figure 3C. The shifted windows connect the windows of the previous layer, providing connections between them.
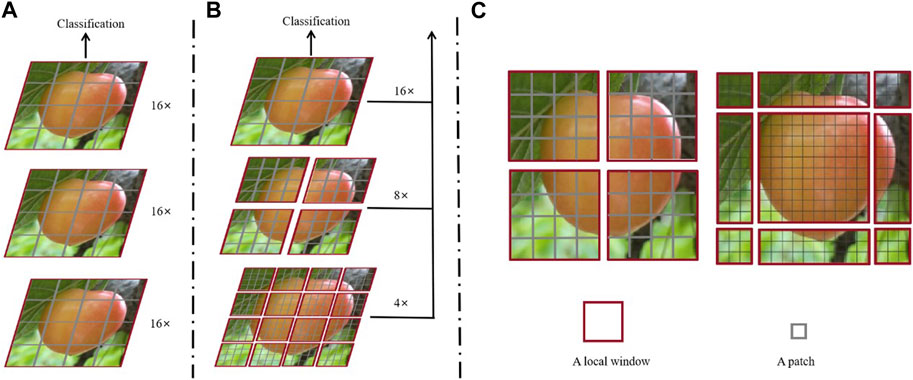
FIGURE 3. (A) The feature maps of ViT; (B) Swin Transformer builds hierarchical feature maps; (C) the shifted window approach for computing self-attention.
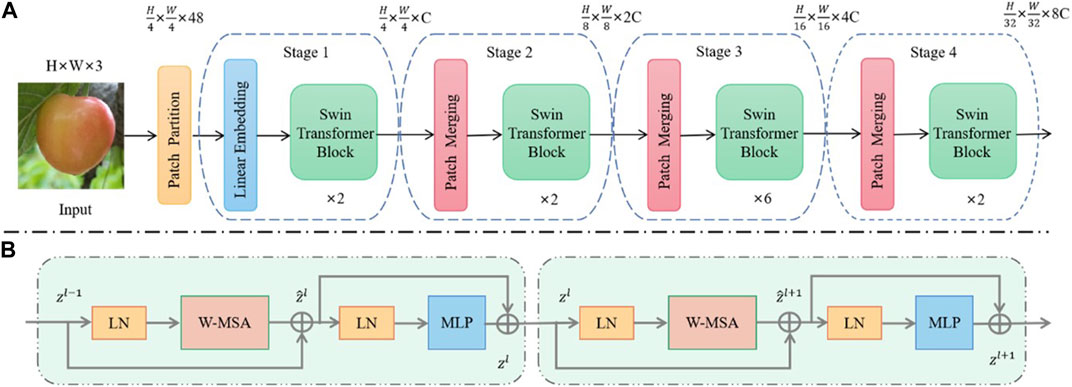
The basic architecture of the Swin Transformer is shown in Figure 4. First, the input RGB image is divided into non-overlapping patches through patch splitting module, and each patch is treated as a “token.” The patch splitting module made up Patch Partition and Linear Embedding. Then the feature maps of different scales are constructed through four stages, and each stage includes Swin Transformer blocks. Except for the first stage, Patch Merging operations are required for each stage before Swin Transformer Block. The main purpose is to downsample and generate features of different scales.
2.2.1 Swin transformer block
Swin Transformer is built on the basis of the Transformer block, by replacing the standard multi-head self attention (MSA) module with a module based on shifted windows (W-MSA and SW-MSA) while the other layers remain unchanged [31]. As observed in Figure 4B, each Swin Transformer block consists of a window-based multi-head self attention (W-MSA) module or a shifted window-based multi-head self attention (SW-MSA) module, followed by a 2-layer MLP with Gaussian Error Linear Unit (GELU) nonlinearity in between. A LN (LayerNorm) layer is added before each MSA module and each MLP module, and a residual connection is added after each MSA module and each MLP. The calculation of feature map in successive Swin Transformer blocks is shown below:
where
2.2.2 W-MSA and SW-MSA
When the conventional transformer block adopts MSA module, it performs global self-attention computation. As a result, a quadratic increase in the computation of the module with respect to the number of patch tokens. The computational complexity of the MSA is illustrated in Eq. 5. Where and are the height and width of the input image. For the W-MSA module, the pictures are divided into the windows in an evenly manner. The disadvantage is that the self-attention calculation only be carried out in each window, and information cannot be transferred between Windows. Assuming that each window is M in width and height, and then use the MSA module within h Windows. The computational complexity of the W-MSA is illustrated in Eq. 6. SW-MSA solves the problem of information communication between different Windows. Swin performs self-attention calculations in each window as shown in Figure 3B. This method improves the ability of model characterization.
2.3 Muti-layer perceptron
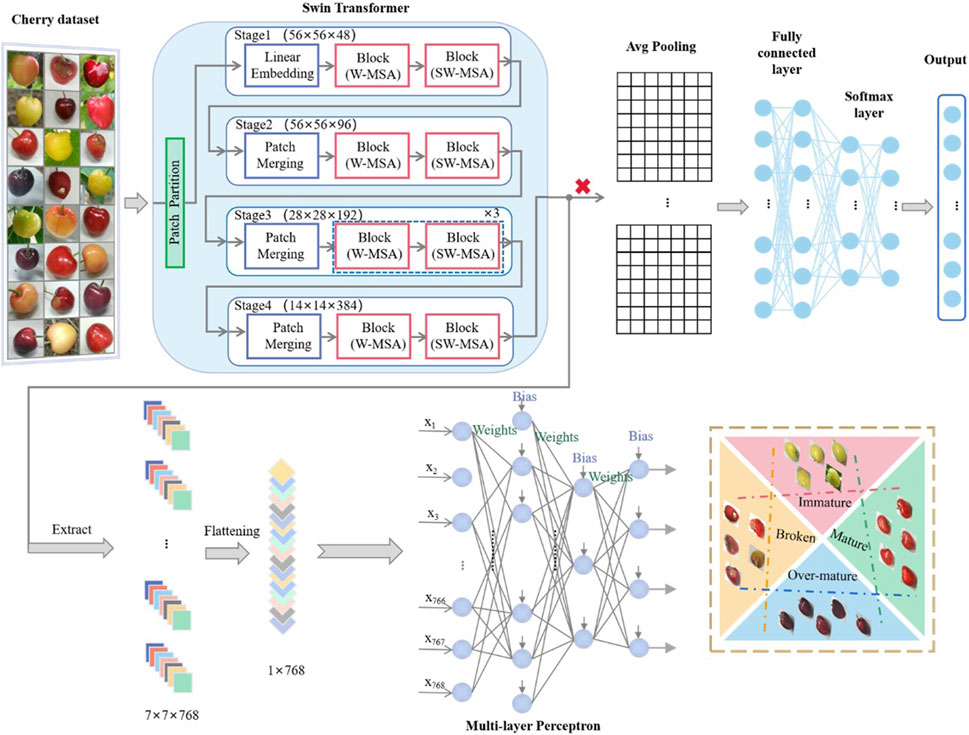
MLP is a dynamic classifier based on neural networks. The MLP classifier uses neural networks to deduce a hyperplane that distinguishes between different categories of cherries. The hyperplane is then used to perform the classification. In this study, cherry appearance ripeness and decay were classified into four categories, and the hyperplane that is farthest from the feature vector was chosen as the classification plane to classify each feature vector into one of the four categories. The MLP mainly consists of an input layer, a hidden layer, and an output layer, with each layer being fully connected to the adjacent layers. Its structure is shown in the Multi-layer Perceptron module in Figure 5.
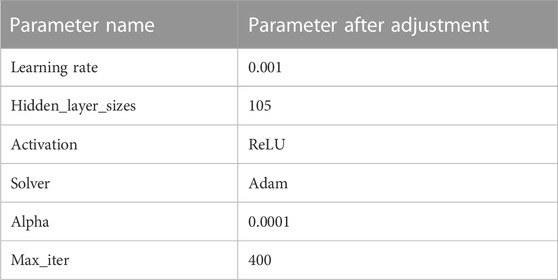
MLP has high recognition accuracy and faster classification speed. The hyperparameters of the classifier are the adjustment knobs that control the model structure and efficiency. In this experiment, the optimal parameter details that achieved the best recognition performance are shown in Table 2.
To measure the performance of the network during training, a loss function is used. Typically, the mean squared error function is employed, as shown in Eq. 7.
However, this function is usually non-convex, which can lead to finding a local optimal solution rather than a global optimal solution. Therefore, the following function is selected as the loss function:
where
The average value of the loss function for the entire training dataset is the cost function of the training set, as shown in Eq. 9:
It is evident that the cost function is a function of
2.4 Proposed method
It is well-known that a CNN model can be used as a feature extractor by removing the fully connected layers and using the remaining layers for feature extraction [32, 33]. Similarly, in this paper, the same approach is applied to the Swin Transformer model. The pre-trained parameters on ImageNet are used for extracting cherry image features, which enhances the model’s receptive field. Liu et al. proposed four models of Swin Transformer: Swin-B, Swin-T, Swin-S, and Swin-L [28]. Swin-T has a small model size, low floating-point operations per second (FLOPs), and high throughput, with values of 29M, 4.5G, and 755.2 image/s, respectively. Therefore, Swin-T is chosen as the feature extractor to avoid high computational complexity. The overall architecture is shown in Figure 5, where the input cherry image size is 224 × 224. The output features from the four stages of the Swin Transformer have a resolution of 77 and a channel dimension of 768D. Then, the features are flattened into a one-dimensional feature vector, which is inputted into an MLP for predicting the final cherry label.
2.5 Workflow diagram
Step-1:. Swin-T was used as a classifier to extract features of cherry image.
Step-2:. The extracted one-dimensional features are imported into ten classifiers such as MLP and SVM for comparison, and then the best combination Swin transformer and MLP is obtained.
Step-3:. Compare the performance of the combination of Swin-Transformer and MLP with the combination of CNN and MLP.
3 Results
3.1 Evaluation criteria
In this paper, the model’s performance is evaluated using six metrics, including accuracy, training time, precision, recall, FPR, and F1-score. The specific formula is shown in Table 3, where TP represents true positive, TN is true negative, FP is false positive, and FN is false negative. Taking binary classification task as an example, the structure of the confusion matrix is shown in Table 4. In addition, confusion matrix and ROC curve play a crucial role in further verifying experimental results.
3.2 The deep feature visualization of network model
The purpose of visualizing the deep features of a network model is to help us understand how the neural network discriminates between different object categories, and to gain some insight into what the neural network relies on to recognize objects [34]. In this paper, the Gradient-weighted Class Activation Mapping (Grad-CAM) method is used to observe the image features extracted by Swin Transformer, and to understand which local regions of the original image led the model to make its final classification decision [35]. Using the gradient of any target concept, a rough localization map is generated to highlight the important regions of the image used for prediction. Figure 6 shows examples of Grad-CAM generated from four cherry categories. The brightness of the generated image varies with changes in the visual features of the image [36]. From the figure, we can see that the network is able to recognize the ripeness and decay of the cherries based on their fruit features.

FIGURE 6. Grad-CAM visualization of Swin Transformer. (A) Broken; (B) Immature; (C) Mature; (D) Over-mature.
3.3 The performance of Swin transformer and different classifiers
Swin Transformer is used as a feature extractor to extract the deep features of cherries, and then the features are imported into the classifier to predict the category labels of cherries. Different classifiers have different learning abilities for pre-trained features. In this work, nine classifiers such as random forest (RF) [37], decision tree (DT) [38], extremely randomized trees (ET) [39], quadratic discriminant analysis (QDA) [40], gaussian naive bayes (GNB) [41], SVM [42], linear discriminant analysis (LDA) [43], extreme gradient boosting (XGB) [44], and K nearest neighbor (KNN) [45] are compared with the MLP classifier proposed in this paper.
3.3.1 Analyze the accuracy and training time of different combinations
Figure 7 shows the comparison of accuracy and training time for ten classifiers combined with Swin Transformer. From Figure 7A, it is evident that the accuracy of QDA and GNB classifiers is much lower than the original Swin-T training results, indicating poor classification performance. In contrast, SVM, XGB, and MLP classifiers have higher accuracy than Swin-T, with improvements of 0.2%, 0.3%, and 2.1%, respectively. Through experiments, the training time of Swin-T was found to be 551.24s, and Figure 7B shows that the average training time of the method combining deep features with specific classifiers is much shorter than that of Swin-T. The training times for SVM, XGB, and MLP are 78.021, 83.853, and 78.774 s, respectively. XGB’s longer training time is due to its need to traverse the dataset during node splitting. Through a comprehensive analysis of accuracy and training time, MLP performs the best.
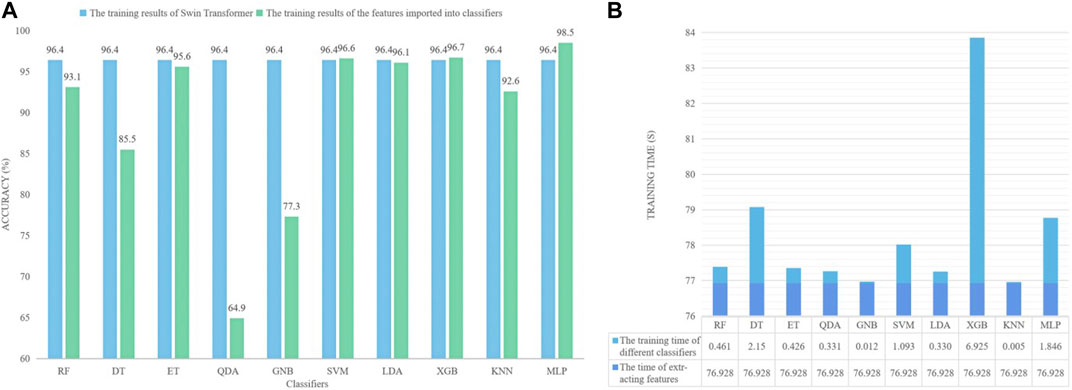
FIGURE 7. (A) The accuracy of different combinations (B) The training time of different combinations.
3.3.2 Analyze the assessment indicators of different combinations
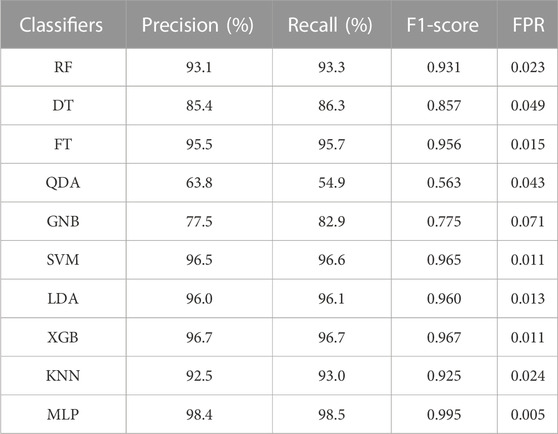
The ten classifiers were compared based on precision, recall, F1-score, and FPR. As shown in Table 5, it can be observed that the QDA and GNB classifiers’ results were not satisfactory, as their precision and recall values were much lower than the other classifiers, and GNB had the highest FPR value. A high FPR value indicates a high false positive rate of the model. SVM and XGB classifiers had very similar precision, recall, and F1-score values, with a difference of only 0.002, 0.001, and 0.002, respectively, which achieved ideal performance. Compared to SVM and XGB, the MLP classifier had higher precision and recall values, reaching 98.4% and 98.5%, respectively, and an F1-score exceeding 0.99. In addition, the MLP classifier had the lowest FPR value among all classifiers, which was 0.005.
3.4 The best performance of Swin transformer and MLP
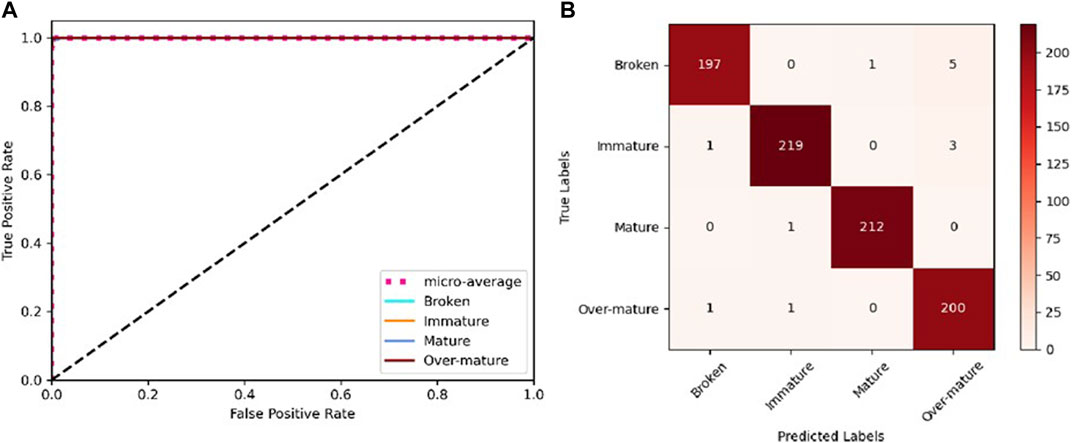
The results demonstrate that the method proposed in this paper, which combines Swin-T with MLP, achieves the best recognition performance, with an accuracy of 98.5%, precision of 98.4%, recall of 98.5%, F1-score of 0.995, and FPR of 0.005. The high recognition accuracy of the method proposed in this paper is attributed to the strong adaptability and self-learning capabilities of MLP. In addition, the ROC curve of Swin transformer and MLP is shown in Figure 8A, where the area under the curve (AUC) is used as a metric for evaluating the recognition performance. The larger the AUC value, the better the recognition performance. As shown in Figure 8A, the AUC values of the four categories and the micro-average are almost equal to 1. To further evaluate the performance of this method, the confusion matrix is shown in Figure 8B, which intuitively demonstrates the performance of the model for each category. The performance for each category is represented by the predicted labels on the horizontal axis and the true labels on the vertical axis. The results indicate that the precision for broken, immature, mature, and over-mature are 97.5%, 98.2%, 99.5%, and 98.5%, respectively. The category with the most misclassification is broken, which was mistakenly identified as over-mature. This is possibly because some cherries only exhibit slight rotting, which is characterized by a darkening of the surface color, and is therefore easily mistaken as over-mature. Figure 8B clearly shows that the recognition performance for mature cherries is the best, which is attributed to the distinct bright red color of mature cherries. Therefore, the method proposed in this paper exhibits excellent recognition performance.
3.5 Proposed method versus other models
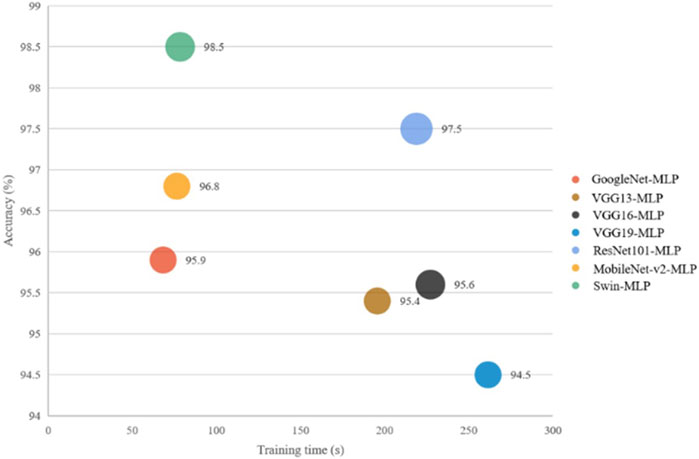
The proposed method in this paper utilizes Swin-T to extract different category features of cherry images and inputs these features into a multilayer perceptron (MLP) to predict the final labels. At the same time, six CNN models including GoogleNet [46], VGG13, VGG16, VGG19 [47], ResNet101 [48], and MobileNet_v2 [49] are used to recognize the appearance quality of cherries, and the features extracted from these CNN models are imported into the MLP classifier. The CNN plus MLP method, traditional CNN method, and the proposed Swin transformer and MLP method are compared in terms of accuracy and training time, as shown in Table 6. The results show that the features plus MLP classifier method has a higher average recognition accuracy than the traditional CNN method, especially the Swin transformer and MLP method achieves the best accuracy of 98.5%. For the proposed method, the training time should be the time for the model to extract features plus the training time for the classifier. Table 6 clearly shows that the training time of the features plus MLP method is much less than that of the traditional CNN models, and the training time of the Swin transformer and MLP method is only 78.43 s.
To further explain the objective evaluation between accuracy and training time, a scatter plot is presented in Figure 9, where the x-axis and y-axis represent training time and accuracy, respectively, and the x-axis values represent the computational resources of the models. We can see from the experiments that the VGG13-MLP, VGG16-MLP, and VGG19-MLP methods have low accuracy and long training time, and the ResNet101-MLP method has a higher accuracy but a long training time. Therefore, the results demonstrate that the method proposed in this paper has high accuracy and less training time, and it has good application value in the recognition of cherry ripeness and decay.
4 Discussion
4.1 The advantage of deep features plus MLP
The article proposes two advantages of the method: 1) high accuracy in recognizing cherry appearance, 2) short training time. Swin-T with MLP has an accuracy 2.1% higher than original Swin-T, indicating strong robustness. In addition, the training time for Swin-T is 551.24 s, while the method of deep feature extraction with MLP has a training time of only 78.43 s. The training time for Swin-T is approximately seven times that of Swin transformer and MLP, and the training time for deep feature extraction with MLP is shorter because the network only needs to extract features from cherry images and does not need to continuously optimize the internal parameters of the model. Therefore, the computational complexity of the proposed method is much lower than that of Swin-T, and the required computing power is not large.
4.2 Potential impact and future work
In recent years, the area of cherry cultivation has been expanding year by year, and the yield has been steadily increasing. However, cherry sorting has always been one of the most troublesome problems for growers. Currently, manual sorting during the cherry ripening season is still common, but this method is expensive, inefficient, and difficult to ensure the quality of the fruit, which leads to significant quality problems in marketing. Therefore, the development of automatic sorting equipment is particularly important. According to the different ripening stages of cherries, the appearance color of cherries is divided into three levels. In general, to ensure that cherries have a high hardness and crisp texture even after several days of packaging and transportation, they should be harvested and sorted before they turn deep red, which is the ripening stage represented in this paper. This ensures that consumers can purchase high-quality products. In the cherry sorting process, it is not enough to classify the appearance ripeness and decay into four categories. In order to better sort cherries of different qualities, it is necessary to further study and add categories such as semi-ripe and diseases. At the same time, it is very important to accurately identify rotten or damaged cherries during the sorting process. The Swin-T with MLP method proposed in this paper has high classification accuracy in the identification of cherry ripeness and decay. This experiment is also applicable to other cherry varieties such as Lapins, Kordia, Skeena, etc.
5 Conclusion
This paper proposes a cherry appearance ripeness and decay recognition method based on deep feature extraction combined with an MLP classifier. The method performs well in cherry detection. In the experimental stage, the features extracted from Swin-T were imported into ten classifiers for comparison, and the best performing classifier was the MLP classifier. In addition, the method proposed in this paper, which extracts image features from Swin-T and imports them into MLP, was compared with the method that extracts features from traditional CNN and imports them into MLP. The recognition accuracy of Swin transformer and MLP was as high as 98.5%, and the training time was only 78.43 s, which is an impressive result. Therefore, the proposed method has important practical value. In addition, this method has reference significance for the identification of other types of cherries. If one wishes to identify other cherry varieties, it suffices to substitute the dataset. Furthermore, it is imperative to emphasize that the improved method presented in this article remains applicable in such a scenario, owing to its versatility and robustness, enabling it to accommodate the distinct characteristics of various cherry varieties. Thus, it furnishes a flexible and viable solution to the problem of cherry cultivar recognition. The focus of future research is to apply this method to sorting equipment and other mechanical devices to promote the development of future intelligent sorting methods.
Data availability statement
The original contributions presented in the study are included in the article/Supplementary Material, further inquiries can be directed to the corresponding author.
Author contributions
KS: Conceptualization, Formal Analysis, Investigation, Methodology, Resources, Supervision, Validation, Visualization, Writing–original draft, Writing–review and editing. JY: Data curation, Software, Validation, Writing–original draft. GW: Data curation, Funding acquisition, Investigation, Software, Writing–original draft, Writing–review and editing.
Funding
The author(s) declare financial support was received for the research, authorship, and/or publication of this article. The work is partly supported by the Scientific Research Program Funded by Education Department of Shaanxi Provincial Government (Program No. 22JY025).
Conflict of interest
The authors declare that the research was conducted in the absence of any commercial or financial relationships that could be construed as a potential conflict of interest.
Publisher’s note
All claims expressed in this article are solely those of the authors and do not necessarily represent those of their affiliated organizations, or those of the publisher, the editors and the reviewers. Any product that may be evaluated in this article, or claim that may be made by its manufacturer, is not guaranteed or endorsed by the publisher.
References
1. Acero N, Gradillas A, Beltran M, García A, Mingarro DM. Comparison of phenolic compounds profile and antioxidant properties of different sweet cherry (Prunus avium L.) varieties. Food Chem (2019) 279:260–71. doi:10.1016/j.foodchem.2018.12.008
2. Jahanbakhshi A, Kheiralipour K. Carrot sorting based on shape using image processing, artificial neural network and support vector machine. J Agric Machinery (2019) 9:295–307. doi:10.22067/jam.v9i2.70579
3. Dasari SK, Prasad V. A novel and proposed comprehensive methodology using deep convolutional neural networks for flue cured tobacco leaves classification. Int J Inf Tech (2019) 11:107–17. doi:10.1007/s41870-018-0174-4
4. Xu S, Zhang L, Tang Y, Han C, Wu H, Song A. Channel attention for sensor-based activity recognition: embedding features into all frequencies in DCT domain. IEEE Trans Knowledge Data Eng (2023) 1–15. doi:10.1109/tkde.2023.3277839
5. Ge Y, Zhu F, Chen D, Zhao R, Wang X, Li H. Structured domain adaptation with online relation regularization for unsupervised person Re-id. IEEE Trans Neural Networks Learn Syst (2022) 1–14. doi:10.1109/tnnls.2022.3173489
6. Huang W, Zhang L, Wang S, Wu H, Song A. Deep ensemble learning for human activity recognition using wearable sensors via filter activation. ACM Trans Embed Comput Syst (2022) 22(1):1–23. doi:10.1145/3551486
7. Tang Y, Zhang L, Teng Q, Min F, Song A. Triple cross-domain attention on human activity recognition using wearable sensors. IEEE Trans Emerging Top Comput Intelligence (2022) 6(5):1167–76. doi:10.1109/tetci.2021.3136642
8. Azarmdel H, Mohtasebi SS, Jafari A, Muñoz AR. Developing an orientation and cutting point determination algorithm for a trout fish processing system using machine vision. Comput Electro Agric (2019) 162:613–29. doi:10.1016/j.compag.2019.05.005
9. Yang J, Wang G. Identifying cherry maturity and disease using different fusions of deep features and classifiers. J Food Meas Characterization (2023). doi:10.1007/s11694-023-02091-4
10. Wang G, Zheng H, Li X. ResNeXt-SVM: a novel strawberry appearance quality identification method based on ResNeXt network and support vector machine. J Food Meas Characterization (2023) 17:4345–56. doi:10.1007/s11694-023-01959-9
11. Wang G, Zheng H, Zhang X. A robust checkerboard corner detection method for camera calibration based on improved YOLOX. Front Phys (2022) 828. doi:10.3389/fphy.2021.819019
12. ElMasry G, Cubero S, Moltó E, Blasco J. In-line sorting of irregular potatoes by using automated computer-based machine vision system. J Food Eng (2012) 112(1-2):60–8. doi:10.1016/j.jfoodeng.2012.03.027
13. Femling F, Olsson A, Alonso-Fernandez F. Fruit and vegetable identification using machine learning for retail applications. In: Proceedings of the 2018 14th International Conference on Signal-Image Technology & Internet-Based Systems (SITIS); November 2018; Las Palmas de Gran Canaria, Spain. IEEE (2018). p. 9–15. doi:10.1109/SITIS.2018.00013
14. Sambasivam GAOGD, Opiyo GD. A predictive machine learning application in agriculture: cassava disease detection and classification with imbalanced dataset using convolutional neural networks. Egypt Inform J (2021) 22(1):27–34. doi:10.1016/j.eij.2020.02.007
15. Bao W, Yang X, Liang D, Hu G, Yang X. Lightweight convolutional neural network model for field wheat ear disease identification. Comput Electro Agric (2021) 189:106367. doi:10.1016/j.compag.2021.106367
16. Gao Z, Shao Y, Xuan G, Wang Y, Liu Y, Han X. Real-time hyperspectral imaging for the in-field estimation of strawberry ripeness with deep learning. Artif Intelligence Agric (2020) 4:31–8. doi:10.1016/j.aiia.2020.04.003
17. Dong C, Zhang Z, Yue J, Zhou L. Automatic recognition of strawberry diseases and pests using convolutional neural network. Smart Agric Tech (2021) 1:100009. doi:10.1016/j.atech.2021.100009
18. Kheiralipour K, Pormah A. Introducing new shape features for classification of cucumber fruit based on image processing technique and artificial neural networks. J Food process Eng (2017) 40(6):e12558. doi:10.1111/jfpe.12558
19. Li H, Sui M, Zhao F, Zha Z, Wu F. MVT: mask vision transformer for facial expression recognition in the wild (2021). Available at: https://arxiv.org/abs/2106.04520.
20. Zhou D, Kang B, Jin X, Yang L, Lian X, Jiang Z, et al. Deepvit: towards deeper vision transformer (2021). Available at: https://arxiv.org/abs/2103.11886.
21. Huang CW, Chen YN. Adapting pretrained transformer to lattices for spoken language understanding. In: Proceedings of the 2019 IEEE Automatic Speech Recognition and Understanding Workshop (ASRU); November-2019; Singapore. IEEE (2019). p. 845–52. doi:10.1109/ASRU46091.2019.9003825
22. Brostow GJ, Fauqueur J, Cipolla R. Semantic object classes in video: a high-definition ground truth database. Pattern Recognition Lett (2009) 30(2):88–97. doi:10.1016/j.patrec.2008.04.005
23. Carion N, Massa F, Synnaeve G, Usunier N, Kirillov A, Zagoruyko S. End-to-end object detection with transformers. In: Proceedings of the Computer Vision–ECCV 2020: 16th European Conference; August 2020; Glasgow, UK. Springer International Publishing (2020). p. 213–29. doi:10.1007/978-3-030-58452-8_13
24. Brown T, Mann B, Ryder N, Subbiah M, Kaplan JD, Dhariwal P, et al. Language models are few-shot learners. Adv Neural Inf Process Syst (2020) 33:1877–901.
25. Arnab A, Dehghani M, Heigold G, Sun C, Lučić M, Schmid C. Vivit: a video vision transformer. In: Proceedings of the IEEE/CVF international conference on computer vision; October 2021; Montreal, QC, Canada (2021). p. 6836–46.
26. Dosovitskiy A, Beyer L, Kolesnikov A, Weissenborn D, Zhai X, Unterthiner T, et al. An image is worth 16x16 words: transformers for image recognition at scale (2020). Available at: https://arxiv.org/abs/2010.11929.
27. Zheng H, Wang G, Li X. Swin-MLP: a strawberry appearance quality identification method by Swin Transformer and multi-layer perceptron. J Food Meas Characterization (2022) 16(4):2789–800. doi:10.1007/s11694-022-01396-0
28. Liu Z, Lin Y, Cao Y, Hu H, Wei Y, Zhang Z, et al. Swin transformer: hierarchical vision transformer using shifted windows. In: Proceedings of the IEEE/CVF international conference on computer vision; October 2021; Montreal, QC, Canada (2021). p. 10012–22.
29. Zheng H, Wang G, Li X. Identifying strawberry appearance quality by vision transformers and support vector machine. J Food Process Eng (2022) 45(10):e14132. doi:10.1111/jfpe.14132
30. Jahanbakhshi A, Abbaspour-Gilandeh Y, Ghamari B, Heidarbeigi K. Assessment of physical, mechanical, and hydrodynamic properties in reducing postharvest losses of cantaloupe (Cucumis melo var. Cantaloupensis). J Food Process Eng (2019) 42(5):e13091. doi:10.1111/jfpe.13091
31. Cao H, Wang Y, Chen J, Jiang D, Zhang X, Tian Q, et al. Swin-unet: unet-like pure transformer for medical image segmentation. In: Proceedings of the European Conference on Computer Vision; October 2022; Tel Aviv, Israel. Springer Nature Switzerland (2022). p. 205–18. doi:10.1007/978-3-031-25066-8_9
32. Takahashi A, Koda Y, Ito K, Aoki T. Fingerprint feature extraction by combining texture, minutiae, and frequency spectrum using multi-task CNN. In: Proceedings of the 2020 IEEE International Joint Conference on Biometrics (IJCB); September 2020; Houston, TX, USA. IEEE (2020). p. 1–8. doi:10.1109/IJCB48548.2020.9304861
33. Zhu H, Yang L, Fei J, Zhao L, Han Z. Recognition of carrot appearance quality based on deep feature and support vector machine. Comput Electro Agric (2021) 186:106185. doi:10.1016/j.compag.2021.106185
34. Ni J, Gao J, Deng L, Han Z. Monitoring the change process of banana freshness by GoogLeNet. IEEE Access (2020) 8:228369–76. doi:10.1109/access.2020.3045394
35. Selvaraju RR, Cogswell M, Das A, Vedantam R, Parikh D, Batra D. Grad-cam: visual explanations from deep networks via gradient-based localization. In: Proceedings of the IEEE international conference on computer vision; October 2017; Venice, Italy (2017). p. 618–26.
36. Li X, Cai C, Zheng H, Zhu H. Recognizing strawberry appearance quality using different combinations of deep feature and classifiers. J Food Process Eng (2022) 45(3):e13982. doi:10.1111/jfpe.13982
37. Pal M. Random forest classifier for remote sensing classification. Int J remote sensing (2005) 26(1):217–22. doi:10.1080/01431160412331269698
38. Qin B, Xia Y, Li F. DTU: a decision tree for uncertain data. In: Proceedings of the Advances in Knowledge Discovery and Data Mining: 13th Pacific-Asia Conference, PAKDD 2009 Bangkok; April 2009; Thailand. Springer Berlin Heidelberg (2009). p. 4–15. doi:10.1007/978-3-642-01307-2_4
39. Perez A, Larranaga P, Inza I. Supervised classification with conditional Gaussian networks: increasing the structure complexity from naive Bayes. Int J Approximate Reasoning (2006) 43(1):1–25. doi:10.1016/j.ijar.2006.01.002
40. Bose S, Pal A, SahaRay R, Nayak J. Generalized quadratic discriminant analysis. Pattern Recognition (2015) 48(8):2676–84. doi:10.1016/j.patcog.2015.02.016
41. Jahromi AH, Taheri M. A non-parametric mixture of Gaussian naive Bayes classifiers based on local independent features. In: Proceedings of the 2017 Artificial intelligence and signal processing conference (AISP); October 2017; Shiraz, Iran. IEEE (2017). p. 209–12. doi:10.1109/AISP.2017.8324083
42. Noble WS. What is a support vector machine? Nat Biotechnol (2006) 24(12):1565–7. doi:10.1038/nbt1206-1565
43. Xanthopoulos P, Pardalos PM, Trafalis TB, Xanthopoulos P, Pardalos PM, Trafalis TB. Linear discriminant analysis. Robust data mining (2013) 27–33. doi:10.1007/978-1-4419-9878-1_4
44. Chen T, Guestrin C. XGBoost. Proceedings of the 22nd ACM SIGKDD international conference on knowledge discovery and data mining. San Francisco, California, USA: Association for Computing Machinery (2016). p. 785–94.
45. Guo G, Wang H, Bell D, Bi Y, Greer K. KNN model-based approach in classification. In: Proceedings of the On The Move to Meaningful Internet Systems 2003: CoopIS, DOA, and ODBASE: OTM Confederated International Conferences, CoopIS, DOA, and ODBASE 2003; November 2003; Catania, Sicily, Italy. Springer Berlin Heidelberg (2003). p. 986–96. doi:10.1007/978-3-540-39964-3_62
46. Szegedy C, Liu W, Jia Y, Sermanet P, Reed S, Anguelov D, et al. Going deeper with convolutions. In: Proceedings of the IEEE conference on computer vision and pattern recognition; June 2015; Boston, MA, USA (2015). p. 1–9.
47. Simonyan K, Zisserman A. Very deep convolutional networks for large-scale image recognition (2014). Availab;e at: https://arxiv.org/abs/1409.1556.
48. He K, Zhang X, Ren S, Sun J. Deep residual learning for image recognition. In: Proceedings of the IEEE conference on computer vision and pattern recognition; June 2016; Las Vegas, NV, USA (2016). p. 770–8.
Keywords: cherry ripeness and decay, CNN, deep features, Swin transformer, muti-layer perceptron
Citation: Song K, Yang J and Wang G (2023) A Swin transformer and MLP based method for identifying cherry ripeness and decay. Front. Phys. 11:1278898. doi: 10.3389/fphy.2023.1278898
Received: 17 August 2023; Accepted: 09 October 2023;
Published: 20 October 2023.
Edited by:
Wenjun Liu, Beijing University of Posts and Telecommunications (BUPT), ChinaCopyright © 2023 Song, Yang and Wang. This is an open-access article distributed under the terms of the Creative Commons Attribution License (CC BY). The use, distribution or reproduction in other forums is permitted, provided the original author(s) and the copyright owner(s) are credited and that the original publication in this journal is cited, in accordance with accepted academic practice. No use, distribution or reproduction is permitted which does not comply with these terms.
*Correspondence: Guohui Wang, Ym9vbGVyQDEyNi5jb20=
 Ke Song1
 Guohui Wang
