- 1School of Information and Electrical Engineering, Shandong Jianzhu University, Jinan, China
- 2SHI Changxu Advanced Material Innovation Center, Chinese Academy of Sciences, Shenyang, China
Introduction: Metal corrosion detection is important for protecting lives and property. X-ray inspection systems are widely used because of their good penetrability and visual presentation capability. They can visually display both external and internal corrosion defects. However, existing X-ray-based defect detection methods cannot present and estimate the dense corrosion depths. To solve this problem, we propose a dense metal corrosion depth estimation method based on image segmentation and inpainting.
Methods: The proposed method employs an image segmentation module to segment metal corrosion defects and an image inpainting module to remove these segmented defects. It then calculates the pixel-level dense corrosion depths using the X-ray images before and after inpainting. Moreover, to address the difficulty of acquiring training images with ground-truth dense corrosion depth annotations, we propose a virtual data generation method for creating virtual corroded metal X-ray images and their corresponding ground-truth annotations.
Results: Experiments on both virtual and real datasets show that the proposed method successfully achieves accurate dense metal corrosion depth estimation.
Discussion: In conclusion, the proposed virtual data generation method can provide effective and sufficient training samples, and the proposed dense metal corrosion depth estimation framework can produce accurate dense corrosion depths.
1 Introduction
Metal objects are common and important in daily life. However, contact with air and water often cause unavoidable corrosion during the service life of metal components. Corrosion significantly reduces the strength of metal materials, shortening their service life and even posing serious safety hazards. Therefore, timely and accurate metal corrosion detection can effectively protect lives and property.
At present, many defect detection methods have been proposed, using RGB [1] or RGB-D images [2, 3], eddy currents [4], and ultrasound [5]. However, these methods either cannot detect internal corrosion defects or cannot visually display them. In contrast, X-ray inspection systems have the visual presentation capability to display both external and internal structures. Therefore, X-ray inspection systems are often used to detect metal defects including corrosion. Existing automatic defect detection methods using X-ray images fall into three categories: classification-based, target detection-based, and segmentation-based methods.
1) Classification-based methods generally use and improve classic classification networks [6–9] such as Inception [10] and VGG [11]. For example, Zhang et al. [9] trained Inception and MobileNet [12] by transfer learning and combined these two networks through a multi-module ensemble framework to classify weld defects. Hu et al. [6] proposed an object-level attention mechanism and used this mechanism to train a VGG16-based type classification module and a defect classification module to classify casting defects. Jiang et al. [8] improved VGG16 by employing attention-guided data augmentation to train the casting defect classification network with effective data augmentation. Tang et al. [7] improved VGG16 by employing a spatial attention mechanism and bilinear pooling to classify casting defects. As shown in Figure 1A, classification methods only output an image-level classification result to determine whether there is a defect in the image.
2) Target detection-based methods generally use and improve popular object detection networks such as Faster RCNN [13]. For example, Gong et al. [14] improved domain adaptive Faster RCNN (DA Faster) [13] by adding a feature pyramid network (FPN) [15], small anchor strategies, ROI Align, and other strategies to detect defects in spacecraft composite structures. Liu et al. [16] improved Faster RCNN by employing a residual network combined with FPN and an efficient convolutional attention module to detect weld defects. Cheng et al. [17] improved DS-Cascade RCNN [18] by adding a spatial attention mechanism, deformable convolution and pruning algorithms to detect wheel hub defects. As shown in Figure 1B, these target detection methods can roughly locate the position of defects using bounding-boxes.
3) Segmentation-based methods generally use segmentation networks with encoder–decoder structures, such as U-Net [19]. Du et al. [20] improved U-Net to segment defects in casting parts by changing its backbone to ResNet 101 [21], adding a contrast-limited adaptive histogram equalization module, a gated multi-layer fusion module, and a weighted intersection over union (IOU) loss function. Yang et al. [22] improved U-Net by adding a multi-scale feature fusion block and a bidirectional convolutional Long Short-Term Memory block to segment welding defects. Du et al. [23] built an interactive X-ray network (IXNet) with a click attention module based on U-Net to perform interactive segmentation of casting defects. As shown in Figure 1C, the segmentation results of these methods contain detailed defect location, area, and shape information.
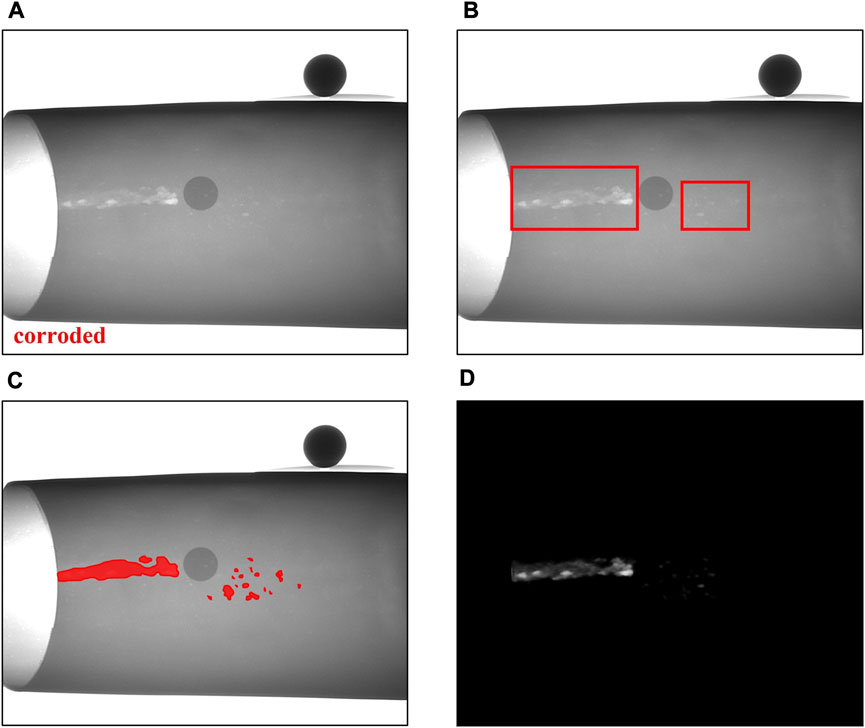
FIGURE 1. Comparison of results of different kinds of defect detection methods (A) classification-based method (B) target detection-based method (C) segmentation-based method; and (D) the proposed dense metal corrosion depth estimation method.
Of all these methods, segmentation-based approaches provide the most detailed defect information. Despite this, even these methods cannot estimate the depth of defects, which is a crucial parameter for metal corrosion analysis. Currently, software developed by NOVO DR Ltd. Is able to estimate the depth of defects through the Double Wall Technique (DWT) [24]. The major drawback of DWT is its strongly reliance on manual operation, making it unusable for automatic depth estimation.
To address these limitations, we propose a new defect detection method that detects corrosion defects based on dense metal corrosion depth estimation. The proposed method is capable of automatically estimating the corrosion depth maps that contain dense corrosion depth information. An example of estimated corrosion depth map from our method is shown in Figure 1D, with the value of each pixel denoting its corresponding corrosion depth. The estimated corrosion depth map not only contains dense corrosion depth information but also includes detailed information regarding the location, area, and shape of corrosion defects.
The proposed method is composed of three modules for corrosion segmentation, corrosion inpainting, and dense corrosion depth calculation. The corrosion segmentation module is based on the state-of-the-art real-time instance segmentation method YOLOv8 [25]. The corrosion inpainting module is based on the state-of-the-art image inpainting method LAMA [26]. The corrosion depth calculation module is based on the Beer–Lambert law [27]. Both the corrosion segmentation and the corrosion inpainting modules are based on deep learning neural networks, which require a large number of training images with ground-truth annotations. However, annotating corrosion defects in X-ray images not only requires significant manpower and time but also extensive expertise. This implies that only adequately trained researchers possess the ability to annotate corrosion defects in X-ray images. As a result, it is very hard to annotate sufficient X-ray images for training. To address this issue, we propose a novel virtual data generation method. This method can generate virtual corroded metal X-ray images and their corresponding ground-truth annotations automatically without any manual intervention.
The main contributions of this paper are as follows.
1) We propose a novel dense metal corrosion depth estimation framework to address the problem that previous technologies cannot automatically estimate dense corrosion depths. This proposed framework uses a corrosion segmentation module (CSM) to segment corrosion defects and a corrosion inpainting module (CIM) to remove these segmented corrosion defects. Then, a dense corrosion depth calculation module (DCDCM) is employed to calculate the pixel-level dense corrosion depths using the X-ray images before and after inpainting.
2) We propose a novel virtual data generation method to address the issue that it is difficult to manually annotate dense corrosion depths in X-ray images. This proposed method contains a virtual corrosion cell generation module (VCCGM) to generate virtual corrosion cells, and a virtual corrosion image generation module (VCIGM) to generate virtual corroded metal X-ray images and their corresponding ground-truth dense corrosion depth annotations. With the help of this method, sufficient virtual images and their ground-truth annotations are generated for training and testing.
3) We perform sufficient experiments on both virtual and real datasets to prove the effectiveness of the proposed virtual data generation method and dense metal corrosion depth estimation framework. The experimental results show that the proposed framework trained by the generated virtual dataset successfully produces accurate dense metal corrosion depths.
2 Dense metal corrosion depth estimation
2.1 Overview
The process flow of our dense metal corrosion depth estimation framework is shown in Figure 2. The framework is composed of three modules: the corrosion segmentation module (CSM), the corrosion inpainting module (CIM), and the dense corrosion depth calculation module (DCDCM). An incoming X-ray image with corrosion defects is first given to CSM. CSM outputs its corresponding corrosion segmentation result. CIM then removes the corrosion defects according to the original X-ray image and its corresponding corrosion segmentation result. Finally, DCDCM calculates the corrosion depth of each pixel according to the X-ray images before and after inpainting. These modules are described in detail in the following sections.
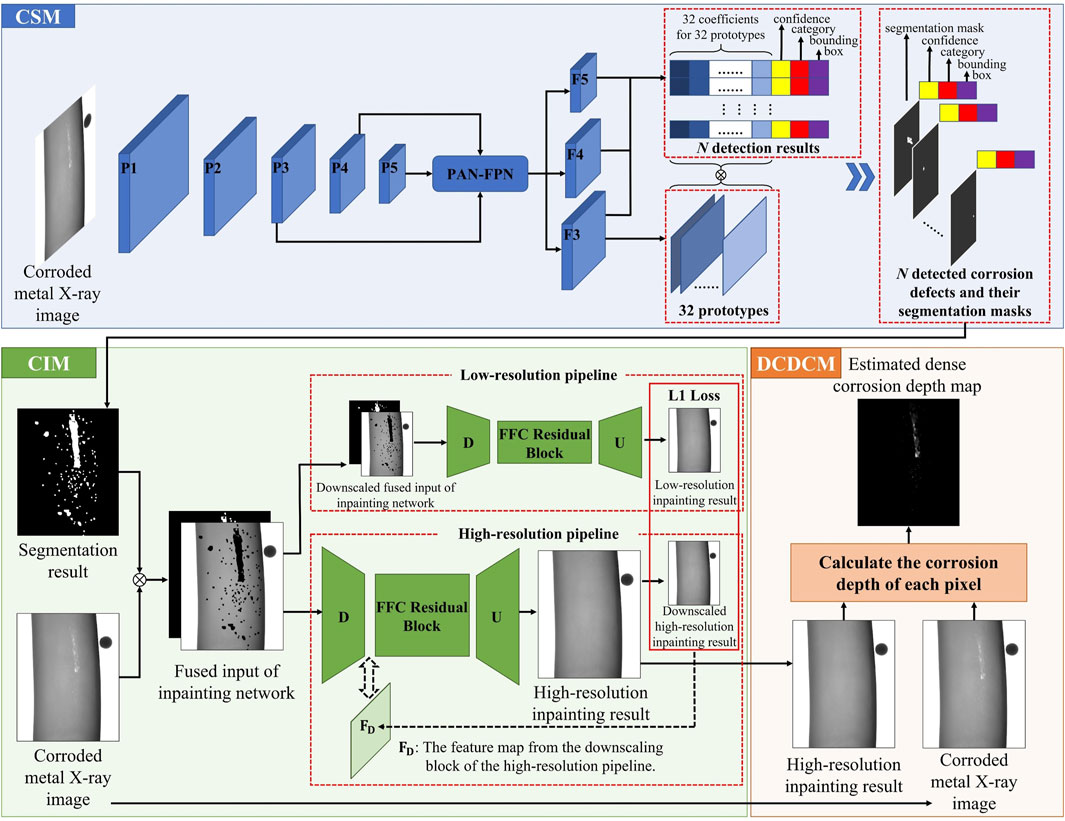
FIGURE 2. The flow chart of our proposed dense metal corrosion depth estimation framework. CSM denotes the corrosion segmentation module. CIM denotes the corrosion inpainting module. DCDCM denotes the dense corrosion depth calculation module.
2.2 Corrosion segmentation module
In the field of computer vision, YOLO plays an important role. It stands out from a large number of methods for its remarkable balance of speed and accuracy [28]. The first version of YOLO was proposed in 2015 [29]. Through the efforts of many researchers, the eighth version of YOLO, YOLOv8, was proposed in early 2023 [25]. YOLOv8 achieves state-of-the-art performance in real-time object detection and instance segmentation. Therefore, we use YOLOv8 in our corrosion segmentation module (CSM).
The simplified network architecture of YOLOv8 is shown within the CSM in Figure 2. As shown, five convolutional blocks are first employed to extract high-level features. After passing through each convolutional block, the height and width of feature map are reduced. In Figure 2, these feature maps produced by the different convolutional blocks are denoted as
We design the CSM module to segment corrosion defects from X-ray images of corroded metal materials. As shown in Figure 2, the outputs of the neural network consist of two parts:
(1)
(2)
(3) The primary segmentation mask
A set of corrosion segmentation results are shown in Figure 2. Each detected corrosion defect contains its bounding box coordinates, classification value, confidence value, and segmentation mask.
During training of the CSM, binarized virtual corrosion depth maps and the bounding boxes of disconnected corrosion areas are used as the ground truth of the instance segmentation results. Further details on the generation of virtual corroded X-ray images and their corresponding ground-truth depth maps are presented in Section 3.
2.3 Corrosion inpainting module
In the proposed dense corrosion depth estimation framework, we use a corrosion inpainting module to remove corrosion defects. This module employs the state-of-the-art image inpainting method LAMA [26]. LAMA builds its inpainting network using fast Fourier convolutions (FFCs) to obtain an image-wide receptive field and improve inpainting performance.
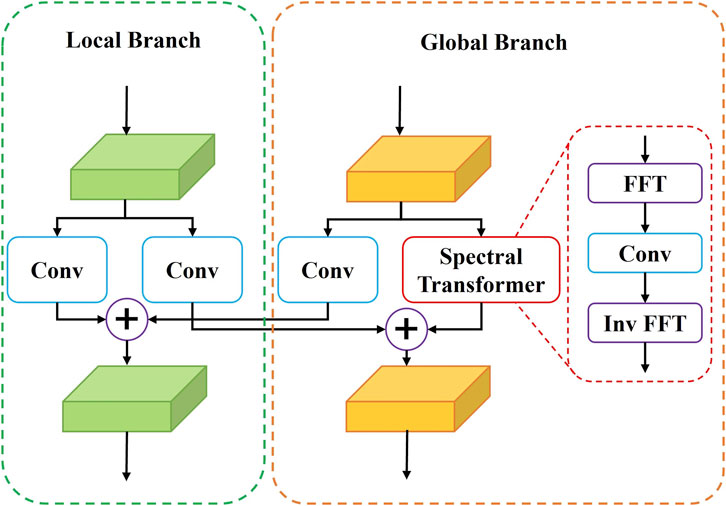
The architecture of FFC is shown in Figure 3. FFC contains two parallel branches: a local branch and a global branch [31]. The local branch uses conventional convolutions to extract local features. The global branch uses a spectral transformer to extract global features. The spectral transformer first transforms image features into a spectral domain by fast Fourier transform (FFT), then conducts an efficient global update in the spectral domain, and finally converts features back to the spatial domain via inverse fast Fourier transform (Inv FFT). A point-wise update in the spectral domain globally affects all spatial features [31]. Therefore, the spectral transformer can extract global features. The above local features and global features are then combined to fuse multi-scale features. A large effective receptive field plays a crucial role in the inpainting task [26]. However, conventional convolutions cannot provide a large effective receptive field, especially in the early layers of the network. In contrast, FFC can provide an image-level receptive field in very early layers of the network [26]. Therefore, FFC effectively improves the inpainting performance.
The simplified network architecture of LAMA is shown within the CIM in Figure 2. In our project, the resolution of the processed images is large, so we use an architecture containing low-resolution and high-resolution pipelines. These two pipelines use the same network (i.e., having the same architecture and weights) to process inputs in different resolutions. As shown in Figure 2, the inpainting network contains three blocks: a downscaling block (labeled D in Figure 2), an FFC residual block, and an upscaling block (labeled U in Figure 2). The downscaling block contains 3 FFCs with strides set to 2. The FFC residual block contains 18 sub-residual blocks built on FFCs with strides set to 1. The upscaling block uses 3 transpose convolutions with strides set to 2. The inpainting results produced by the inpainting network have the same size as the inputs as a result.
In the inpainting architecture, the two pipelines play different roles. As shown in Figure 2, the low-resolution pipeline uses the downscaled inputs for inpainting. Smaller inputs are beneficial to generate inpainting results with better global structures [32]. However, many image details can be lost during the down-sampling operation. In contrast, the high-resolution pipeline uses the original inputs for inpainting. No image details are lost in its inputting step. However, larger inputs cause incoherent structures [32]. To maintain image details while generating inpainting results with better global structures, the inpaining results of the low-resolution pipeline are used to supervise the global structures of the inpainting results of the high-resolution pipeline. The supervision process is operated by minimizing the L1 loss between the downscaled high-resolution inpainting results and the low-resolution inpainting results. Note that the L1 loss is minimized by updating the feature map from the downscaling block of the high-resolution pipeline
The binary mask used for inpainting is provided by the CSM, as shown in Figure 2. It covers all detected corrosion defects. The original X-ray image, as shown in Figure 2, is masked using this binary mask. This masked X-ray image is then stacked with the binary mask to generate a fused input. The inpainting network finally outputs the inpainting result with the same scale as the original X-ray image, as shown in Figure 2. A comparison of the images in Figure 2 before and after inpainting shows that the corrosion defects have been removed.
When training CIM, the actual X-ray images without corrosion that used to combine virtual corrosion depth maps are used as the ground truth of image inpainting results. Further details on the generation of virtual corroded X-ray images and their corresponding ground-truth depth maps are presented in Section 3.
2.4 Dense corrosion depth calculation module
In X-ray images, the gray value of each pixel is exponentially related to the corresponding thickness of the transilluminated material as given by:
where
Eq. 2 can be rewritten as:
As
According to Eq. 4, the corrosion depth can be calculated as:
Therefore, when the values of
From Eq. 6, we obtain a pixel-level dense corrosion depth map
3 Virtual data generation
As described above, the proposed dense corrosion depth estimation framework contains two deep learning-based modules: CSM and CIM, both of which need a large number of annotated images for training. However, it is quite difficult to annotate the corrosion defects in real X-ray images. We propose the virtual data generation method in this section to solve this problem. This method automatically generates virtual corroded metal X-ray images and their corresponding virtual corrosion depth maps for the purpose of acquiring sufficient and various annotated training X-ray images automatically.
A flowchart of the proposed virtual data generation method is shown in Figure 4A. A set of images in the key steps of our proposed method are shown in Figures 4(B)–(I). This method consists of two modules: the virtual corrosion cell generation module (VCCGM) and the virtual corrosion image generation module (VCIGM). VCCGM and VCIGM cooperate to generate the virtual corrosion image and the corresponding corrosion depth map. Specifically, VCCGM provides virtual corrosion cells for VCIGM; VCIGM randomly combines these virtual corrosion cells to generate virtual corrosion depth maps and combines the virtual corrosion depth maps with real metal X-ray images without corrosion to generate virtual corroded metal X-ray images.
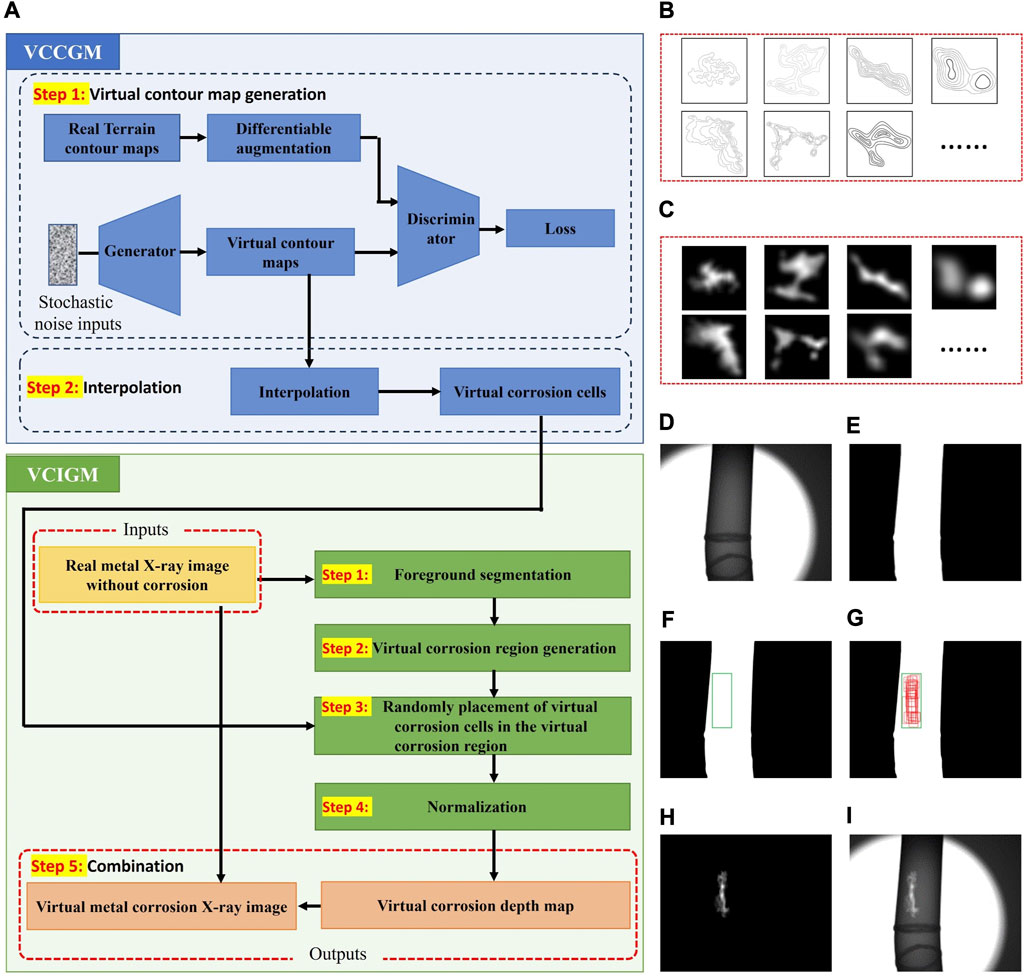
FIGURE 4. The components of the virtual data generation method and examples (A) the flowchart of the VCCGM (virtual corrosion cell generation module) and the VCIGM (virtual corrosion image generation module) (B) examples of virtual contour maps (C) examples of virtual corrosion cells (D) a real metal X-ray image without corrosion (E) the foreground segmentation result (F) the generated virtual corrosion region (G) the randomly selected regions that used to place virtual corrosion cells (H) the generated virtual corrosion depth map; and (I) the generated virtual corroded metal X-ray image.
In the following subsections, we first introduce the working principle of the virtual data generation method in detail, and then we introduce VCCGM and VCIGM in detail.
3.1 Principle of virtual data generation
As shown in Eq. 4, when the gray value without corrosion
In this paper, we treat
Therefore, the main mission of the proposed virtual data generation method is to generate a reasonable virtual dense corrosion depth map
In the field of image processing, a generative adversarial network (GAN) is commonly used for generating virtual images. However, a GAN needs a large number of real data samples for training, and it is difficult to acquire real dense corrosion depth maps. Therefore, it is difficult to train a GAN that can generate virtual dense corrosion depth maps.
Through the observation of many corroded metal X-ray images, we find that the brightness fluctuations in the corrosion areas of X-ray images are similar to the topographic fluctuations. Thus, one solution to the above problem is to borrow the concept of contour maps from geography and use terrain contour maps downloaded from the internet as real data samples to train a GAN that can generate virtual contour maps. Then, virtual depth maps can be obtained by interpolating these virtual contour maps. However, the above solution has two problems: 1) it is difficult to download sufficient complex terrain contour maps to simulate complex corrosions, and 2) it is difficult to interpolate complex contour maps.
To solve the above two problems, we only use a GAN to generate virtual corrosion cells by VCCGM, and then we randomly combine different virtual corrosion cells to generate virtual corrosion depth maps by VCIGM. Although it is difficult to download sufficient complex terrain contour maps, it is much easier to download simple terrain contour maps with one or two peaks. We use these simple terrain contour maps downloaded from the internet as real data samples to train a GAN that can generate simple virtual contour maps. Virtual corrosion cells can be generated by interpolating these simple virtual contour maps. By randomly combining different virtual corrosion cells, we can generate a large number of various virtual corrosion depth maps.
3.2 Virtual corrosion cell generation module
The virtual corrosion cell generation module is designed to generate a series of virtual corrosion cells as shown in the examples in Figure 4C. Virtual corrosion cells are sub-depth maps with simple structures and fixed scale.
In order to generate sufficient virtual corrosion cells with a variety of structures, we create the virtual corrosion cell generation module (VCCGM) using a generative adversarial network (GAN). GAN is a common method used for data augmentation. A simplified GAN structure is shown in the VCCGM of Figure 4A. GAN has two main blocks: a generator block and a discriminator block. During training, the two blocks play against each other and finally generate virtual data samples which are indistinguishable from real ones.
Even though GAN is able to generate a large number of high-quality virtual data samples, it also needs a large number of real data samples for training. However, it is very difficult to obtain a sufficient number of real corrosion cells. To solve this problem, we borrow the concept of contour maps from geography and use some terrain contour maps downloaded from the Internet as real data samples.
The processing steps of VCCGM are as follows.
Step 1. Virtual contour map generation. The GAN, which is trained by terrain contour maps, generates virtual contour maps, with examples shown in Figure 4B.
Step 2. Interpolation. The generated virtual contour maps are interpolated to generate virtual corrosion cells as shown in Figure 4C.
3.3 Virtual corrosion image generation module
The virtual corrosion image generation module generates virtual corrosion depth maps by combining the virtual corrosion cells provided by the VCCGM and generates virtual corroded metal X-ray images by combining the generated virtual corrosion depth maps with real X-ray images without corrosion. The flow chart of this module has been shown in the VCIGM in Figure 4A. To ensure that the generated virtual corrosion defects locate at the foreground areas, the X-ray images without corrosion that used to combine virtual corrosion depth maps also participate in generating virtual corrosion depth maps. The steps of how to use virtual corrosion cells to generate virtual corrosion depth maps and how to generate virtual corroded metal X-ray images are as follows.
Step 1. Foreground segmentation. An actual X-ray image without corrosion, as shown in Figures 4D, is sent into the foreground segmentation step. The foreground segmentation part, built using YOLOv8, produces the segmentation result shown in Figure 4E;
Step 2. Virtual corrosion region generation. This step randomly generates a bounding box in the segmented foreground area. The green bounding box in the white foreground area shown in Figure 4F is an example. Virtual corrosion will be put in this bounding box;
Step 3. Random placement of virtual corrosion cells in the virtual corrosion region. A cluster of sub-boxes are randomly generated in the virtual corrosion region. These sub-boxes have been marked in red in Figure 4G. They have different sizes and different aspect ratios. Each sub-box selects a virtual corrosion cell generated by VCCGM and resizes the selected virtual corrosion cell to fill itself. If overlap occurs, the overlapping parts are added together. After this step, a preliminary virtual corrosion depth map is obtained;
Step 4. Normalization. This step normalizes the preliminary virtual corrosion depth map into a reasonable value range. The upper bound of corrosion depth equals the thickness of inspected metal material. The lower bound of corrosion depth is 0. The max value of depth map
Step 5. Combination. This step combines the generated virtual corrosion depth map shown in Figure 4H and the actual X-ray image without corrosion shown in Figure 4D according to Eq. 8. The result is a virtual corroded metal X-ray image, as shown in Figure 4I.
4 Experiments
In this paper, we have presented our framework for estimating the dense metal corrosion depth using X-ray images. In view of the previously described difficulties in obtaining actual corroded metal X-ray images with ground-truth annotations, we have also presented a method for generating virtual corrosion images for the purposes of training our method. In our experiments, we used 16,199, 4,200, and 2,170 virtual images for training, validation, and testing, respectively. To verify that the model trained on virtual datasets is also suitable for real datasets, we also tested our proposed model on several real cases. All our experiments were implemented using PyTorch with two NVidia RTX 3090 GPUs and one Intel Xeon Gold 5222 CPU.
4.1 Experiments on virtual dataset
As described in Section 2, our framework has three modules: a corrosion segmentation module (CSM), a corrosion inpainting module (CIM), and a dense corrosion depth calculation module (DCDCM). CSM and CIM use the YOLOv8 real-time instance segmentation model and the LAMA inpainting model, respectively. To verify their effectiveness, we also performed experiments with other models. We employed mean absolute error (MAE) and mean square error (MSE) to evaluate the corrosion depth estimation performance. The formulas of MAE and MSE are:
where
To compare different instance segmentation models in more aspects, we also show
As shown in Table 2, we tested three inpainting models (AOT [32], PUT [36], and LAMA) on the proposed framework. LAMA provided the best performance, with a large performance gap compared to the others, because the inpainting performance of LAMA is significantly higher than that of the other two methods. To qualitatively compare the inpainting performance of AOT, PUT, and LAMA, we show a group of their inpainting results in Figure 5.
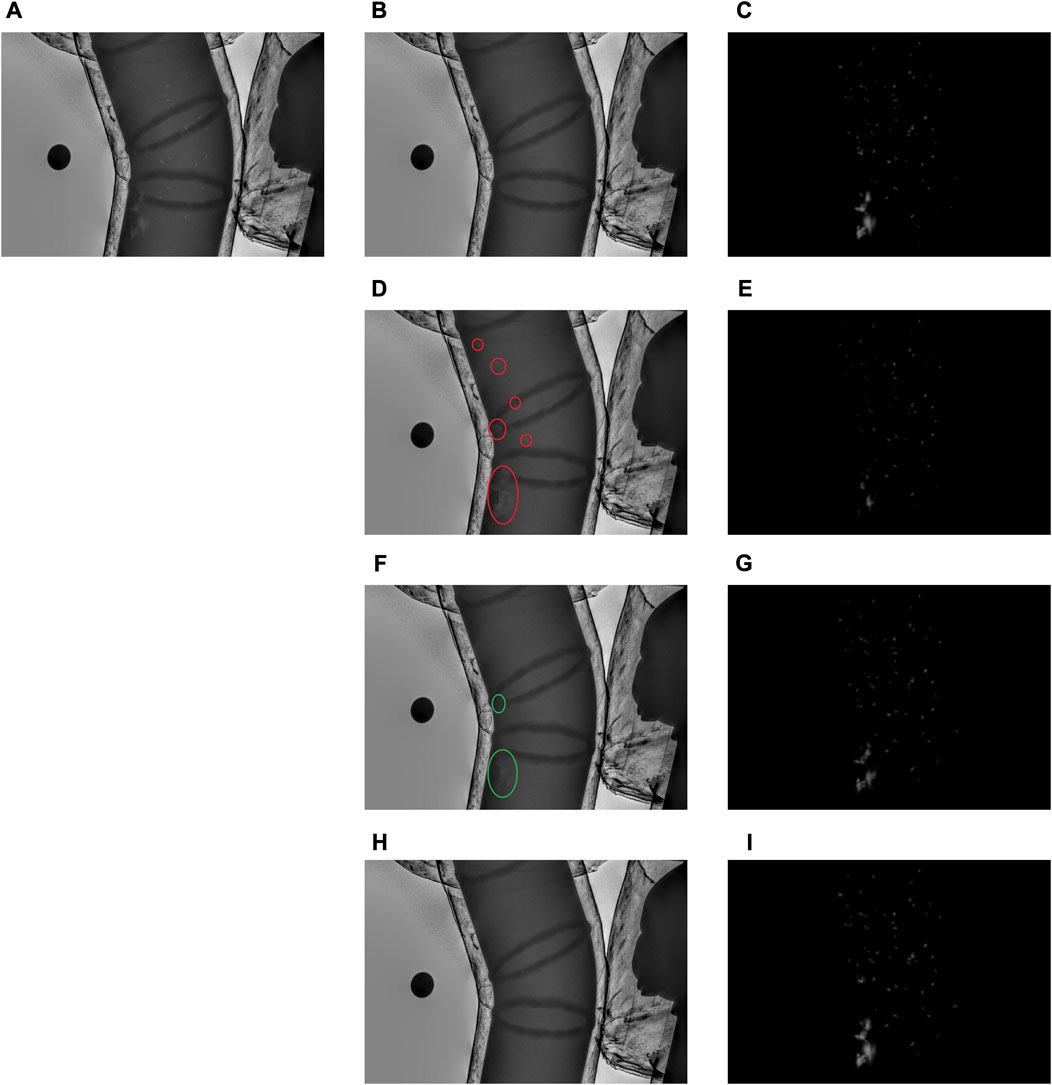
FIGURE 5. The inpainting and depth map estimation results of different frameworks (A) virtual corroded metal X-ray image (B) the ground-truth inpainting result (C) the ground-truth depth map (D) the inpainting result of AOT (E) the estimated depth map of the framework with AOT (F) the inpainting result of PUT (G) the estimated depth map of the framework with PUT (H) the inpainting result of LAMA; and (I) the estimated depth map of the framework with LAMA.
As shown in Figure 5, the corrosion regions are still readily visible (indicating reduced inpainting performance) in the inpainting result of AOT as indicated by the red circles. PUT was better, but in the regions marked with green circles, the differences between corroded and normal areas are still visible. In the inpainting results of LAMA, it is quite difficult to distinguish corrosion regions from normal regions. As LAMA provides the best inpainting results, the corrosion depths calculated from its inpainting results are more accurate. The predicted corrosion depth maps of the proposed frameworks with AOT, PUT, and LAMA are also shown in Figure 5. The predicted corrosion depth map when using LAMA is closest to the ground-truth depth map.
Figure 6 shows more examples of corrosion depth estimation with virtual cases. CSM accurately segmented most corrosion defects; CIM successfully removed the segmented corrosion defects; and DCDCM estimated accurate and reasonable depth maps that are fairly close to the ground-truth depth maps.
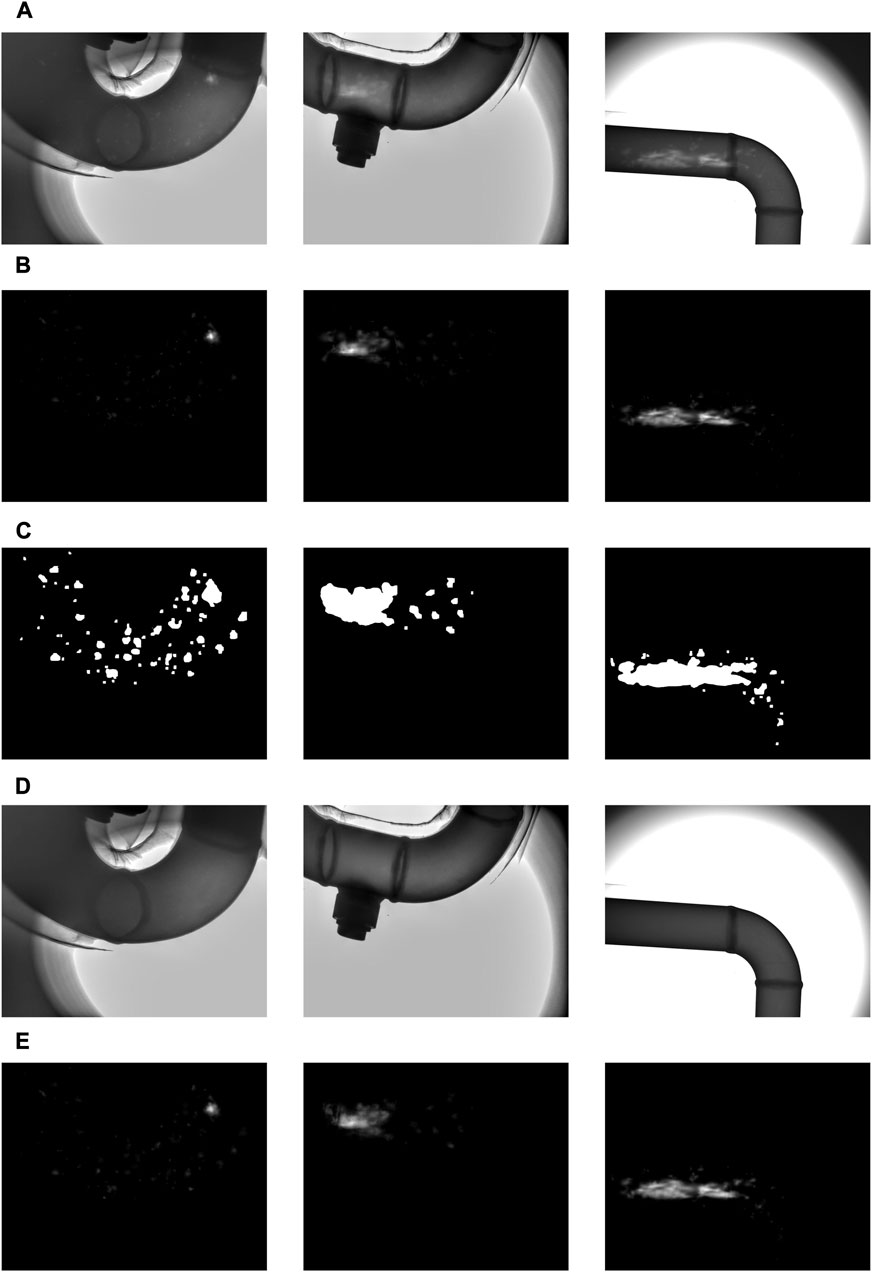
FIGURE 6. Examples of dense metal corrosion depth estimation on virtual images (A) the virtual corroded metal X-ray image (B) the ground-truth depth maps (C) the corrosion defect segmentation results of CSM (using YOLOv8) (D) the corrosion defect inpainting results of CIM (using LAMA); and (E) the estimated corrosion depth map.
4.2 Experiments on real dataset
It is extremely difficult to quantitatively evaluate the dense metal corrosion depth estimation performance on real corroded metal X-ray images because it is hard to obtain their ground-truth corrosion depth maps. In this section, we used a metal pipe with six holes of known depths to quantitatively evaluate the depth estimation accuracy of our proposed framework, and collected several real corroded metal X-ray images to qualitatively evaluate the dense metal corrosion depth estimation performance of our proposed framework.
4.2.1 Quantitative experiment
As noted, we used a metal pipe with six holes of known depths. The wall thickness of this pipe was 3 mm. The raw and annotated X-ray images are shown in Figure 7. The depth estimation results of our framework and DWT are shown in Table 3. DWT is the defect depth estimation method used in NOVO DR systems [24].
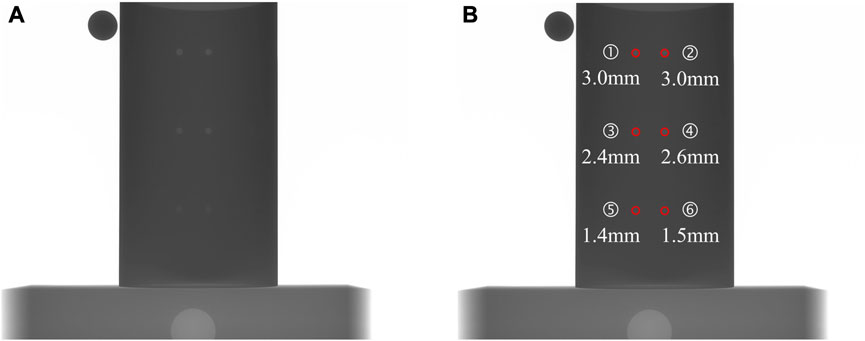
FIGURE 7. X-ray images of the test metal pipe (A) raw image of the metal pipe with six holes of known depths; and (B) annotated image with the position and depth of each hole.

TABLE 3. The depth estimation results of the proposed framework and DWT using a real X-ray image of a metal pipe with six holes of known depths.
As shown in Table 3, the depth estimation absolute errors of our framework are comparable with DWT, indicating similar accuracy. DWT, however, requires human–computer interaction, while our framework is fully automatic. Therefore, our framework is more convenient to use.
4.2.2 Qualitative experiment
In this experiment, we collected some real X-ray images of corroded metal pipes. Because we could not obtain their ground-truth corrosion depth maps, we could not quantitatively evaluate the dense corrosion depth estimation performance using MAE and MSE. However, we can still qualitatively analyze the performance of our proposed framework by checking whether the estimated corrosion depth maps are reasonable. Three group of examples are shown in Figure 8.
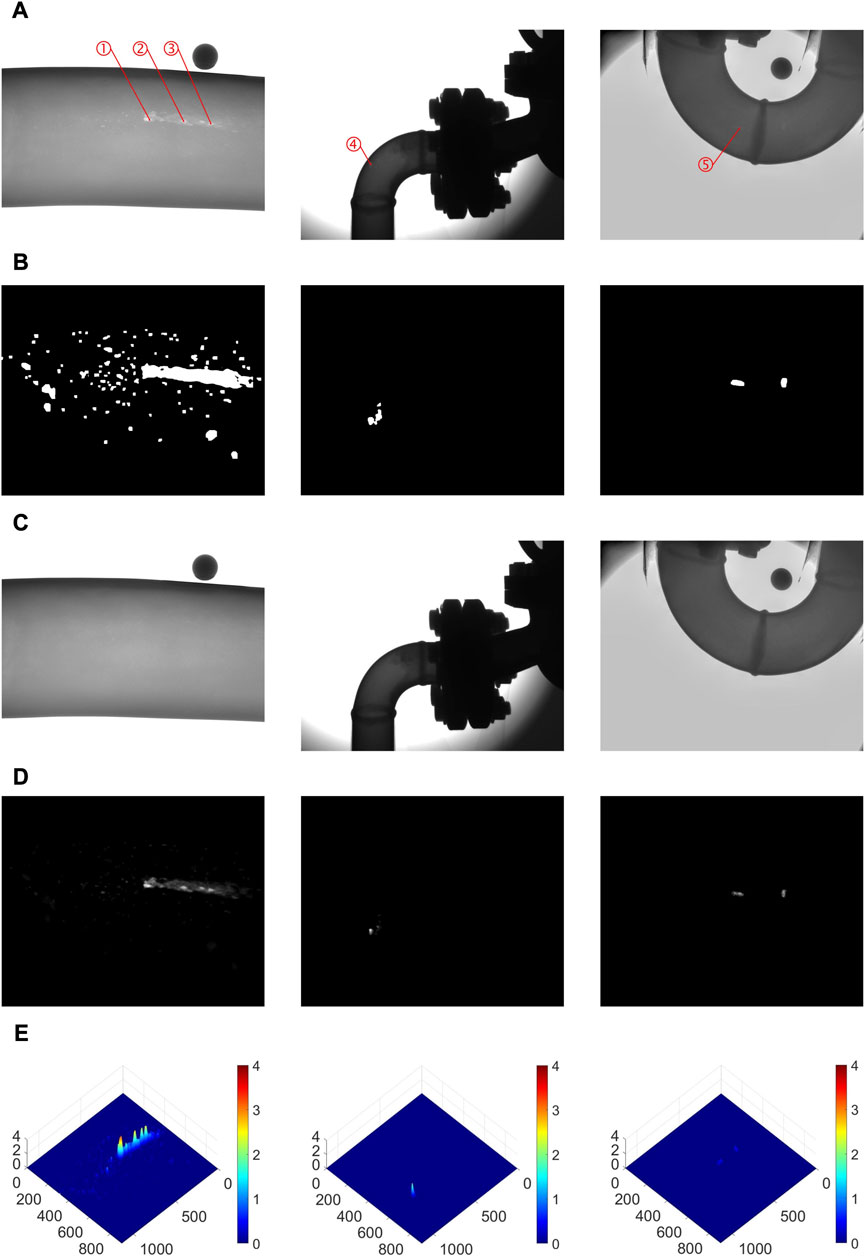
FIGURE 8. Examples of dense metal corrosion depth estimation with real images (A) the real corroded metal X-ray image (B) the corrosion defect segmentation results from CSM (using YOLOv8) (C) the corrosion defect inpainting results from CIM (using LAMA) (D) the estimated corrosion depth maps (to make the corrosion defects more significant, each corrosion depth map has been divided by its maximum depth); and (E) the estimated corrosion depth map shown in 3D.
As shown in Figure 8, CSM successfully segmented the corrosion defects; CIM successfully removed these corrosion defects, obtaining accurate inpainting results; and DCDCM successfully estimated the dense corrosion depth maps according to the original corroded metal X-ray images and their corresponding inpainting results. In order to present the estimated corrosion depth maps more vividly, they are shown in 3D in the last row of Figure 8. As shown in Figure 8A, the three cases had different degrees of corrosion: in the first case, the corrosion defects were large, dense, and deep; in the second case, the corrosion defects were much smaller; in the third case, the corrosion defects were very shallow. The estimated corrosion depth maps shown in Figure 8E are consistent with these observations.
Even though we could not obtain the ground truth of corrosion depths, we still compared the depth estimation results of our framework with DWT at five different points, labeled as ➀, ➁, ➂, ➃, and ➄ in Figure 8. The depth estimation results of these five points are shown in Table 4. DWT is widely used in the NOVO DR systems [24]. Although it is not perfect (as shown in Table 3, the depth estimation results of DWT are not exactly equal to the ground-truth values), widespread experience shows that DWT is a reliable defect depth estimation method. As shown in Table 4, the depth estimation results of our framework are close to the depth estimation results of DWT, demonstrating that the depth values in our estimated dense corrosion depth maps are reasonable.
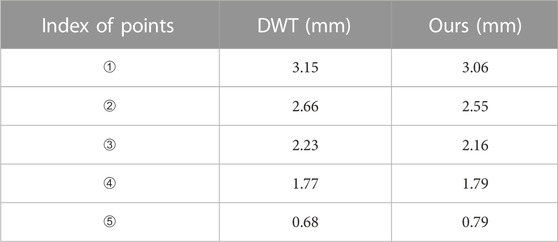
TABLE 4. Corrosion depth estimation results for our framework and DWT using real corroded metal X-ray images.
5 Conclusion
In this paper, we propose a novel dense metal corrosion depth estimation framework for X-ray images. It consists of three modules: a corrosion segmentation module (CSM), a corrosion inpainting module (CIM), and a dense corrosion depth calculation module (DCDCM). CSM segments corrosion defects from the X-ray images. CIM removes these segmented corrosion defects. DCDCM calculates the corrosion depth maps, which contain dense corrosion depth information, according to the original X-ray images and the inpainting results of CIM. To solve the problem of lacking training dataset with ground-truth of annotations, we propose a virtual data generation method to generate virtual corroded metal X-ray images and their corresponding ground-truth corrosion depth annotations. The virtual data generation method consists of two modules: a virtual corrosion cell generation module (VCCGM) and a virtual corrosion image generation module (VCIGM). VCCGM generates virtual corrosion cells using a generative adversarial network. VCIGM generates virtual corrosion depth maps by combining the virtual corrosion cells and produces virtual corroded metal X-ray images by combining the generated virtual corrosion depth maps with actual X-ray images without corrosion. We use these generated images to train both CSM and CIM. Experimental results show that the proposed dense metal corrosion depth estimation framework trained using the generated virtual dataset could successfully estimate accurate and dense metal corrosion depth automatically.
Data availability statement
The raw data supporting the conclusion of this article will be made available by the authors, without undue reservation.
Author contributions
YL: Formal Analysis, Methodology, Software, Writing–original draft. HL: Formal Analysis, Methodology, Writing–original draft, Software. YG: Formal Analysis, Writing–review and editing. XnZ: Formal Analysis, Writing–review and editing. XaZ: Formal Analysis, Writing–review and editing, Funding acquisition, Methodology, Project administration, Software, Writing–original draft.
Funding
The author(s) declare financial support was received for the research, authorship, and/or publication of this article. This work was supported by the Natural Science Foundation of Shandong Province (ZR2021QF094) and the Youth Innovation Team Technology Project of Higher School in Shandong Province (2022KJ204).
Conflict of interest
The authors declare that the research was conducted in the absence of any commercial or financial relationships that could be construed as a potential conflict of interest.
Publisher’s note
All claims expressed in this article are solely those of the authors and do not necessarily represent those of their affiliated organizations, or those of the publisher, the editors and the reviewers. Any product that may be evaluated in this article, or claim that may be made by its manufacturer, is not guaranteed or endorsed by the publisher.
References
1. Wu J, Zhou W, Qiu W, Yu L. Depth repeated-enhancement rgb network for rail surface defect inspection. IEEE Signal Process. Lett (2022) 29:2053–7. doi:10.1109/LSP.2022.3211199
2. Wang J, Song K, Zhang D, Niu M, Yan Y. Collaborative learning attention network based on rgb image and depth image for surface defect inspection of no-service rail. IEEE/ASME Trans Mechatronics (2022) 27(6):4874–84. doi:10.1109/TMECH.2022.3167412
3. Zhou W, Hong J. Feet: Lightweight feature hierarchical exploration network for real-time rail surface defect inspection in rgb-d images. IEEE Trans Instrumentation Meas (2023) 72:1–8. doi:10.1109/TIM.2023.3237830
4. Farag H E, Toyserkani E, Khamesee MB. Non-destructive testing using eddy current sensors for defect detection in additively manufactured titanium and stainless-steel parts. Sensors (2022) 22(14):5440. doi:10.3390/s22145440
5. Yu Y, Safari A, Niu X, Drinkwater B, Horoshenkov KV. Acoustic and ultrasonic techniques for defect detection and condition monitoring in water and sewerage pipes: A review. Appl Acoust (2021) 183:108282. doi:10.1016/j.apacoust.2021.108282
6. Hu C, Wang Y. An efficient convolutional neural network model based on object-level attention mechanism for casting defect detection on radiography images. IEEE Trans Ind Electron (2020) 67(12):10922–30. doi:10.1109/TIE.2019.2962437
7. Tang Z, Tian E, Wang Y, Wang L, Yang T. Nondestructive defect detection in castings by using spatial attention bilinear convolutional neural network. IEEE Trans Ind Inform (2021) 17(1):82–9. doi:10.1109/TII.2020.2985159
8. Jiang L, Wang Y, Tang Z, Miao Y, Chen S. Casting defect detection in x-ray images using convolutional neural networks and attention-guided data augmentation. Measurement (2021) 170:108736. doi:10.1016/j.measurement.2020.108736
9. Zhang H, Chen Z, Zhang C, Xi J, Le X. Weld defect detection based on deep learning method. In: Proceedings of the IEEE International Conference on Automation Science and Engineering; August 2019; Vancouver, BC, Canada (2019). p. 1574–9. doi:10.1109/COASE.2019.8842998
10. Szegedy C, Ioffe S, Vanhoucke V, Alemi A. Inception-v4, inception-resnet and the impact of residual connections on learning. Proc AAAI Conf Artif Intelligence (2017) 31(1):4278–84. doi:10.1609/aaai.v31i1.11231
11. Simonyan K, Zisserman A. Very deep convolutional networks for large-scale image recognition (2014). Avaialble at: https://arxiv.org/abs/1409.1556. doi:10.48550/arXiv.1409.1556
12. Howard AG, Zhu M, Chen B, Kalenichenko D, Wang W, Weyand T, et al. Mobilenets: Efficient convolutional neural networks for mobile vision applications (2017). Avaialble at: https://arxiv.org/abs/1704.04861. doi:10.48550/arXiv.1704.04861
13. Ren S, He K, Girshick R, SunFaster JR-CNN. Faster R-CNN: Towards real-time object detection with region proposal networks. IEEE Trans Pattern Anal Machine Intelligence (2017) 39(6):1137–49. doi:10.1109/TPAMI.2016.2577031
14. Gong Y, Luo J, Shao H, Li Z. A transfer learning object detection model for defects detection in x-ray images of spacecraft composite structures. Compos Structures (2022) 284:115136. doi:10.1016/j.compstruct.2021.115136
15. Lin T-Y, Dollár P, Girshick R, He K, Hariharan B, Belongie S. Feature pyramid networks for object detection. In: Proceedings of the IEEE Conference on Computer Vision and Pattern Recognition; July 2017; Honolulu, HI, USA (2017). p. 936–44. doi:10.1109/CVPR.2017.106
16. Liu W, Shan S, Chen H, Wang R, Sun J, Zhou Z. X-ray weld defect detection based on AF-RCNN. Welding In The World (2022) 66(6):1165–77. doi:10.1007/s40194-022-01281-w
17. Cheng S, Lu J, Yang M, Zhang S, Xu Y, Zhang D, et al. Wheel hub defect detection based on the DS-Cascade RCNN. Measurement (2023) 206:112208. doi:10.1016/j.measurement.2022.112208
18. Cai Z, Vasconcelos N, Cascade R-CNN. Delving into high quality object detection. In: Proceedings of the IEEE Conference on Computer Vision and Pattern Recognition; June 2018; Salt Lake City, UT, USA (2018). p. 6154–62. doi:10.1109/CVPR.2018.00644
19. Ronneberger O, Fischer P, Brox T. U-Net: Convolutional networks for biomedical image segmentation. In: Proceedings of the Medical Image Computing and Computer-Assisted Intervention–MICCAI 2015: 18th International Conference; Proceedings, Part III 18. 2015; October, 2015; Munich, Germany. Springer (2015). p. 234–41. doi:10.1007/978-3-319-24574-4_28
20. Du W, Shen H, Fu J. Automatic defect segmentation in x-ray images based on deep learning. IEEE Trans Ind Electron (2021) 68(12):12912–20. doi:10.1109/TIE.2020.3047060
21. He K, Zhang X, Ren S, Sun J. Deep residual learning for image recognition. In: Proceedings of the IEEE Conference on Computer Vision and Pattern Recognition; June 2016; Las Vegas, NV, USA (2016). p. 770–8. doi:10.1109/CVPR.2016.90
22. Yang L, Song S, Fan J, Huo B, Li E, Liu Y. An automatic deep segmentation network for pixel-level welding defect detection. IEEE Trans Instrumentation Meas (2022) 71:1–10. doi:10.1109/TIM.2021.3127645
23. Du W, Shen H, Zhang G, Yao X, Fu J. Interactive defect segmentation in x-ray images based on deep learning. Expert Syst Appl (2022) 198:116692. doi:10.1016/j.eswa.2022.116692
25. Jocher G, Chaurasia A, Qiu J. Yolo by ultralytics (2023). Avaialble at: https://github.com/ultralytics/ultralytics.
26. Suvorov R, Logacheva E, Mashikhin A, Remizova A, Ashukha A, Silvestrov A, et al. Resolution-robust large mask inpainting with fourier convolutions. In: Proceedings of the IEEE/CVF Winter Conference on Applications of Computer Vision; January 2022; Waikoloa, HI, USA (2022). p. 3172–82. doi:10.1109/WACV51458.2022.00323
28. Jiang P, Ergu D, Liu F, Cai Y, Ma B. A review of yolo algorithm developments. Proced Comput Sci (2022) 199:1066–73. doi:10.1016/j.procs.2022.01.135
29. Redmon J, Divvala S, Girshick R, Farhadi A. You only look once: Unified, real-time object detection. In: Proceedings of the IEEE Conference on Computer Vision and Pattern Recognition; June 2016; Las Vegas, NV, USA (2016). p. 779–88. doi:10.1109/CVPR.2016.91
30. Bolya D, Zhou C, Xiao F, Lee YJ. Yolact++ better real-time instance segmentation. IEEE Trans Pattern Anal Machine Intelligence (2022) 44(2):1108–21. doi:10.1109/TPAMI.2020.3014297
31. Chi L, Jiang B, Mu Y. Fast fourier convolution. In: Proceedings of advances in neural information processing systems (2020). Cambridge: MIT Press, p. 4479–88.
32. Zeng Y, Fu J, Chao H, Guo B. Aggregated contextual transformations for high-resolution image inpainting. IEEE Trans Visualization Comput Graphics (2023) 29(7):3266–80. doi:10.1109/TVCG.2022.3156949
33. Garcia-Garcia A, Orts-Escolano S, Oprea S, Villena-Martinez V, Garcia-Rodriguez J. A review on deep learning techniques applied to semantic segmentation (2017). Avaialble at: https://arxiv.org/abs/1704.06857. doi:10.48550/arXiv.1704.06857
34. Jocher G. Yolov5 by ultralytics (2020). Avaialble at: https://github.com/ultralytics/yolov5.
35. Wang C-Y, Bochkovskiy A, Liao H-YM. Yolov7: Trainable bag-of-freebies sets new state-of-the-art for real-time object detectors. In: Proceedings of the IEEE/CVF Conference on Computer Vision and Pattern Recognition; June 2022; New Orleans, LA, USA (2022). p. 7464–75. doi:10.48550/arXiv.2207.02696
36. Liu Q, Tan Z, Chen D, Chu Q, Dai X, Chen Y, et al. Reduce information loss in transformers for pluralistic image inpainting. In: Proceedings of the IEEE/CVF Conference on Computer Vision and Pattern Recognition; June 2022; New Orleans, LA, USA (2022). p. 11337–47. doi:10.1109/CVPR52688.2022.01106
Keywords: corrosion depth estimation, image segmentation, image inpainting, virtual training data generation, x-ray image
Citation: Li Y, Li H, Guan Y, Zhang X and Zhao X (2023) Dense metal corrosion depth estimation. Front. Phys. 11:1277710. doi: 10.3389/fphy.2023.1277710
Received: 15 August 2023; Accepted: 11 September 2023;
Published: 22 September 2023.
Edited by:
Zhiqin Zhu, Chongqing University of Posts and Telecommunications, ChinaReviewed by:
Guanqiu Qi, Buffalo State College, United StatesHuafeng Li, Kunming University of Science and Technology, China
Copyright © 2023 Li, Li, Guan, Zhang and Zhao. This is an open-access article distributed under the terms of the Creative Commons Attribution License (CC BY). The use, distribution or reproduction in other forums is permitted, provided the original author(s) and the copyright owner(s) are credited and that the original publication in this journal is cited, in accordance with accepted academic practice. No use, distribution or reproduction is permitted which does not comply with these terms.
*Correspondence: Xiaomei Zhao, emhhb3hpYW9tZWkyMEBzZGp6dS5lZHUuY24=
 Yanping Li1
 Honggang Li
 Xinyu Zhang
 Xiaomei Zhao