- 1Institute for Quantum Science and Technology, College of Science, National University of Defense Technology, Changsha, China
- 2Hunan Key Laboratory of Mechanism and Technology of Quantum Information, Changsha, China
Ghost imaging (GI) reveals its exceptional superiority over conventional cameras in a range of challenging scenarios such as weak illumination or special waveband. For high-performance GI, it is vital to obtain a sequence of high-fidelity bucket signals. However, measurements may suffer from distortion or loss in harsh environments. Here we present multiple description coding ghost imaging, which rests on illumination consisting of different coding patterns to address this challenge. Experimental results indicate that the proposed method is capable of producing satisfactory image even when the sequence of bucket signals is incomplete or highly distorted. This method provides an encouraging boost for GI in practical applications.
1 Introduction
The challenge of achieving high-performance imaging in complex environments remains persistent since signals are easily distorted or even lost [1, 2]. For example, photons from adjacent lidars or reflectors on the road can flood the detectors in automotive vehicles, which blinds the sensor for frames [3]. In the case of infrared imaging, flashes from noise sources and background other than the target may fully flood the detector, leading to failure of imaging [4]. Benefitting from the utilization of only one single high-sensitive photodetector, and deploying designed illumination for imaging [5, 6], GI manifests its unique strength beyond the traditional imaging methods in such situations [7, 8]. Several methods have been proposed for achieving GI in complex environments where signals are vulnerable to distortion or loss [9–13]. By distinguishing signals on different dimensions, such as polarization [14], spectrum [15], frequency of modulation [16, 17], GI is capable of effectively suppressing the influence of noise with distinct characteristics. Nevertheless, the utility of the above properties requires enough prior information on noise, which is difficult to achieve in diverse complex environments [18]. In addition, a class of approaches called “lucky imaging” is generally employed to reduce the blurring effects and improve the imaging quality after sampling in a complex environment such as turbulence [19]. By fusing the lucky frames (those of high quality) and removing the others, from a short-exposure video stream, a high-quality output image can be obtained without prior information of signal and noise [19, 20]. However, since random loss of the signals during sampling leads to imaging failure with a high probability [21], “lucky imaging” is not adequately suited to current GI architecture in complex environments.For GI, the design of illumination patterns determines the imaging quality essentially [22]. Such designs can be roughly divided into two categories: random patterns and orthogonal patterns. Random patterns exhibit nonorthogonality, which allows GI to tolerate a certain degree of environmental disturbances [23, 24]. However, using random illuminations generally entails time and space costs to acquire images with desired signal-to-noise ratio due to the mass redundant measurements [25]. Effective GI can be performed using orthogonal patterns, generated through a specific basis, such as wavelet [26, 27], Fourier [28–30], or Hadamard basis [31–34]. However, information obtained from one pattern is independent to that obtained from others, therefore cannot be retrieved precisely via others. This means that distortion or loss of bucket signals may result in severe degradation of imaging quality using orthogonal patterns [35, 36]. The utilization of orthogonal patterns making GI effective while less robust than that of random patterns. To the best of our knowledge, current GIs primarily consider only orthogonal or random patterns for imaging. Therefore, it is difficult to achieve both high-quality and high-efficiency imaging with the existing GI architecture in the event of signal distortion or loss [37].Here, we present multiple description coding ghost imaging (MDCGI), achieving robust and high-performance imaging even in situations where nearly half of the bucket signals has been distorted or lost. Each pattern in MDCGI is created by overlapping patterns generated from two different kinds of coding schemes: random patterns and orthogonal patterns. Each kind of illumination encodes different features of the target region within the same frame. One sequence of bucket signals contains information that can be decoded from different codings to reconstruct different results. Fusing these results will provide a high-quality outcome. Validity of the proposed method is confirmed by simulation and experimental results. In the experiments, MDCGI has been shown to be capable of reconstructing an acceptable image with effective sampling rate being only 2.5%. The proposed method demonstrates the immense potential for imaging applications in complex environments, especially where signals are easy to be distorted or lost.
2 Materials and methods
In GI, the quality of images obtained by orthogonal illuminations is usually better than that obtained by random illuminations with certain number of illumination frames for low-noise cases. The use of orthogonal illuminations helps reduce redundant measurements and improves the signal-to-noise ratio of the reconstruction. Due to the fact that information obtained by each pattern cannot be acquired from others, the presence of a complex environment that leads to signal distortion or loss may result in a substantial deterioration of imaging quality when utilizing orthogonal illuminations. To preserve imaging quality in complex environments, random illuminations are more suitable as they generally conduct better robustness. However, when imaging in a low-noise environment, the usage of random illuminations usually incurs an inefficient time cost, which is considered unaffordable for some real-time scenarios. Orthogonal and random illuminations possess individual superiority and drawback, respectively. In this paper, we combine the benefits of both by designing a specially tailored illumination scheme through multiple description coding. Here, the designed illuminations can be considered as a process of multiple description coding to the target region. By performing multiple decoding accordingly on the bucket signals, we can reconstruct different imaging results. The fusion of multiple results help mitigate the effects of signal distortion or loss. The scheme of MDCGI is shown in Figure 1. In this paper, the patterns are constructed from Fourier sinusoidal patterns and random patterns. As in Fourier ghost imaging (FGI), the Fourier spectrum of the target region is calculated with bucket signals corresponding to the Fourier sinusoidal patterns, and the image is reconstructed by inverse transformation. The Fourier sinusoidal patterns P can be generated according to the following formula,
Here x and y represent the two-dimensional Cartesian coordinates in the projection plane. a and b are the mean intensity and contrast of the generated pattern. fx and fy represent two-dimensional spatial frequencies. According to the four-step phase-shifting algorithm [28], ϕ takes on four specific values of 0, π/2, π and 3π/2. To obtain one Fourier coefficient, four sinusoidal patterns P0, Pπ/2, Pπ, and P3π/2 need to be projected onto the target area. As for MDCGI, four patterns for each Fourier coefficient are designed as,
Here R1 and R2 are random patterns. Fourier sinusoidal patterns and random patterns are grayscaled. However, the patterns actually loaded on DMD need to be binary. Therefore, we convert patterns from grayscale to binary by using the Floyd-Steinberg error diffusion dithering method [38]. The bucket signal of the photodetector can be expressed,
Here K indicates the gain of imaging system (including efficiency of optical path, efficiency of photodetector, etc.), O represents the reflectivity of the target region, and Dnoise indicates the response to environmental illuminations. According to the four-step phase-shifting algorithm [28], the Fourier coefficient can be obtained as,
According to Eq. 4, the calculation of all Fourier coefficients through
F−1 indicates the inverse Fourier transformation. Since
Here ⟨…⟩ indicates ensemble average. With one single sequence of bucket signals, two images of the target are reconstructed through two different decodings. In situations under a complex environment (such as unexpected flicker), the sequence of bucket signals may become partially distorted, as shown in Figure 1. To recognize and remove these distorted signals, anomaly detection will be applied through the calculation of the absolute value obtained by the difference in bucket signals,
Here δ+ indicates the bucket signal corresponding to the white pattern (illumination intensity on all pixles being 1) and δ− indicates the bucket signal corresponding to no illumination, and they can be obtained in the sequence of bucket signals respectively. Di and Dj represent the ith and jth bucket signals in the sequence. δ+ − δ− is actually the maximum allowable value for the difference between any two bucket signals. Once the difference exceeds this value, the bucket signals Di and Dj can be considered as distorted signals, thus set to 0. The calculations are done between any two bucket signals theoretically. Considering the possible low-frequency noise and light source fluctuation in the actual environment, the calculation is done between two neighboring bucket signals actually. Therefore, the sequence of bucket signals corresponding to all illumination patterns is partially absent. This may also be the case in some environments where the actual echoes are extremely weak. For the result obtained from inverse Fourier transformation, the loss of bucket signals indicates partial Fourier coefficients are randomly lost, causing degrading in image quality. However, due to the redundant measurement of random illumination, the loss of part bucket signal introduces less effect on the result. The fusion of two results provides a better final image, which can be operated in either spatial domain or the Fourier domain. In this paper, we fuse different results for better image in the Fourier domain,
Here, we set ω1 as the weight coefficient of the result from orthogonal illumination and ω2 as the weight coefficient of the result from random illumination for image fusion, respectively. When there is little distortion or loss of the bucket signal, the result from orthogonal illumination tends to be better. Under the condition that bucket signals are seriously distorted or lost, the result from orthogonal illumination tends to be worse. Therefore the weight of two reconstructions should be adjusted properly in the image fusion. The values depend on the image quality of two different reconstructions. Under the condition that there is no distortion or loss, we set ω1 as 1. As the level of distortion or loss increases, the value of ω1 decays and ω2 rises.

FIGURE 1. The scheme of MDCGI under distorted echoes. The designed patterns are constructed from Fourier sinusoidal patterns and random patterns. Part of the bucket signals in the sequence is distorted in a complex environment. Through anomaly signal detection, the distorted echoes are set to 0. Different results can be reconstructed from the sequence of bucket signals with loss through different decoding schemes, then the final image can be obtained through image fusion.
3 Experiment
In order to verify MDCGI under the condition of partially distortion or loss, we compared it with GI using random patterns (RGI) and FGI through simulation. As shown in Figure 2, a USAF test chart has been taken as the target in the simulation. We use the signal loss rate as a quantitative measure of partial signal loss.
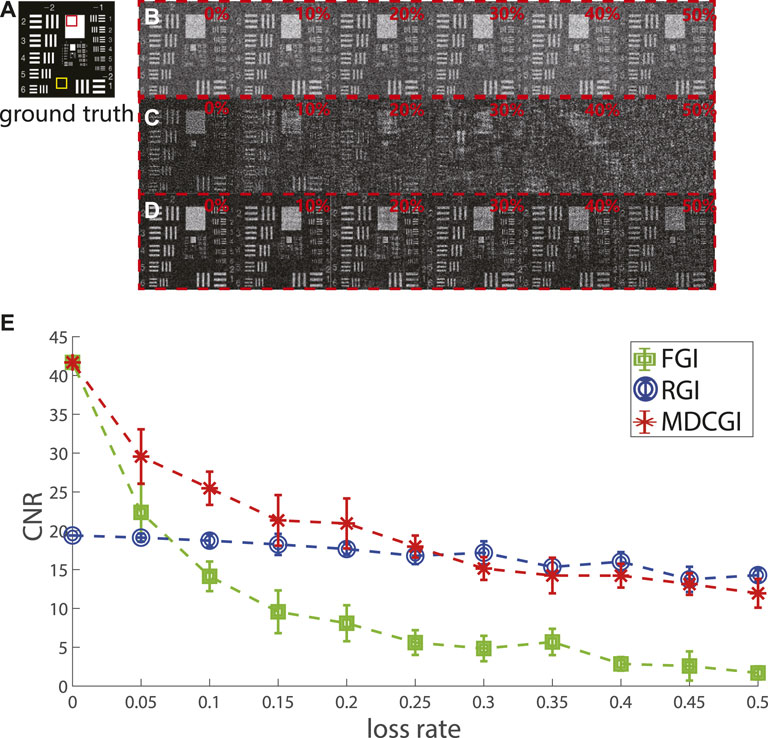
FIGURE 2. Simulation results. (A) USAF test chart with 11,025 pixels. (B) Reconstructions from RGI. (C) Reconstructions from FGI. (D) Reconstructions from MDCGI. (E) CNRs of the imaging results reconstructed.
In Figures 2B–D, imaging results are shown under the signal loss rate increases from 0% to 50% in step of 10% from left to right. 44,100 patterns containing 105 × 105 pixels generated randomly are projected with results shown in Figure 2B. In order to make a fair comparison, 44,100 patterns containing the same pixels generated from FGI and MDCGI are projected, with results shown in Figures 2C, D, respectively. The redundant measurements by random patterns ensure that there is less degradation in image quality even when half of the signals are lost. On the other hand, the using of orthogonal patterns helps improve the signal-to-noise ratio under no signal loss. Without signal loss, the contrast-to-noise ratio (CNR) of the results reconstructed from RGI is frequently lower than those from FGI. Under the condition of random loss of 20%, image reconstructed from FGI has been far beyond recognition visually. The image quality deteriorates further as the quantity of loss increases, in Figure 2C. Figure 2D are reconstructed from MDCGI. Under the condition that there is no loss, the result obtained by FGI can be considered a complete reconstruction, while that obtained by RGI is relatively limited. Therefore, ω1 is set as 1, and ω2 is set as 0 initially. As the loss rate increases, the imaging quality of FGI is obviously decreased, while that of RGI is almost unaffected. Theoretically, the higher the loss rate, the less information can be obtained from the reconstruction of FGI. Therefore, the value of ω1 decays gradually, and ω2 rises correspondingly. In the condition that the loss rate reaches the highest (50% here), the ratio of ω1 to ω2 is set to 1 : 5 for Figure 2D. As the loss rate increases, the image quality decreases. However, it is still clear enough for visual discernment through the reconstructions provided by MDCGI, as shown in Figure 2D. CNR is calculated as [40],
where ⟨If⟩ is the average brightness of the target feature region (highlighted by the red square in Figure 2A), ⟨Ib⟩ is the average brightness of the background region (highlighted by yellow square in Figure 2A), σf and σb are the standard deviation of the target feature and background respectively. In the case of no loss, CNR of FGI and MDCGI is 41.68. Correspondingly, the average value of CNR of RGI is 19.39. CNRs of FGI decrease rapidly as the signal loss rate increases, with CNR of 1.69 at a loss rate of 50%, CNR of MDCGI and RGI is 11.94 and 14.28 as shown in Figure 2E. The results shown in Figure 2 indicates the effectiveness of MDCGI under the condition of random signal loss.
Benefiting from the sparsity of natural images, visually acceptable images can be reconstructed without full sampling [25, 28, 36]. Simulations are performed at lower sampling rates. Figure 3A are reconstructed from 4,624 random patterns with 105 × 105 pixels, at a sampling rate of approximate 42%. As shown in Figure 3A, the USAF test chart becomes increasingly difficult to discern at the signal loss rate increasing from 0% to 50%. Figure 3B are reconstructed from 4,624 patterns with 105 × 105 pixels generated through FGI. Without random loss, the result of FGI appears ringing artifact due to undersampling. The results of MDCGI appear no ringing artifact. With increasing random loss, it is impossible to obtain visually acceptable image from FGI. Different from RGI and FGI, bars in the USAF resolution test chart can be identified from the results of MDCGI as shown in Figure 3C. The simulation results shown in Figure 3 indicate the effectiveness of MDCGI in the condition of undersampling under random signal loss.
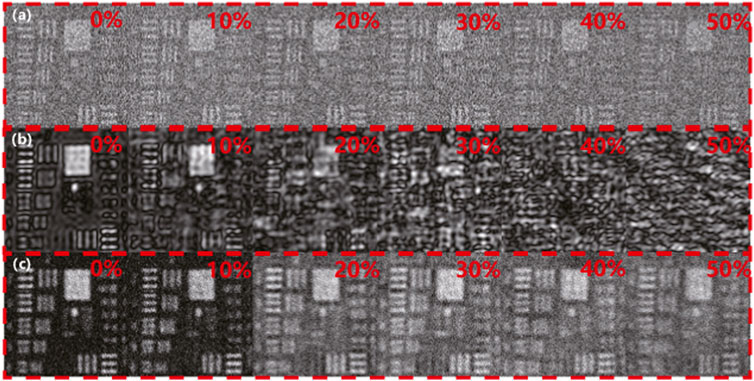
FIGURE 3. Comparison of reconstructions under the condition of undersampling from RGI, FGI, and MDCGI. (A) Reconstructions from RGI. (B) Reconstructions from FGI. (C) Reconstructions from MDCGI.
To verify MDCGI with lost signals under the condition of further undersampling, simulations are conducted to compare it with RGI and FGI. The target is the letters “XYZ” as shown in Figure 4A. The results in Figures 4B–D are all obtained through projecting 576 patterns with 105 × 105 pixels, at a sampling rate of approximately 5%. In the results obtained from random patterns as shown in Figure 4B, none of the letters could be identified, regardless of whether the signal was lost or not. In the results obtained by FGI as shown in Figure 4C, letters could not be identified when the loss rate exceeds 10%. As shown in Figure 4D, “XYZ” could be identified at the loss rate from 0% to 50% with our method. The simulation shown in Figure 4 indicates the effectiveness and reveals the potential of MDCGI in the condition of further undersampling at random signal loss.
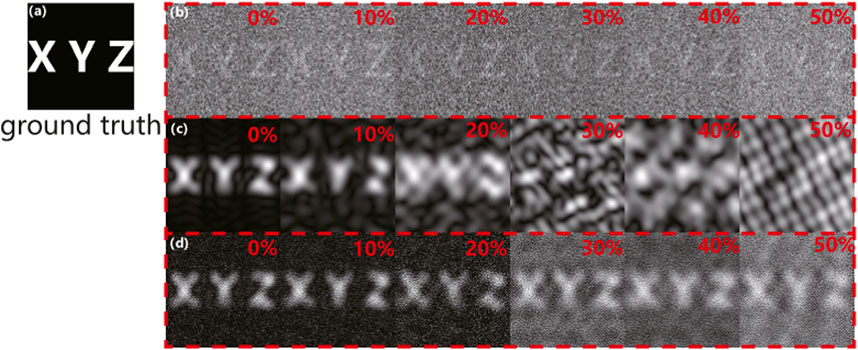
FIGURE 4. Simulation results in the condition of further undersampling under the signal loss rate increases from 0% to 50% in step of 10% from left to right. (A) Ground truth of the letters “XYZ.” (B) Reconstructions from RGI. (C) Reconstructions from FGI. (D) Reconstructions from MDCGI.
In order to further verify MDCGI in practical applications, experiments are carried out. To simulate random noise, an additional lighting source was employed, which blinks randomly during signal acquisition. The additional light source is a projector with a maximum power of 203W (viewsonic K701), which blinks randomly during the imaging process. The extent of influence on the GI process is changed by controlling the frequency of flicker illumination from the additional light source. If the additional light source does not blink during the whole process, GI process is not affected. The higher the frequency of random flicker, the more the GI process is affected. Wavelength, frequency, or polarization characteristics are not used to distinguish this noise. The illumination source is a LED with an output power of 170 mW at 470 nm (THORLABS LED470L). A digital micro-mirror device (DMD, Texas Instruments DLP7000) is used to modulate the spatial patterns onto the beam from LED. A photodetector PDA100A2 is used to measure the bucket signal. Experiments are carried out by projecting patterns generated through MDCGI with 105 × 105 pixels, in the condition that sampling rate being about 5% (i.e., projecting 576 patterns).
As shown in Figure 5, the blue line represents the unaffected bucket signals, and the red line indicates the affected bucket signals (about 63% of the signals are affected). By utilizing anomaly detection as shown in Eq. 7, distorted signals within the sequence of bucket signals can be exterminated. Then the result can be reconstructed from the sequence, in which some elements are absent, via RGI, FGI, and MDCGI.
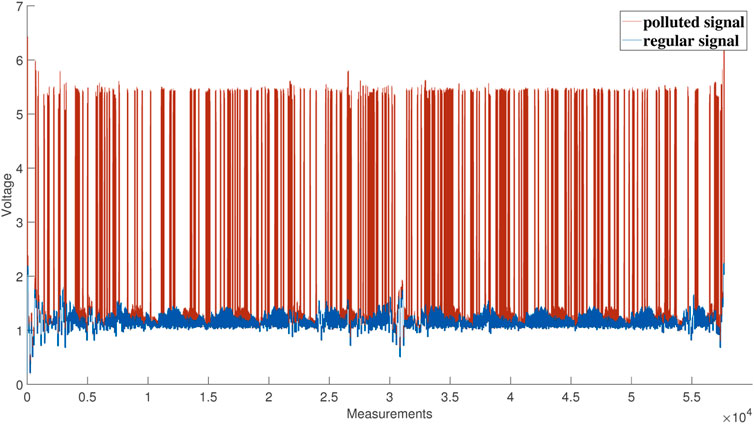
FIGURE 5. Diagram of affected and unaffected sequences of bucket signals under the condition of the same photodetector gain.
As shown in Figure 6, the quality of images obtained by MDCGI and FGI is equivalent under the condition that few bucket signals are affected. As the number of affected signals increases, FGI is unable to obtain recognizable results and MDCSGI is able to obtain acceptable results under the condition of affected bucket signals reaches about 52% (actual sampling rate being about 2.5%). Regardless of whether the GI process was affected or not, RGI cannot reconstruct a distinct image.
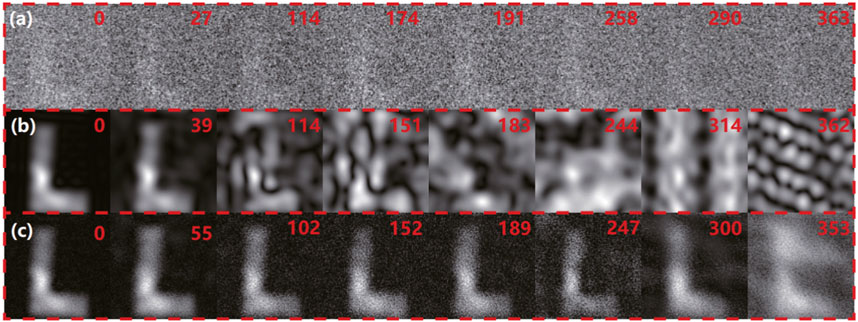
FIGURE 6. Comparison of experimental reconstructions under the condition of undersampling from RGI, FGI, and MDCGI. the top right of each reconstruction indicates the number of measurements that were affected. (A) Results from RGI. (B) Results from FGI. (C) Results from MDCGI.
Simulations and experiments indicate that both FGI and MDCGI are capable of reconstructing acceptable images in the case of none or few distortion. With the increase of distorted measurements, the quality of FGI reconstruction decreases rapidly, while that of MDCGI reconstruction is barely down. Although the reconstruction through RGI is not sensitive to the number of distorted signals, it is clear only at high sampling rate, and it is hard to reconstruct a clear image at low sampling rate. By combining the strength of orthogonal patterns and random patterns, MDCGI has the ability to generate satisfactory reconstructions at a low sampling rate, even when dealing with signals that almost 50% are distorted.
4 Conclusion
In conclusion, we proposed MDCGI, which improves the performance and robustness of GI in complex environments by combining the superiorities of orthogonal and random illuminations. With an extremely limited random sampling rate of only 2.5%, the proposed method reconstructs identifiable images in the experiments. MDCGI has considerable potential in solving crosstalk between active imaging devices, avoiding the influence of background flicker in weak illumination. Under the condition that detected signals are partially distorted or lost, MDCGI has the capability of maintaining imaging quality. However, since the two image reconstruction algorithms are linear, the increasing in calculation time for reconstruction and fusion can be almost ignored. Therefore, this method can be well adapted to the existing GI architecture.
Data availability statement
The raw data supporting the conclusion of this article will be made available by the authors, without undue reservation.
Author contributions
YiZ: Conceptualization, Software, Writing–original draft. YuZ: Validation, Writing–review and editing. CC: Writing–review and editing. SS: Writing–review and editing. WL: Conceptualization, Writing–review and editing.
Funding
The authors declare financial support was received for the research, authorship, and/or publication of this article. This research is supported by the National Natural Science Foundation of China (under Grant Nos. 62275270 and 62105365).
Conflict of interest
The authors declare that the research was conducted in the absence of any commercial or financial relationships that could be construed as a potential conflict of interest.
Publisher’s note
All claims expressed in this article are solely those of the authors and do not necessarily represent those of their affiliated organizations, or those of the publisher, the editors and the reviewers. Any product that may be evaluated in this article, or claim that may be made by its manufacturer, is not guaranteed or endorsed by the publisher.
References
1. Li G, Wang Y, Huang L, Sun W. Research progress of high-sensitivity perovskite photodetectors: A review of photodetectors: Noise, structure, and materials. ACS Appl Electron Mater (2022) 4:1485–505. doi:10.1021/acsaelm.1c01349
2. Rezaei M, Bianconi S, Lauhon LJ, Mohseni H. A new approach to designing high-sensitivity low-dimensional photodetectors. Nano Lett (2021) 21:9838–44. doi:10.1021/acs.nanolett.1c03665
3. Royo S, Ballesta-Garcia M. An overview of lidar imaging systems for autonomous vehicles. Appl Sci (2019) 9:4093. doi:10.3390/app9194093
4. Chrzanowski K. Review of night vision technology. Opto-electronics Rev (2013) 21:153–81. doi:10.2478/s11772-013-0089-3
5. Edgar MP, Gibson GM, Padgett MJ. Principles and prospects for single-pixel imaging. Nat Photon (2019) 13:13–20. doi:10.1038/s41566-018-0300-7
6. Gibson GM, Johnson SD, Padgett MJ. Single-pixel imaging 12 years on: a review. Opt express (2020) 28:28190–208. doi:10.1364/oe.403195
7. Chen Y, Yin K, Shi D, Yang W, Huang J, Guo Z, et al. Detection and imaging of distant targets by near-infrared polarization single-pixel lidar. Appl Opt (2022) 61:6905–14. doi:10.1364/ao.465202
8. Wang Y, Huang K, Fang J, Yan M, Wu E, Zeng H. Mid-infrared single-pixel imaging at the single-photon level. Nat Commun (2023) 14:1073. doi:10.1038/s41467-023-36815-3
9. Ma M, Zhang Y, Gu L, Su Y, Gao X, Mao N, et al. Reflection removal detection enabled by single-pixel imaging through the semi-reflective medium. Appl Opt (2021) 60:8688–93. doi:10.1364/ao.433132
10. Li D, Yang D, Sun S, Li Y-G, Jiang L, Lin H-Z, et al. Enhancing robustness of ghost imaging against environment noise via cross-correlation in time domain. Opt Express (2021) 29:31068–77. doi:10.1364/oe.439519
11. Xu Y-K, Liu W-T, Zhang E-F, Li Q, Dai H-Y, Chen P-X. Is ghost imaging intrinsically more powerful against scattering? Opt express (2015) 23:32993–3000. doi:10.1364/oe.23.032993
12. Chen Q, Mathai A, Xu X, Wang X. A study into the effects of factors influencing an underwater, single-pixel imaging system’s performance. Photonics (MDPI) (2019) 6:123. doi:10.3390/photonics6040123
13. Yang X, Liu Y, Mou X, Hu T, Yuan F, Cheng E. Imaging in turbid water based on a hadamard single-pixel imaging system. Opt Express (2021) 29:12010–23. doi:10.1364/oe.421937
14. Soldevila F, Irles E, Durán V, Clemente P, Fernández-Alonso M, Tajahuerce E, et al. Single-pixel polarimetric imaging spectrometer by compressive sensing. Appl Phys B (2013) 113:551–8. doi:10.1007/s00340-013-5506-2
15. Xu S, Zhang J, Wang G, Deng H, Ma M, Zhong X. Single-pixel imaging of high-temperature objects. Appl Opt (2021) 60:4095–100. doi:10.1364/ao.421033
16. Bashkansky M, Park SD, Reintjes J. Single pixel structured imaging through fog. Appl Opt (2021) 60:4793–7. doi:10.1364/ao.425281
17. Gao X, Deng H, Ma M, Guan Q, Sun Q, Si W, et al. Removing light interference to improve character recognition rate by using single-pixel imaging. Opt Lasers Eng (2021) 140:106517. doi:10.1016/j.optlaseng.2020.106517
18. Li M, Mathai A, Yandi L, Chen Q, Wang X, Xu X. A brief review on 2d and 3d image reconstruction using single-pixel imaging. Laser Phys (2020) 30:095204. doi:10.1088/1555-6611/ab9d78
19. van Eekeren AW, Schutte K, Dijk J, Schwering PB, van Iersel M, Doelman NJ. Turbulence compensation: an overview. Infrared Imaging Syst Des Anal Model Test (2012) 8355:224–33. doi:10.1117/12.918544
20. Wu X, Yan J, Wu K, Huang Y. Integral lucky imaging technique for three-dimensional visualization of objects through turbulence. Opt Laser Tech (2020) 125:105955. doi:10.1016/j.optlastec.2019.105955
21. Osorio Quero CA, Durini D, Rangel-Magdaleno J, Martinez-Carranza J. Single-pixel imaging: An overview of different methods to be used for 3d space reconstruction in harsh environments. Rev Scientific Instr (2021) 92:111501. doi:10.1063/5.0050358
22. Gao C, Wang X, Wang Z, Li Z, Du G, Chang F, et al. Optimization of computational ghost imaging. Phys Rev A (2017) 96:023838. doi:10.1103/physreva.96.023838
23. Hardy ND, Shapiro JH. Reflective ghost imaging through turbulence. Phys Rev A (2011) 84:063824. doi:10.1103/physreva.84.063824
24. Nie X, Yang F, Liu X, Zhao X, Nessler R, Peng T, et al. Noise-robust computational ghost imaging with pink noise speckle patterns. Phys Rev A (2021) 104:013513. doi:10.1103/physreva.104.013513
25. Qiu Z, Zhang Z, Zhong J Comprehensive comparison of single-pixel imaging methods. Opt Lasers Eng (2020) 134:106301. doi:10.1016/j.optlaseng.2020.106301
26. Rousset F, Ducros N, Farina A, Valentini G, d’Andrea C, Peyrin F. Adaptive basis scan by wavelet prediction for single-pixel imaging. IEEE Trans Comput Imaging (2016) 3:36–46. doi:10.1109/tci.2016.2637079
27. Czajkowski KM, Pastuszczak A, Kotyński R. Single-pixel imaging with morlet wavelet correlated random patterns. Scientific Rep (2018) 8:466. doi:10.1038/s41598-017-18968-6
28. Zhang Z, Ma X, Zhong J. Single-pixel imaging by means of fourier spectrum acquisition. Nat Commun (2015) 6:6225. doi:10.1038/ncomms7225
29. Huang J, Shi D, Yuan K, Hu S, Wang Y. Computational-weighted fourier single-pixel imaging via binary illumination. Opt express (2018) 26:16547–59. doi:10.1364/oe.26.016547
30. Deng H, Gao X, Ma M, Yao P, Guan Q, Zhong X, et al. Fourier single-pixel imaging using fewer illumination patterns. Appl Phys Lett (2019) 114:221906. doi:10.1063/1.5097901
31. Zhang Z, Wang X, Zheng G, Zhong J. Hadamard single-pixel imaging versus fourier single-pixel imaging. Opt Express (2017) 25:19619–39. doi:10.1364/oe.25.019619
32. Sun M-J, Meng L-T, Edgar MP, Padgett MJ, Radwell N. A Russian dolls ordering of the hadamard basis for compressive single-pixel imaging. Scientific Rep (2017) 7:3464. doi:10.1038/s41598-017-03725-6
33. Vaz PG, Amaral D, Ferreira LR, Morgado M, Cardoso J. Image quality of compressive single-pixel imaging using different hadamard orderings. Opt express (2020) 28:11666–81. doi:10.1364/oe.387612
34. López-García L, Cruz-Santos W, García-Arellano A, Filio-Aguilar P, Cisneros-Martínez JA, Ramos-García R. Efficient ordering of the hadamard basis for single pixel imaging. Opt Express (2022) 30:13714–32. doi:10.1364/oe.451656
35. Xiao Y, Zhou L, Chen W. Fourier spectrum retrieval in single-pixel imaging. IEEE Photon J (2019) 11:1–11. doi:10.1109/jphot.2019.2898658
36. Wenwen M, Dongfeng S, Jian H, Kee Y, Yingjian W, Chengyu F. Sparse fourier single-pixel imaging. Opt express (2019) 27:31490–503. doi:10.1364/oe.27.031490
37. Jiang S, Li X, Zhang Z, Jiang W, Wang Y, He G, et al. Scan efficiency of structured illumination in iterative single pixel imaging. Opt Express (2019) 27:22499–507. doi:10.1364/oe.27.022499
39. Bromberg Y, Katz O, Silberberg Y. Ghost imaging with a single detector. Phys Rev A (2009) 79:053840. doi:10.1103/PhysRevA.79.053840
Keywords: single-pixel imaging, ghost imaging, multiple description coding, Fourier transform, undersampling imaging
Citation: Zhang Y, Zhang Y, Chang C, Sun S and Liu W (2023) Multiple description coding ghost imaging. Front. Phys. 11:1277299. doi: 10.3389/fphy.2023.1277299
Received: 14 August 2023; Accepted: 13 September 2023;
Published: 27 September 2023.
Edited by:
Tao Peng, Texas A and M University, United StatesReviewed by:
Dongmei Liu, South China Normal University, ChinaYuchen He, Xi’an Jiaotong University, China
Copyright © 2023 Zhang, Zhang, Chang, Sun and Liu. This is an open-access article distributed under the terms of the Creative Commons Attribution License (CC BY). The use, distribution or reproduction in other forums is permitted, provided the original author(s) and the copyright owner(s) are credited and that the original publication in this journal is cited, in accordance with accepted academic practice. No use, distribution or reproduction is permitted which does not comply with these terms.
*Correspondence: Weitao Liu, d3RsaXVAbnVkdC5lZHUuY24=
 Yi Zhang
 Yunhe Zhang1,2
 Chen Chang