 Yiyang Xiong
 Shilei Dong1
 Fangning Shi
95% of researchers rate our articles as excellent or good
Learn more about the work of our research integrity team to safeguard the quality of each article we publish.
Find out more
ORIGINAL RESEARCH article
Front. Phys. , 16 October 2023
Sec. Social Physics
Volume 11 - 2023 | https://doi.org/10.3389/fphy.2023.1273862
This article is part of the Research Topic Evolutional Trends and Applications of Wireless IoT View all 4 articles
There has been a significant increase in IoT-related network traffic in recent years. The surge in IoT has resulted in a more complex network environment than ever before. In light of this, deep learning (DL)-based network traffic classification has gained prominence, because of its powerful feature extraction capabilities for complex problems. However, selecting hyperparameters for DL models, such as network depth, lacks a theoretical basis and costs a lot of time. Often, the setting of hyperparameters is not directly related to the inherent characteristics of the data but relies on empirical knowledge. Traditionally, hyperparameters are adjusted based on performance during model training, leading to a significant amount of tuning work. To address these problems, this paper proposes a novel DL-based anomaly network traffic classification algorithm. This algorithm estimates the required hyperparameters by analyzing the spectrum obtained from Fourier Transform of the input samples in advance, enhancing the efficiency of model training for IoT network traffic classification. Our experiments reveal that the complexity of the neural network is directly proportional to the spectrum of the data being trained. As the presence of high-frequency components increases, the complexity needed for the neural network parameters also rises. Based on the conclusions drawn from our experiments, we can pre-determine appropriate hyperparameters for the neural network, thereby saving over 70% of the time in neural network parameter tuning.
The rapid development of the Internet of Things (IoT) has brought about immense benefits, enabling a myriad of interconnected devices to communicate and share data seamlessly. However, it has also buried considerable security risks. In the past, network traffic, including abnormal traffic, was primarily generated by mature, strong endpoints with robust security capabilities, such as smartphones. With the proliferation of IoT, any device, no matter how small or simplistic, can potentially generate abnormal traffic. Furthermore, many IoT devices often lack pre-installed security measures, posing significant challenges to the detection of abnormal IoT traffic: On the one hand, the net-work is more susceptible to attacks, as abnormal requests can be generated towards servers in numerous ways. On the other hand, the network environment becomes more complex, leading to increased debugging costs for server developers. Despite the efficient use of resources offered by sophisticated and virtualized server systems, they face significant challenges in classifying network traffic, especially given the scale and diversity of IoT-generated traffic. The ability to classify network traffic automatically and intelligently, detect abnormal traffic, uncover previously unknown attack behaviors, and support network situational awareness has therefore become more critical than ever in maintaining the stability and security of the entire network environment within this rapidly evolving IoT landscape.
Traditional IoT network traffic classification mainly focuses on four types, namely, statistics-based method, behavior learning based method, deep packet inspection (DPI) based method and port-based method [1]. Among them, with the characteristics of avoiding handling encrypted traffic and satisfactory accuracy, machine learning (ML) based on statistics or behavior method has become a popular research direction. For specific implementation, a set of traffic characteristics is firstly designed, then the set of features and prepared tags are modeled and trained therein, and finally, the trained model is employed for discrimination. Compared with symbolic learning, ML based statistics or behavior method has significant advantages in terms of performance. Therefore, ML algorithms represented by support vector machines (SVM) [2] and gradient boosting trees [3] are widely considered in network traffic classification. However, the performance of ML will be significantly reduced in the scenarios, where the amount of data is enormous because of the shortcoming in extracting enough high-dimensional features.
As a branch of ML and a kind of statistical learning, the predecessor of deep learning (DL), neural network, was founded in the 1990s [4]. However, in the 1990s, computer computing resources could not support the training of deep neural network, so to obtain excellent performance is unavailable. In 2006, professor Hinton put forward the theory of DL, which was gradually known by the academic community [5]. By 2012, DL algorithm had achieved significant performance than the second place in the ImageNet competition [6], and from then on, a new generation of artificial intelligence (AI) was booming. Convolutional neural network, recurrent neural network, attention mechanism, transformer [7–10] and other models based on DL emerge continuously, and have achieved great success in voice, image and natural language processing [11]. This provides a new technical route for network traffic classification technology.
Deep Learning (DL) eliminates the need for manual feature extraction, thus the performance of the model doesn’t hinge on an engineer’s understanding of the problem. It can accomplish end-to-end construction and prediction of algorithms. Unlike traditional Machine Learning (ML) that only manages shallow learning, DL is capable of extracting high-dimensional features. As we foresee a future of increasingly complex IoT network traffic and rapidly expanding data dimensions, DL proves to be more ro-bust and flexible compared to traditional ML algorithms. While DL excels in handling problems with homogeneous data types (e.g., language, where each word is a character and belongs to the same kind of data), it doesn’t display obvious advantages for problems with heterogeneous data types (e.g., data from different aspects like people’s height and weight). Therefore, the transformation of network traffic data is an urgent issue we need to address. Our solution to this issue is achieved by utilizing the network log data generated by the server.
When network traffic data is in operation, corresponding log files are generated. These files allow us to capture the behavior of a certain type of traffic over a specific period of time. By learning these behaviors and creating labels for the text data, we transform the network traffic classification problem into a text classification problem. This is one of the areas where deep learning excels.
However, in practice, we find that the ever-changing Internet of Things (IoT) environment introduces a level of complexity to the data composition. Every time we encounter a new environment, we need to retrain a neural network model. This frequent retraining not only consumes significant resources but also limits the efficiency of our work in IoT traffic classification.
To address this issue, we need to promote the implementation of suitable models and fine-tune them for different environments. However, the task is not straightforward. Deep Learning, though capable of operating tasks end-to-end, requires substantial parameter adjustments during implementation. The depth of the neural network is the first parameter to consider when constructing the network. For a Convolutional Neural Network (CNN), convolution kernels need to be preset; for a Recurrent Neural Network (RNN), the number of stacked layers and parameters for each layer need to be preset; and for a Transformer, setting the number of multi-head attention mechanisms is unavoidable. These parameters are initially set using hyperparameters and adjusted progressively with the training until the optimal model is achieved.
The selection of network depth is a crucial task as it directly influences the complexity and training time of the model. If we could develop a robust algorithm that could provide us with references for deep learning parameter tuning in advance, based on the differences in environmental data, we could greatly increase our efficiency in IoT traffic classification. Therefore, we posit that such an algorithm is a key solution to improving IoT traffic classification efficiency and this paper aims to contribute to this area of re-search.
Generally speaking, as the number of layers in a neural network increases, its ability to extract high-dimensional information improves, enhancing model performance. However, an excessively complex model can also introduce several issues, such as: 1. Gradient vanishing and network degradation [12, 13]. 2. Increased training time and data requirements, leading to a higher risk of overfitting. Nevertheless, the network depth cannot be too shallow either, as a shallow neural network can’t extract high-dimensional features and may underperform even compared to traditional models in terms of accuracy. Hence, having a neural network depth that is well-suited to the data and the problem at hand is essential, which is the specific problem studied in this paper: how to pre-construct a network that fits with IoT traffic data? How to know the reference neural network hyperparameters before training?
Our innovative inspiration comes from the design approach of communication systems. The design of communication systems is accomplished through Fourier transformation [14]. For a source signal, after source coding, it is mapped to the frequency domain for processing. This is because the match between the channel band-width and the signal is very important. If the channel bandwidth is less than the signal’s frequency range, the signal will lose crucial information during transmission. Conversely, if the channel bandwidth exceeds the signal’s frequency range, it not only consumes additional precious spectrum resources but also introduces more Gaussian white noise, degrading the signal transmission quality. Therefore, the channel’s band-width and the signal need to be matched, with the bandwidth size generally designed after obtaining the maximum frequency through the Fourier transform of the signal. For example, the frequency of human speech signals generally does not exceed 3 kHz, so the bandwidth of the voice system is usually within this range [15].
Returning to our problem, after our IoT network traffic data undergoes word embedding calculations, it becomes a numerical matrix. This is similar to image grayscale values and can have its frequency information calculated via Fourier transform. Following this thought process, this paper proposes an IoT network traffic classification scheme based on deep learning, with the neural network’s hyperparameters obtained through Fourier transform calculations.
The main contributions of this paper are as follows:
1. Since neural networks can only process numerical data, the original text data can only be understood by the neural network after going through word embedding. Therefore, we first perform word embedding calculations on the original IoT traffic log data. By adjusting the word embedding size in the word embedding layer, we discuss the differences in the Fourier transform results of different word vectors. Simulation results show that the larger the word embedding dimension, the greater the product of the Fourier transform spectrum. This way, in subsequent experiments, we can adjust the frequency range of the original signal through the dimensions of word embedding.
2. To explore the impact of different spectral data on neural network parameters, this paper uses two types of neural networks: multilayer perceptrons and one-dimensional convolutional neural networks. We compare and analyze the optimal number of layers for the two neural networks under different frequency data through experiments. The results show that for multilayer perceptrons, the higher the frequency, the more complex the neural network should be, while for convolutional neural net-works, there is no obvious connection between the two.
3. This paper discusses and analyzes the mathematical relationship between neural network depth and the Fourier transform spectrum. Simulation results show that there is a direct linear relationship between them. Specifically, when the spectrum of the Fourier transform doubles, the complexity of the neural network will also double accordingly, and more than 10% additional parameters need to be added. However, for convolutional neural networks, the correlation is not significant. We speculate that this may be due to the frequency smoothing performed by the convolutional neural network on the word vector matrix. This leads to our conjecture: perhaps the powerful generalization ability of convolutional neural networks is achieved by removing redundant high-frequency components. Maybe in future data processing, we can remove high-frequency components before processing, which can improve the generalization performance of our neural networks.
The rest of the paper is arranged as follows. In Section 2, we review the research related to network traffic classification, especially the research progress of DL-driven network traffic classification. In Section 3, the detailed idea and theoretical basis of our algorithm is discussed. The performance of different neural networks is analyzed through simulation in Section 4. Finally, Section 5 summarizes this paper.
In the field of IoT network traffic classification, various machine learning (ML) techniques such as Support Vector Machines (SVM), K-Nearest Neighbors (KNN), Artificial Neural Networks (ANN), and Random Forest have been employed to enhance network performance [16–19]. However, as these traditional ML methods primarily extract low-dimensional features from input samples, they have limitations in handling complex IoT network traffic data that often contain both low-dimensional and high-dimensional features.
This has led to the rising popularity of deep learning (DL) techniques, which are capable of extracting both low-dimensional and high-dimensional features simultaneously. DL-driven network traffic schemes are showing potential for more robust and accurate classification. For instance, deep neural networks have been successfully applied in detecting abnormal network traffic [20]. Other studies have utilized DL methods based on the standard template library (STL) on NSL-KDD dataset to achieve remarkable performance [21]. Another approach involved the use of cyclic neural net-works as a framework [22]. In addition to the above influential work, there are also many other ML based studies [23–25].There are also studies that apply integrated sensing and communication technology to the Internet of Things, such as Unmanned Aerial Vehicles (UAVs) and energy conservation [26, 27]. Roughly estimated, ML-assisted schemes take up close to 40% of network traffic classification problem. Moreover, federated learning [28], unsupervised domain adaptation [29], and enhanced versions of convolutional neural networks [30] also have applications in the Internet of Things (IoT) domain.
Although these studies have made significant progress in traffic classification and multi-classification, their primary focus is on improving network architecture or feature extraction. They have not paid attention to the direct relationship between network hyperparameters and traffic data, which results in considerable tuning work in algo-rithm training.
Furthermore, with the development of the Internet of Things (IoT), the types of network traffic data are becoming increasingly complex, especially in the industrial field. The IoT connection situations in different industrial scenarios are vastly different, so each time the scenario changes, it is necessary to retrain the model and repeat the process of model construction and parameter adjustment.
In such a context, it is particularly important to design network hyperparameters that match the data characteristics in advance, as this can promote faster model training and save engineers’ debugging time. However, there is still little theoretical basis for setting these parameters. This paper aims to fill this gap, by conducting experiments with two types of classical and basic neural networks, multilayer perceptron (MLP) and convolutional neural networks (CNN), and proposing our own hypotheses about the experimental results while trying to establish a mathematical relationship between the hyperparameters and the original data.
In communication systems, the Fourier transform is a method of converting signals from the time domain to the frequency domain. Any function f(t) can be transformed into another corresponding function F
where FT is called the image function of f
Once the frequency domain information is obtained, as long as the sampling rate reaches twice the maximum frequency, the original signal can be completely restored. Therefore, communication systems often set the sampling rate as twice the maximum frequency of the original signal to maximize the utilization of spectral resources while ensuring the smooth recovery of the original information by the receiver [31].
Assume that the time-domain signal is
where
As long as (3) is satisfied, that is, the sampling frequency is twice the maximum frequency, the signal information before sampling can be completely restored.
Interestingly, the selection of hyperparameters in neural networks bears similarities to the choice of the sampling rate in communication theory. If the layers of a neural network are too few, it might not extract enough high-dimensional abstract features, leading to a lack of precision, which parallels the issue of a low sampling rate. Conversely, if the neural network is too deep, although precision can be ensured, a series of issues might arise, such as overly complex models, high cost, and even the occurrence of network degradation or gradient explosion caused by deep networks, similar to the situation with a high sampling rate.
Moreover, through certain cases, we have noticed a connection between the frequency of data and the complexity of the neural network. For instance, for a uniformly single-colored image with a frequency of 0, the required complexity of the neural net-work is very low. A single-layer network is sufficient to fit and learn all the information of the image. However, for images rich in color and with numerous edges, a more complex neural network is needed to learn the deep features they contain. The frequency domain of such images will also show many high-frequency components.
However, unlike the sampling rate in communication systems which is strictly calculated based on the Fourier transform, the selection of hyperparameters in neural networks, such as the depth of the network, often comes from practical experience and lacks theoretical support.
Therefore, inspired by the sampling theorem, in this paper, we attempt to establish a mathematical relationship between the frequency of the original data and the appropriate depth of the neural network. This established relationship could provide a reference for our initial hyperparameter selection in future scenarios.
In the following sections, we will use the real network traffic data generated by a sandbox program as an example to elucidate the fundamental principles of our algorithm. Our objective is to obtain the spectrum information of the original data via Fourier transform, and rapidly construct a neural network with a degree of matching based on this spectral data.
Given that our data originates from log data, which exists in text format, it is essential to perform word embedding prior to its processing by the neural network model. Through word embedding, we can convert text-based data into numerical vectors.
Embedding is a critical concept in deep learning, particularly in fields such as natural language processing (NLP). The core idea behind embeddings is to translate discrete objects such as words or categories into a continuous vector space.
The motivation for using embeddings comes from the challenge of representing symbolic data in a format that can be processed by a neural network. As many types of data, like text, are not natively numerical, they cannot be directly fed into a machine learning model. Embeddings offer a solution to this problem by mapping these discrete symbols into a continuous and typically lower-dimensional space. This mapping is based on the context or meaning of the symbols, thereby preserving the semantic relationships among the symbols in a numerical format.
Mathematically, this is done by creating a lookup table with parameters that are learned during the training process. Suppose we have a vocabulary of size “v”. Each symbol in this vocabulary is mapped to a unique vector in the embedding space. We can represent this mapping using an embedding matrix W:
where v is the size of the vocabulary, and wi is the i vector representation for the symbol i in the vocabulary.Given a symbol x (represented by its index in the vocabulary), we can retrieve its corresponding vector representation by:
where x is the index of the symbol in the vocabulary.
In this way, embeddings convert symbols into numerical vectors, making them amenable to processing by neural networks.In the deep learning framework PyTorch, the dimensionality of word embeddings can be adjusted on the fly. The same data can form different word embeddings, hence different spectral diagrams, depending on the size of the embedding dimension set.
The overall design concept of our paper is to modify the dimension of word embeddings to obtain different spectral representations of the same data. We then tune the neural network to fit these data, exploring the relationship between the most suitable network depth and the spectral diagram. After collecting data on the relationship be-tween the spectral diagram and the depth of the neural network through experiments, we use simple algorithmic models to fit the relationship between them and draw our conclusions.
In our proposed method, we first generate the word embeddings of our data, denoted as e. We then innovatively introduce positional encoding, p, and category encoding, c. The final representation of our data, f, is the concatenation of these three components, represented mathematically as:
where; represents concatenation of vectors. In this formula, p and c are computed independently, ensuring they add distinct value to the final encoding f.
For positional encoding p, we employ a variant of sine and cosine functions to capture the relative positioning of words. Each dimension i of the positional encoding vector p for a given position pos in the sentence is calculated as follows:
Here, pos iterates over the positions in the sentence and i over the dimensions of the word embedding space. The terms 2i and 2i + 1 denote even and odd indices respectively.
For category encoding c, we leverage a one-hot encoding scheme, giving us a binary vector of size ncategories, where ncategories is the total number of potential categories in the IoT data. Each category corresponds to a unique index in this vector, marked by a 1, with the remaining positions set to 0.For instance, in a case with 5 possible categories, if the current data belongs to the third category, the category encoding c would be [0, 0, 1, 0, 0].Generally, the one-hot encoding can be defined mathematically as:
In this, category represents the category of the current data.
After preprocessing the data, we obtained data objects that can be split and sorted as needed. The core of our algorithm will be discussed in this section. The Fourier Transform is commonly used in some engineering disciplines, such as communications. It can acquire frequency-domain information from time-domain signals. By applying the Fourier Transform to communication signals, we can determine the maximum sampling rate required for encoding. The Fourier Transform is also widely used in imaging, providing a reference for the design of graphic filters.
Network traffic data, after being preprocessed as mentioned earlier, is transformed into numerical data. Traditionally, neural network learning is conducted in batches. If we input data one by one, the neural network might experience significant shocks due to individual differences and fail to converge. Therefore, after obtaining word vectors through word embedding, category coding, and position encoding, we connect multiple word vectors (determined by the batch size) to obtain a word vector matrix. As every piece of traffic data will turn multi-dimensional after dictionary mapping, the superposition of multiple traffic data forms a two-dimensional matrix, similar to grayscale image values.
In image processing, researchers often assess the effects of filters and other image processors by observing their spectra. If there are many high-frequency components in the image spectrum, the image is more complex, requiring more bandwidth for transmission, and contains more information. Therefore, we speculate that the results of the Fourier Transform can be used as a reference for the amount of information in the data. On the other hand, in the construction of DL models, there is less research on the choice of hyperparameters. Generally, some empirical parameters are directly chosen (often quite complex), and overfitting problems are reduced through regularization methods. The model’s adjustments are entirely completed by the training itself, and the pre-set initial parameters have no substantive basis.
Hence, we innovatively propose a method to adjust hyperparameters related to the complexity of the neural network through the Fourier Transform. If there are many high-frequency components in the results of the Fourier Transform, the complexity of the neural network will increase because the data contains more information. Conversely, if there are fewer high-frequency components in the results of the Fourier Transform, the complexity of the neural network will not be high because there is less information in the data. From the perspective of images, intuitively, if an image is uniformly grayscale, there is no need to use a complex neural network. A single-layer RELU can extract its features because the data is very simple, and its corresponding spectrum is zero. If an image has a large number of different objects, it will inevitably generate a lot of edge information, and the results of the Fourier Transform will have many high-frequency components. The complexity of the neural network needed to learn this image will increase significantly because it contains too much information. The overall concept of our method is shown in Figure 1.
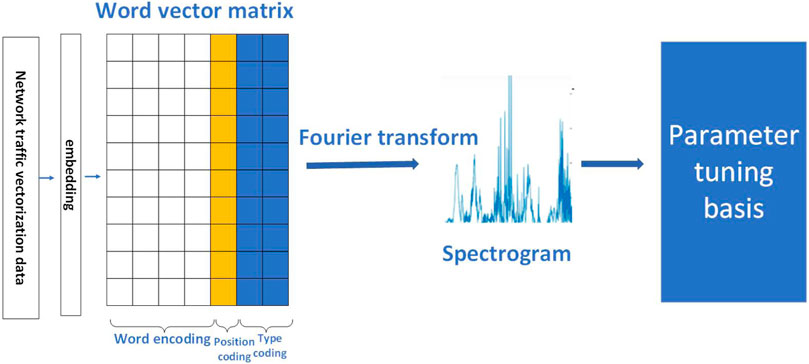
FIGURE 1. Our algorithm idea: optimizing neural network parameters through Fourier transform.
Subsequently, we leverage a single-layer RELU model to capture the relationship between the average, maximum, variance, and the most suitable neural network pa-rameters. Despite its simplicity, the RELU function is versatile, capable of modeling both linear and non-linear relationships. It can be seen as a single-layer neural network. Our approach employs a linear function as outlined in the following equation:
Here, X represents the maximum frequency, Y the average frequency, Z the variance, and b0 the offset. The output value corresponds to the predicted network parameter. The model parameters are updated through backpropagation based on experimental results and model predictions. Our experimental result utilizes the network parameter value corresponding to the first instance where the derivative of the network parameter with respect to model performance is zero. Owing to the model’s simplicity, a prediction model can be obtained after just ten training iterations. The conceptualization of our algorithm is depicted in Figure 2.

FIGURE 2. The core process of proposed scheme. We adapt RELU model to fit the relationship between the average, maximum, variance and the most appropriate neural network parameters.
Our model parameter updates are facilitated through the back-propagation algorithm. The specific procedure involves computing the discrepancy between the actual value (optimal network parameter) and the predicted value (anticipated network parameter) after every forward propagation cycle. This process helps us record the error. Subsequently, we calculate the reciprocal of each parameter in the single-layer RELU model. The parameter exhibiting the maximum derivative is then updated. The mathematical representation of this process is provided in the equations below:
The details of proposed scheme are concluded as follows in Algorithm 1.
Algorithm 1. Train the model and obtain the optimal parameters.
Input: Network traffic text log x
Output: Optimal number of network layers z
1: Word embedding x = embedding(x)
2: Get data characteristic statistical X, Y, Z = FT(x)
3: Predict the best network parameters: y′ = RELU(X, Y, Z)
4: Obtain the really best parameters through manual tuning through experiments: y
5: For y− < y0 and y0 is the error performance requirement
6: Calculationerror: y− = y − y′
7:
8: end for
9: Z = RELU(x)
In this section, we will delve into the handling of the Internet of Things (IoT) network traffic data that we confront.
Our data reveals that we have 273 data calling interfaces. To begin with, we construct a vocabulary of 273 dimensions, with each element corresponding to the call information of an individual API. Once this vocabulary is established, we obtain a map-ping from the API to the respective vector through the construction of a key-value pair data structure within the dictionary. This mapping serves as the mechanism to convert all API call information into vectors.
Following that, we employ a Deep Learning (DL) framework based on Pytorch to facilitate subsequent model training and testing. The previously constructed dataset is considered as the input for building our dataset object. The purpose of constructing this object is twofold. On one hand, it facilitates further processing on Pytorch. On the other, it allows us to add magic methods, which are methods that get triggered automatically under certain conditions without explicit calls, and common methods such as dictionary length checks during the construction process.
Lastly, for ease of dataset segmentation in subsequent use, we transform the processed data structure into a data loader via Pytorch. The primary goal of this transformation is to obtain objects that can be directly handed over to the neural network algorithm through the fit function.
Additionally, it allows for direct modifications of common neural network parameters during training. For instance, it can control whether the dataset is shuffled with each iteration, and it can determine the volume of data used for a single training session.
We approach the evaluation of our model from two distinct angles. The first is through the “loss” metric, depicted as follows:
where M represents the number of classifications, N denotes the number of samples in the test set, yij describes whether the i sample is category j (1 is yes, 0 is no), and Pij indicates the probability that the i is predicted to be category j.
Given the focus of this paper on abnormal flow detection, the importance of positive samples cannot be overstated. In many instances, identifying anomalies can account for up to 90% of the task at hand. Consequently, we employ the AUC (Area Under the Curve) as a secondary evaluation metric. It is calculated as follows:
In this formula, TP and TN symbolize the probabilities of correctly predicting positive and negative samples, respectively. Meanwhile, FP signifies the likelihood of predicting a positive sample incorrectly (i.e., a false positive), and FN refers to the probability of predicting a negative sample incorrectly (i.e., a false negative). Both of these metrics, loss and AUC, are assigned equal weight, each contributing 50% to the overall evaluation.
The primary aim of this study is to classify abnormal network traffic. We have collected and desensitized eight categories of real data from the internet. These categories include normal traffic and seven types of abnormal traffic: ransomware, cryptocurrency mining programs, DDoS, worm viruses, infectious viruses, backdoor software, and Trojan programs. Here’s a brief introduction to each type of abnormal traffic.
Ransomware, a unique malware, is often classified as an “access blocking at-tack” [32]. It differentiates itself from other viruses through its mode of manipulation and infection. Ransomware can either directly lock the victim’s computer or systematically encrypt files on the hard disk, rendering users unable to access their information without paying a ransom. They often masquerade as harmless files or typical links to lure people into downloading them.
Cryptocurrency mining programs have emerged with the increasing market value of cryptocurrencies such as Bitcoin. These programs silently use CPU resources for mining while hiding in various system processes, making them hard to detect.
DDoS attacks are types of denial of service attacks and are highly dependent on network conditions [33]. These attacks aim to incapacitate servers through an over-whelming amount of requests. Worm viruses can be subdivided into two types based on their objectives: denial of service viruses, which are similar to DDoS attacks, and viruses that run massive amounts of junk code. The defining feature of worm viruses is their ability to replicate and execute themselves without user intervention.
Infectious viruses can partition and encrypt their programs and attach them to various host programs. Their ability to latch onto multiple host programs at once makes them highly covert and destructive. Backdoor software, added to legitimate software, can steal user personal information or even remotely control the computer. These programs launch with the operating system startup and are difficult to detect.
Lastly, Trojan programs can pilfer local information or control rights through external influence [34]. While they do not self-replicate or infect other programs, they can result in serious consequences under the control of external personnel, such as destruction, file theft, and direct remote control of the computer.
The data we examine consists of five features, as outlined in Table 1. Files can have a large number of API calls; for training consistency, we record only the first 5000 calls for files with more than 5000 calls. There is no ordinal relationship between different thread tids. The index represents the global order of a single file’s execution in the sandbox. Hence, the same thread or different threads might execute the API multiple times, which does not ensure continuity.
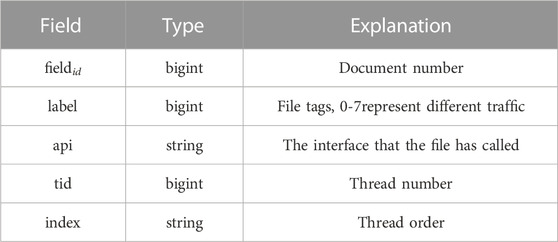
TABLE 1. Data features.
In an effort to offer a more intuitive understanding of the data we’re working with, we’ve presented the initial five rows of the dataset in Table 2. This extract illustrates that file 1 falls under the fifth category (infectious virus), having invoked the API Ldr-LoadDII once, and LdrGetProcedureAddress four times, all within the thread with an ID of 2488.
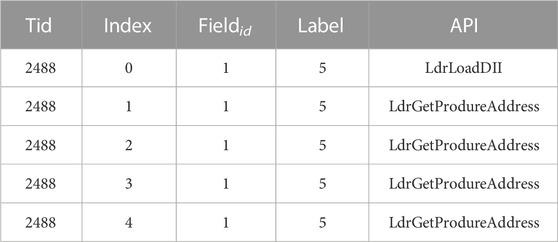
TABLE 2. First five lines of data.
To optimize our neural network model’s effectiveness, we’ve devised a systematic data partitioning strategy:
1. Stratified Sampling: Given the multiple categories in our dataset, some of which might be underrepresented, we employ stratified sampling. This ensures that the sample distribution of each category remains consistent across training, validation, and testing splits.
2. 70/15/15 Rule: We allocate 70% of the data for training, 15% for validation (for hyperparameter tuning and preventing overfitting), and the remaining 15% for final model evaluation.
3. 5-Fold Cross-Validation: To bolster model robustness and evaluation precision, we implement 5-fold cross-validation. For each fold, four parts are used for training and one for validation, ensuring each data point is validated against, enhancing our evaluation’s comprehensiveness.
For this study, we have chosen to use Pytorch [33], a leading deep learning framework that is widely popular in the field. Our hardware setup consists of a unique RTX3080 GPU display device with 32 GB of memory, supplemented by an I-9 Intel processor.
Our first step is to obtain the spectrum of the raw data, where all the data (including training and testing sets) is needed. After word embedding, the original IoT text data transforms into vectorized data and a collection of multiple vectorized data constitutes a matrix. As a matter of fact, the Fourier transform can directly compute and perform spectral analysis on two-dimensional matrix. Since our text data is also two-dimensional after vectorization, it can utilize the Fourier transform.
To directly investigate the influence of spectral distribution on neural network parameters, we embedded the vectorized data in different dimensions using the same preprocessing method. We specifically chose dimensions of 50, 100, 150, and 200. After this round of processing, we obtained different spectra for the same data (the dimension size of word embedding directly affects the results of the Fourier transform). If vectors with different spectra but the same raw data lead to different neural network fitting parameters, it means the Fourier transform can guide the choice of hyperparameters. Our experiment results of word embedding and spectra are shown in Figure 3.
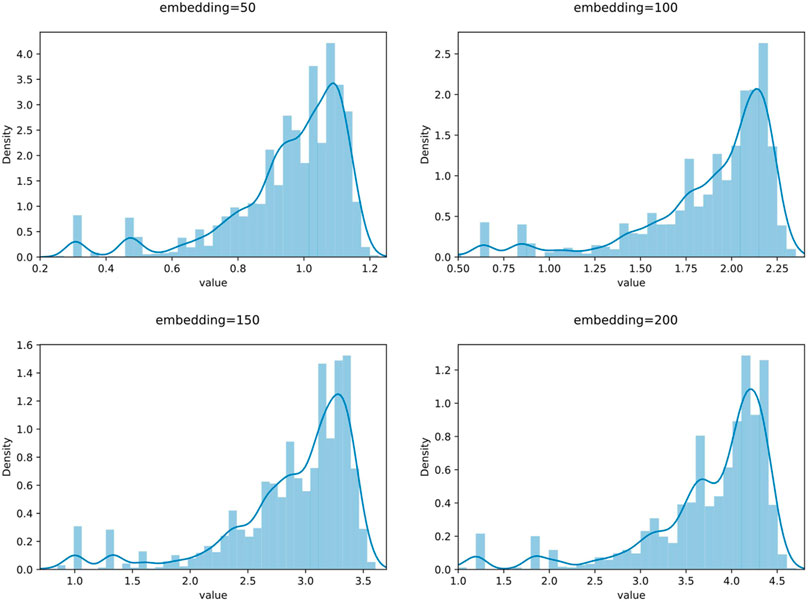
FIGURE 3. Frequency under different embedding.
We first used the MLP neural network to test our results. MLP is the original neural network, capable of fitting both linear and nonlinear relationships through data training. We used 70% of the data set for training the MLP and 30% of the training set for testing, employing a 5-fold cross-validation algorithm to obtain experimental results. The features of the dataset are specific activity information of network traffic, and the labels are the types of network traffic (such as ransomware, worm virus, normal traffic, etc.). After training and testing, we can determine the performance of the MLP with different parameters on this issue. We used logloss and AUC for evaluation.
Figures 4–7 show some of the experimental results (All the detailed experimental results can be found in the appendix), utilizing accuracy and loss to discern the network’s best parameters. The comparison across these four figures reveals that with the escalation of the word embedding layer (i.e., as the high-frequency components of the Fourier transform increase), the network’s optimal parameters also grow, and the degree of overfitting is generally lower in the final few data models. We record this outcome and train it in a straightforward single-layer neural network, discovering that as the spectrum doubles, the optimal network parameters also double, with a subsequent rise of approximately 10%. Through the MLP experiment on traffic classification, we validate our hypothesis: data bearing higher high-frequency components of the spectrum require more complex networks for learning.
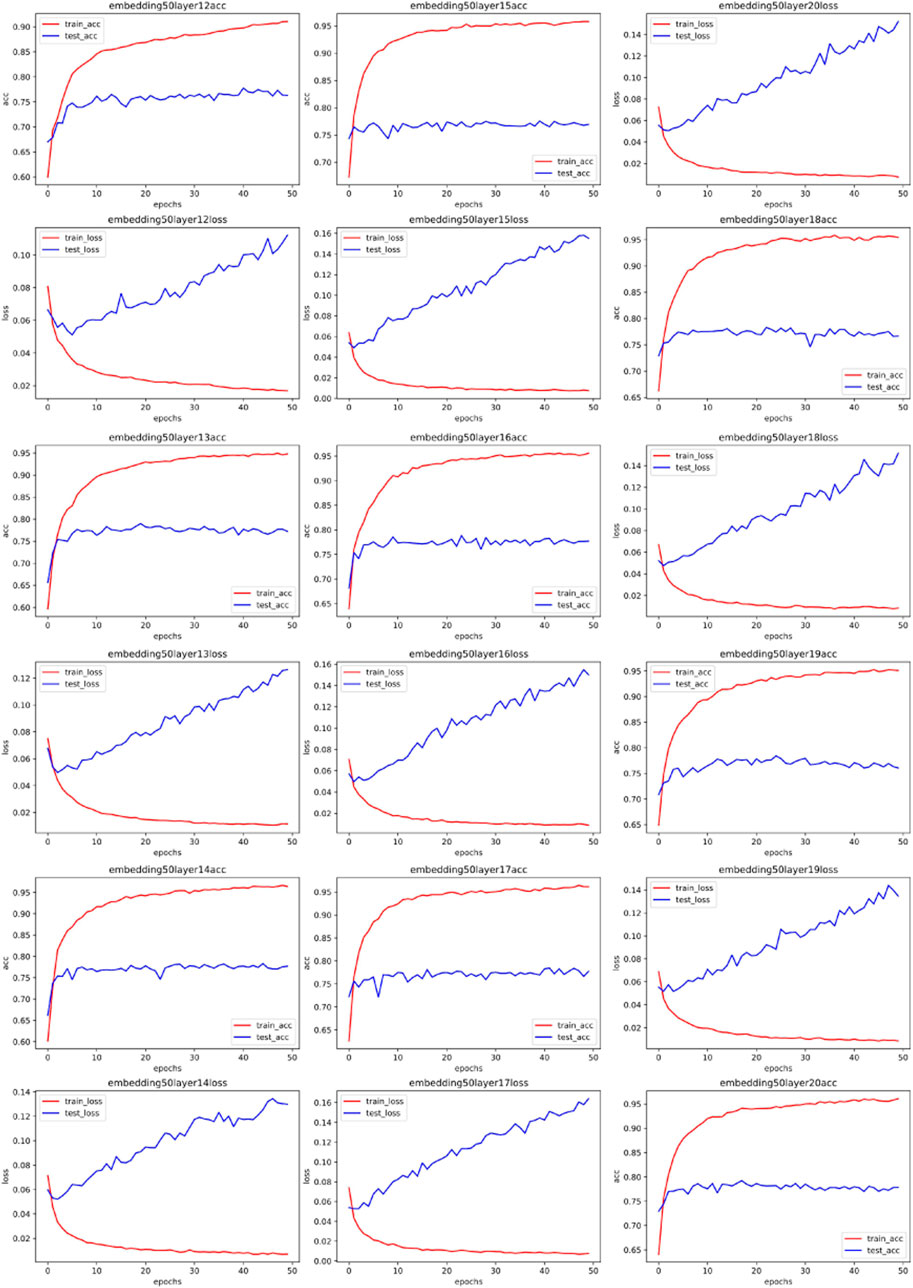
FIGURE 4. Training accuracy and corresponding loss with 50 MLP embedded.
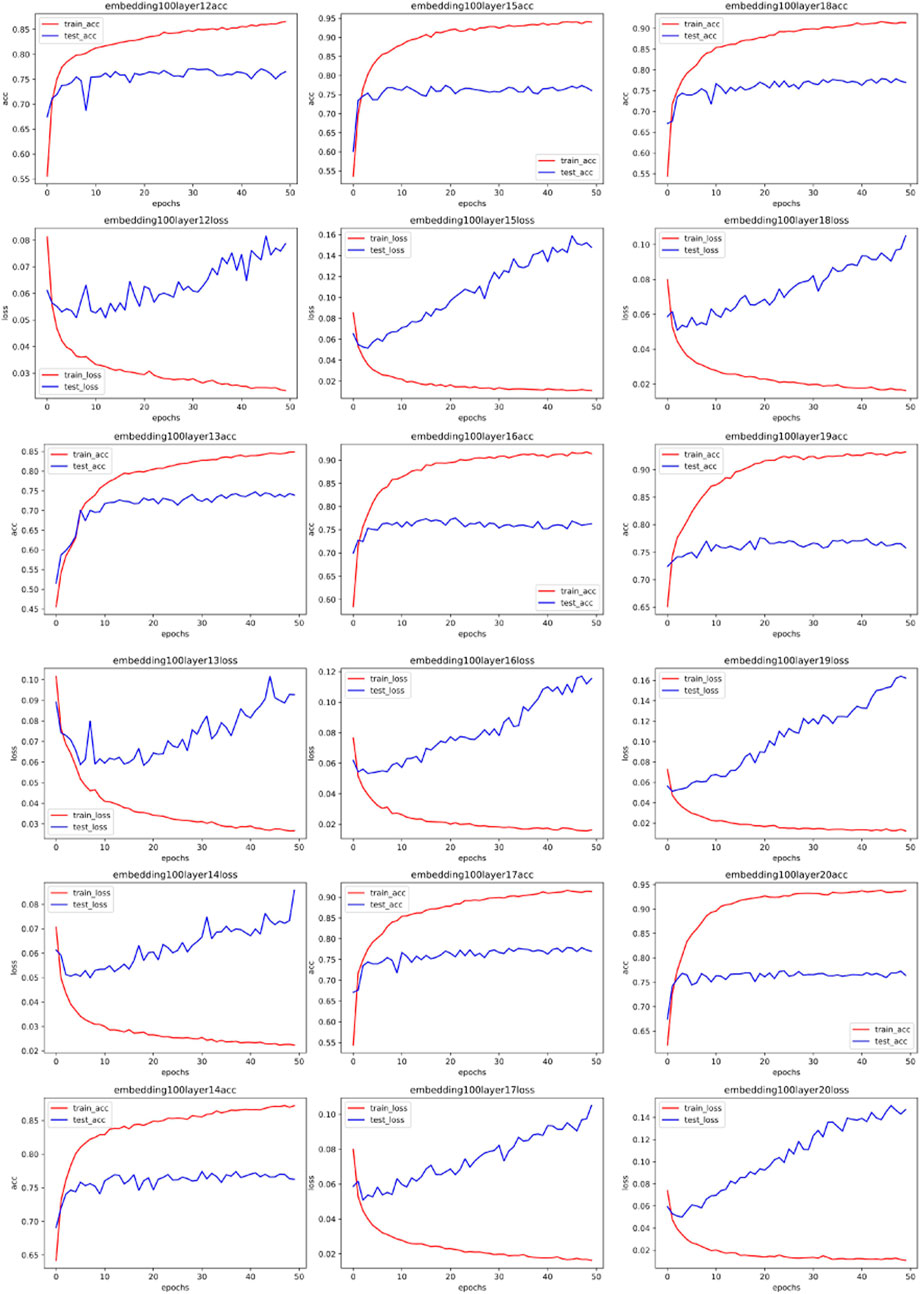
FIGURE 5. Training accuracy and corresponding loss with 100 MLP embedded.
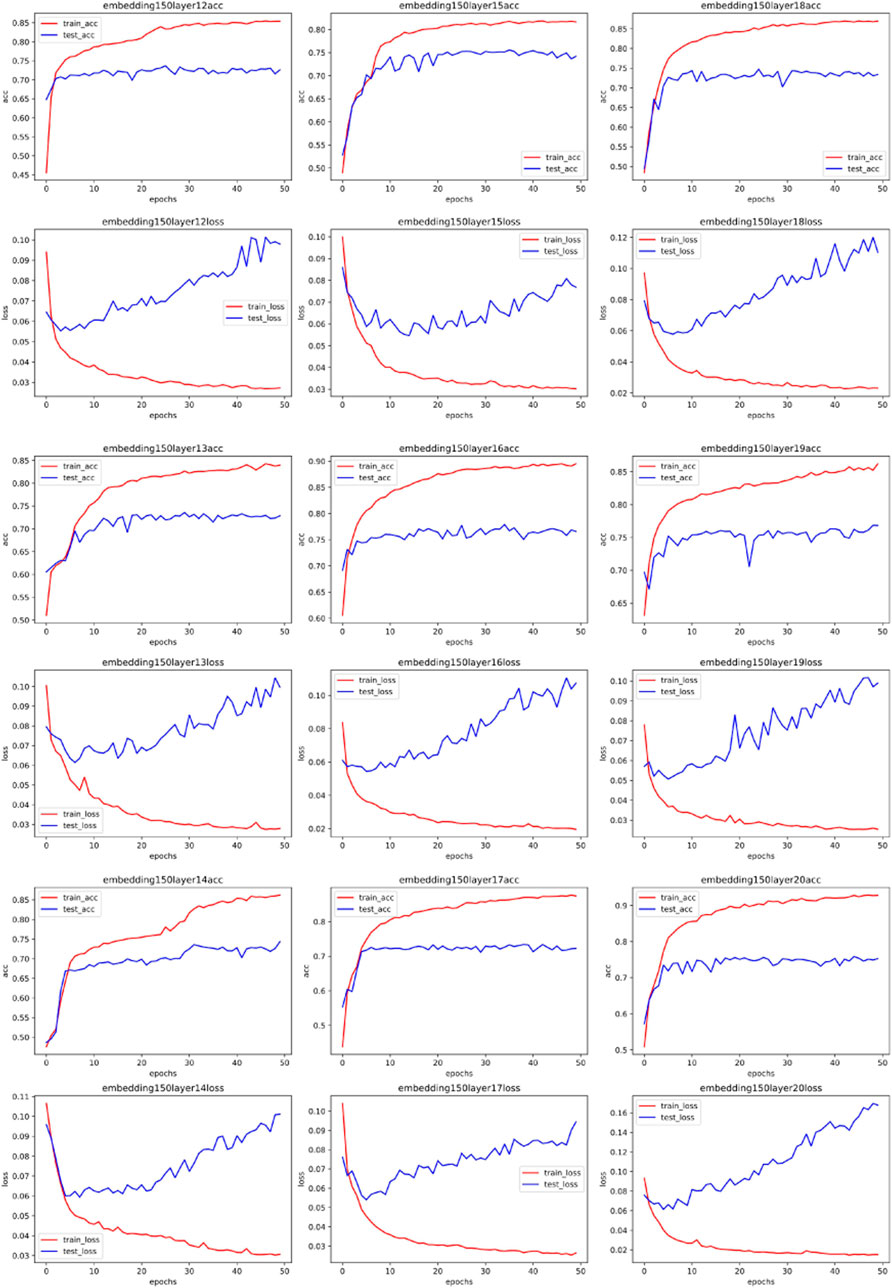
FIGURE 6. Training accuracy and corresponding loss with 150 MLP embedded.
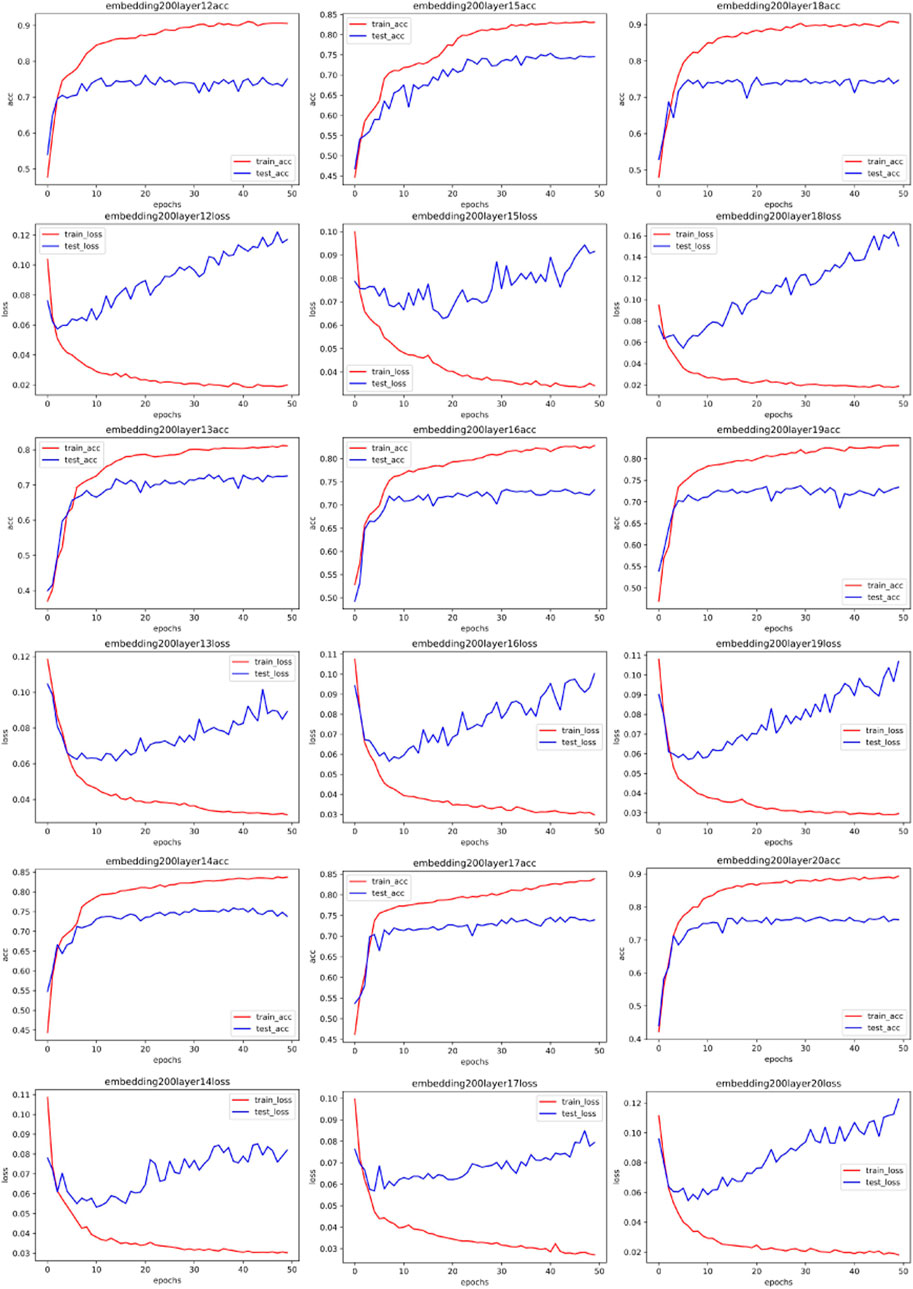
FIGURE 7. Training accuracy and corresponding loss with 200 MLP embedded.
Following this, we persist with experiments using a one-dimensional convolutional network. Contrary to typical CNNs that convolve in both length and width dimensions, a one-dimensional CNN only convolves in a single dimension. This approach is often employed in the field of natural language processing (NLP) [35]. This aligns with conventional understanding, given that language comprises individual words, and information can be captured by convolving along the word occurrence sequence. Convolution within a word holds no physical meaning. As our network traffic data has been transposed into text data, it becomes a natural language processing problem. Some experimental outcomes are illustrated in Figures 8, 9, 10, 11 through 11 (All the detailed experimental results can be found in the appendix).
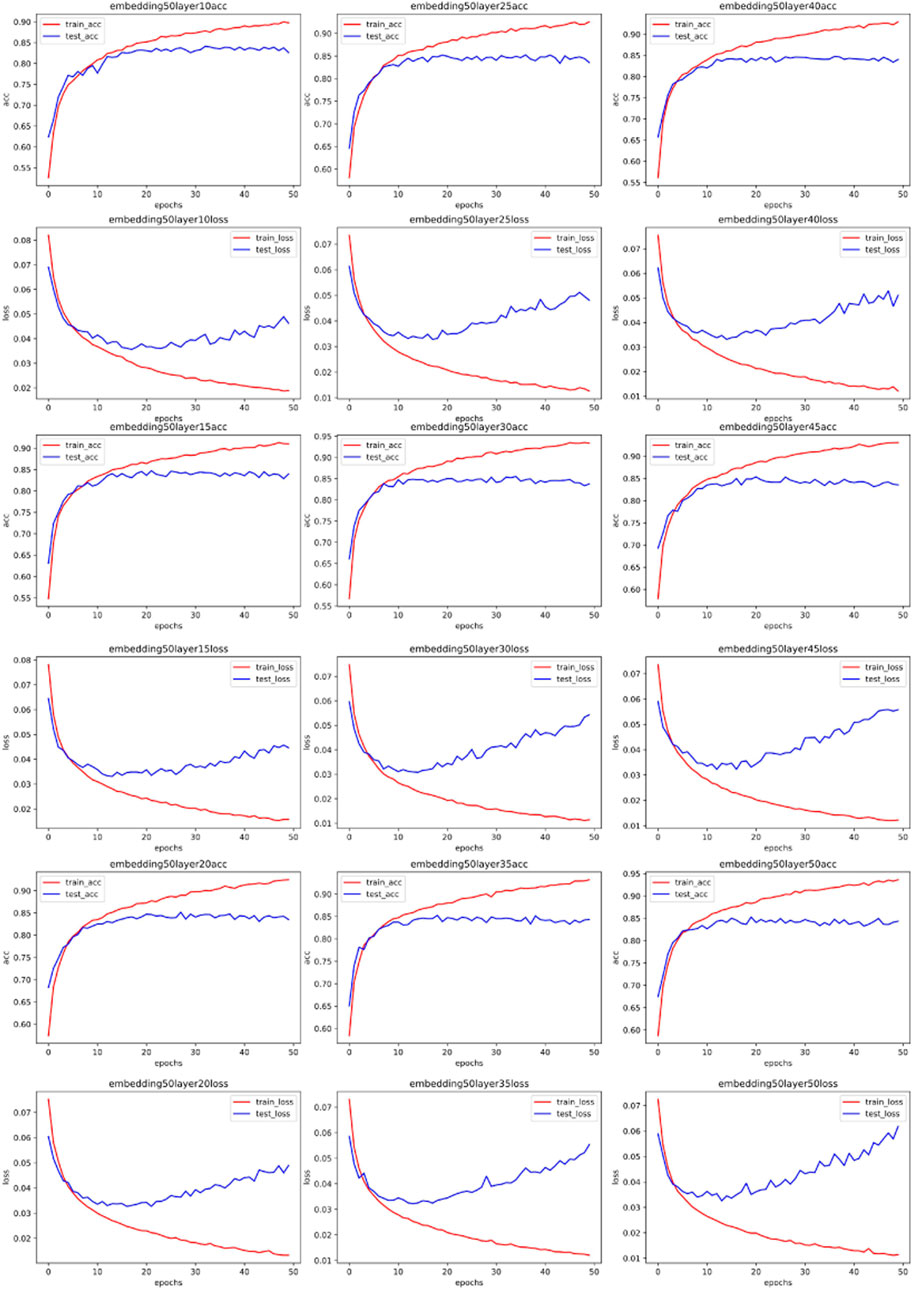
FIGURE 8. Training accuracy and corresponding loss with 50 CNN embedded.
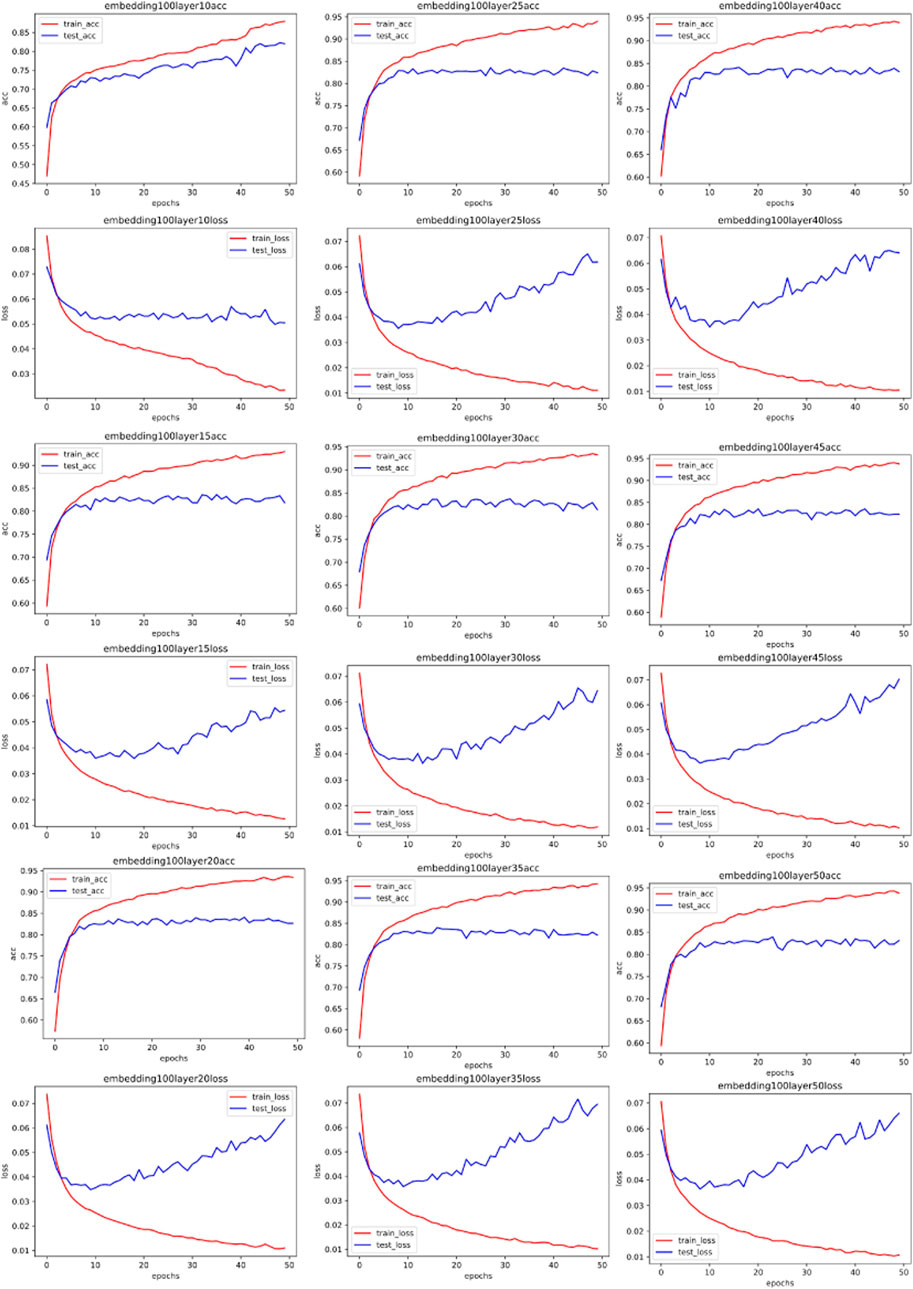
FIGURE 9. Training accuracy and corresponding loss with 100 CNN embedded.
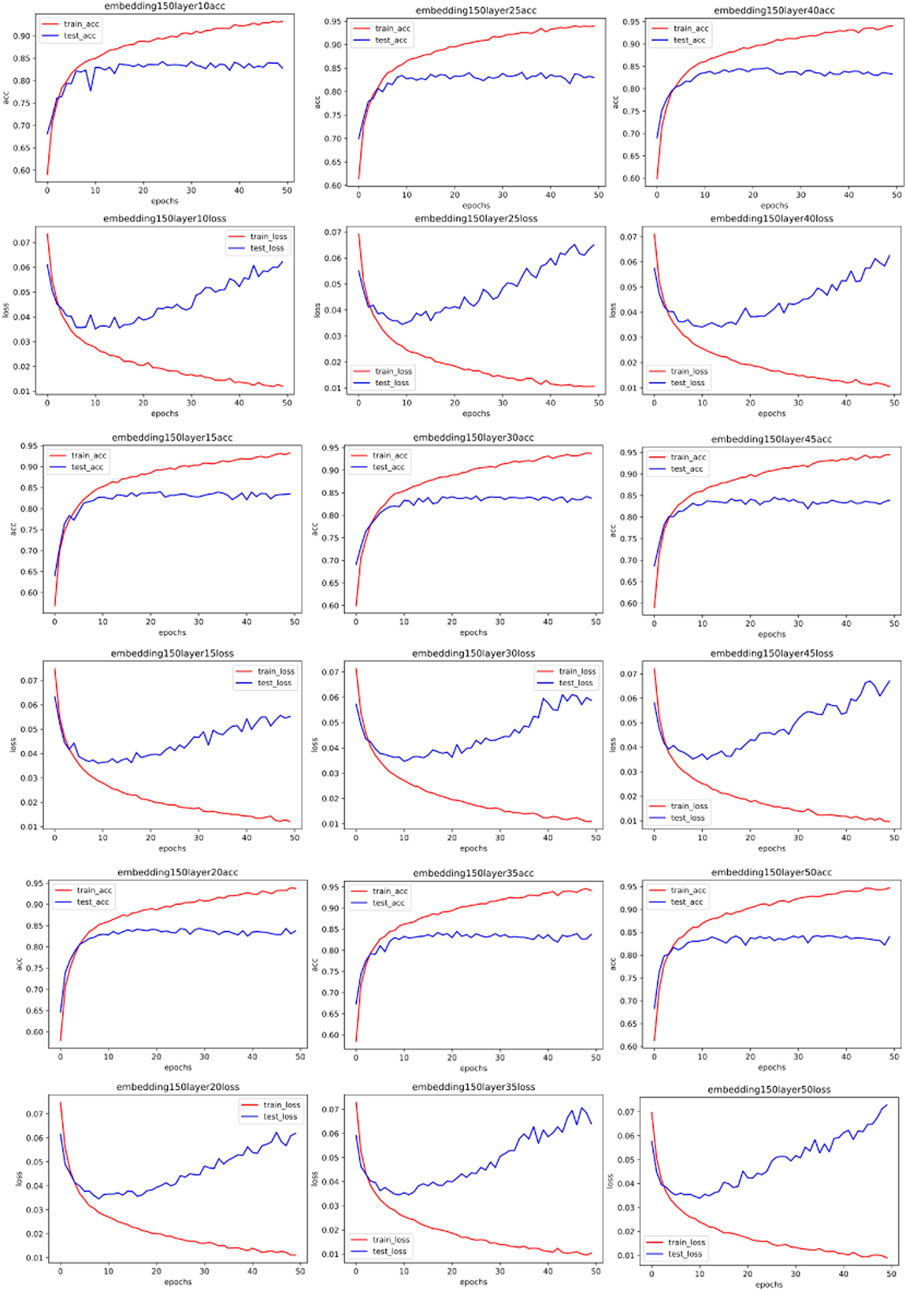
FIGURE 10. Training accuracy and corresponding loss with 150 CNN embedded.
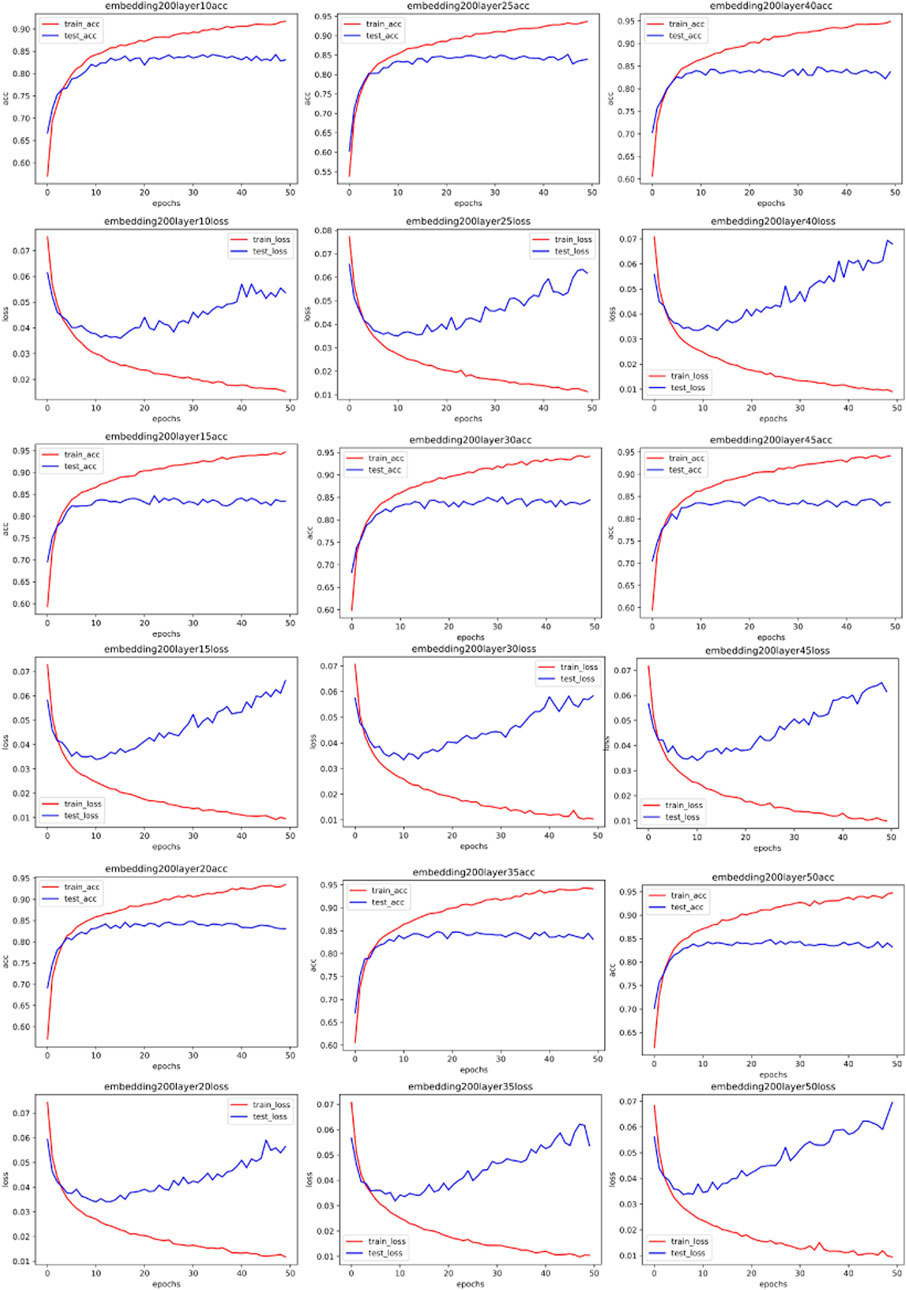
FIGURE 11. Training accuracy and corresponding loss with 200 CNN embedded.
Our simulation results reveal an unexpected pattern: unlike the MLP network, the optimal parameters for the one-dimensional CNN remain largely consistent across varying word embedding dimensions for the same dataset. This deviates from our hypothesis, which proposed that more complex spectral data could be harnessed by increasingly complex networks. Upon reflection, we understand this anomaly to be rooted in the nature of CNN’s convolutional process itself, which serves to smooth data and distill local information. This act of smoothing inherently attenuates the original data’s frequency. Given that our convolutional kernel size remains constant throughout all experiments, and the only variable being the number of network layers, the original data post-smoothing share identical spectrums. Consequently, the most fitting network layer count for the same data in a CNN scenario shows no significant variations.
Addressing the challenge of classifying abnormal traffic in the Internet of Things (IoT), this paper presents a novel optimization scheme for network parameter selection, which was devised through the analysis and processing of the spectrum of input samples. Our study reveals that for the Multi-Layer Perceptron (MLP) network, the complexity of the network model has a positive correlation with the spectrum of the input data. Conversely, for the Convolutional Neural Network (CNN), the smoothing effect of convolution operation leads to the word embedding having a less significant impact on the optimal model parameters when the input data exhibits high similarity.
Through rigorous simulations, we have validated the efficacy of our proposed schemes. These strategies have notably enhanced the efficiency and precision of ab-normal IoT traffic classification, indicating their immense potential for practical applications.
The insights from this research not only offer a new perspective for abnormal IoT traffic classification but also hold profound implications for the field at large. Looking ahead, we plan to explore the applicability of these methods to similar problems, with a view to further optimizing the strategies proposed herein.
The original contributions presented in the study are included in the article/Supplementary Materials, further inquiries can be directed to the corresponding author.
YX: Supervision, Writing–review and editing, Conceptualization, Data curation, Formal Analysis, Funding acquisition, Investigation, Methodology, Project administration, Resources, Software, Validation, Visualization, Writing–original draft. SD: Formal Analysis, Visualization, Writing–review and editing. RL: Writing–review and editing, Project administration. FS: Writing–review and editing, Data curation. XJ: Writing–review and editing, Investigation, Supervision, Validation.
The authors declare that no financial support was received for the research, authorship, and/or publication of this article.
The authors declare that the research was conducted in the absence of any commercial or financial relationships that could be construed as a potential conflict of interest.
All claims expressed in this article are solely those of the authors and do not necessarily represent those of their affiliated organizations, or those of the publisher, the editors and the reviewers. Any product that may be evaluated in this article, or claim that may be made by its manufacturer, is not guaranteed or endorsed by the publisher.
The Supplementary Material for this article can be found online at: https://www.frontiersin.org/articles/10.3389/fphy.2023.1273862/full#supplementary-material
1. Biersack E, Callegari C, Matijasevic M. Data traffic monitoring and analysis. In: Lecture notes in computer science. Berlin: Springer Science+Business Media (2013). p. 12561–70.
2. Ma Q, Sun C, Cui B, Jin X. A novel model for anomaly detection in network traffic based on kernel support vector machine. Comput Security (2021) 104:102215. doi:10.1016/j.cose.2021.102215
3. Rawat R, Mahor V, Chirgaiya S, Nath Shaw R, Ghosh A. Analysis of darknet traffic for criminal activities detection using TF-IDF and light gradient boosted machine learning algorithm. In: Innovations in electrical and electronic engineering. Singapore: Springer (2021). p. 671–81.
4. Müller B, Reinhardt J, Strickland MT. Neural networks: an introduction. Berlin: Springer Science & Business Media (1995).
5. Hinton GE, Salakhutdinov RR. Reducing the dimensionality of data with neural networks. science (2006) 313(5786):504–7. doi:10.1126/science.1127647
6. Krizhevsky A, Sutskever I, Hinton GE. ImageNet classification with deep convolutional neural networks. Commun ACM (2017) 60(6):84–90. doi:10.1145/3065386
7. Kattenborn T, Leitloff J, Schiefer F, Hinz S. Review on convolutional neural networks (CNN) in vegetation remote sensing. ISPRS J Photogrammetry Remote Sensing (2021) 173:24–49. doi:10.1016/j.isprsjprs.2020.12.010
8. Yu Y, Si X, Hu C, Zhang J. A review of recurrent neural networks: LSTM cells and network architectures. Neural Comput (2019) 31(7):1235–70. doi:10.1162/neco_a_01199
9. Liu G, Guo J. Bidirectional LSTM with attention mechanism and convolutional layer for text classification. Neurocomputing (2019) 337:325–38. doi:10.1016/j.neucom.2019.01.078
10. Han K, Xiao A, Wu E, Guo J, Xu C, Wang Y. Transformer in transformer. Adv Neural Inf Process Syst (2021) 34:15908–19. doi:10.48550/arXiv.2103.00112
11. Pouyanfar S, Sadiq S, Yan Y, Tian H, Tao Y, Reyes MP, et al. A survey on deep learning: algorithms, techniques, and applications. ACM Comput Surv (Csur) (2018) 51(5):1–36. doi:10.1145/3234150
12. Huang Y, Shen L, Liu H. Grey relational analysis, principal component analysis and forecasting of carbon emissions based on long short-term memory in China. J Clean Prod (2019) 209:415–23. doi:10.1016/j.jclepro.2018.10.128
13. Zhang B, Zhang S, Li W. Bearing performance degradation assessment using long short-term memory recurrent network. Comput Industry (2019) 106:14–29. doi:10.1016/j.compind.2018.12.016
14. Weinstein S, Ebert P. Data transmission by frequency-division multiplexing using the discrete fourier transform. IEEE Trans Commun Technol (1971) 19(5):628–34. doi:10.1109/tcom.1971.1090705
15. Abushariah MAM, Ainon RN, Zainuddin R, Elshafei M, Khalifa O. Natural speaker-independent Arabic speech recognition system based on Hidden Markov Models using Sphinx tools. In: International Conference on Computer and Communication Engineering (ICCCE’10); 11-12 May 2010; Kuala Lumpur, Malaysia. IEEE (2010). p. 1–6.
16. Dong S. Multi class SVM algorithm with active learning for network traffic classification. Expert Syst Appl (2021) 176:114885. doi:10.1016/j.eswa.2021.114885
17. Su MY. Using clustering to improve the KNN-based classifiers for online anomaly network traffic identification. J Netw Comput Appl (2011) 34(2):722–30. doi:10.1016/j.jnca.2010.10.009
18. Arivudainambi D, Varun Kumar KA, Visu P, Sibi Chakkaravarthy S. Malware traffic classification using principal component analysis and artificial neural network for extreme surveillance. Comput Commun (2019) 147:50–7. doi:10.1016/j.comcom.2019.08.003
19. Wang C, Xu T, Qin X. Network traffic classification with improved random forest. In: 2015 11th International conference on computational intelligence and security (CIS); 19-20 December 2015; Shenzhen, China. IEEE (2015). p. 78–81.
20. Javaid A, Niyaz Q, Sun W, Alam M. A deep learning approach for network intrusion detection system. In: Proceedings of the 9th EAI International Conference on Bio-inspired Information and Communications Technologies (formerly BIONETICS); 3-5 December 2015; New York City (2016). p. 21–6.
21. Tang TA, Mhamdi L, McLernon D, Ali Zaidi S, Ghogho M. Deep learning approach for network intrusion detection in software defined networking. In: 2016 international conference on wireless networks and mobile communications (WINCOM); 26-29 October 2016; Fez, Morocco. IEEE (2016). p. 258–63.
22. Sheikhan M, Jadidi Z, Farrokhi A. Intrusion detection using reduced-size RNN based on feature grouping. Neural Comput Appl (2012) 21(6):1185–90. doi:10.1007/s00521-010-0487-0
23. Marnerides AK, Schaeffer-Filho A, Mauthe A. Traffic anomaly diagnosis in Internet backbone networks: a survey. Computer Networks (2014) 73:224–43. doi:10.1016/j.comnet.2014.08.007
24. Buczak AL, Guven E. A survey of data mining and machine learning methods for cyber security intrusion detection. IEEE Commun Surv tutorials (2015) 18(2):1153–76. doi:10.1109/COMST.2015.2494502
25. Umer MF, Sher M, Bi Y. Flow-based intrusion detection: techniques and challenges. Comput Security (2017) 70:238–54. doi:10.1016/j.cose.2017.05.009
26. Mu J, Zhang R, Cui Y, Gao N, Jing X. UAV meets integrated sensing and communication: challenges and future directions. IEEE Commun Mag (2023) 61:62–7. doi:10.1109/mcom.008.2200510
27. Mu J, Ouyang W, Jing Z, Li B, Zhang F. Energy-efficient interference cancellation in integrated sensing and communication scenarios. IEEE Trans Green Commun Networking (2023) 7(1):370–8. doi:10.1109/tgcn.2023.3234404
28. Huang W, Zhang L, Wu H, Min F, Song A. Channel-Equalization-HAR: a light-weight convolutional neural network for wearable sensor based human activity recognition. IEEE Trans Mobile Comput (2022) 22:5064–77. doi:10.1109/TMC.2022.3174816
29. Ge Y, Zhu F, Chen D, Zhao R, Wang X. Structured domain adaptation with online relation regularization for unsupervised person Re-ID. IEEE Trans Neural Networks Learn Syst (2022) 1–14. doi:10.1109/tnnls.2022.3173489
30. Cheng D, Zhang L, Bu C, Wang X, Wu H, Song A. ProtoHAR: prototype guided personalized federated learning for human activity recognition. IEEE J Biomed Health Inform (2023) 27:3900–11. doi:10.1109/jbhi.2023.3275438
31. Yu W, Yalin Y, Haodan R. Research on the technology of trojan horse detection. In: 2019 12th International Conference on Intelligent Computation Technology and Automation (ICICTA); Oct. 26 2019-Oct. 27 2019; Xiangtan, China. IEEE (2019). p. 117–9.
32. Agrawal N, Tapaswi S. Defense mechanisms against DDoS attacks in a cloud computing environment: state-of-the-art and research challenges. IEEE Commun Surv Tutorials (2019) 21(4):3769–95. doi:10.1109/comst.2019.2934468
33. Landau HJ. Sampling, data transmission, and the Nyquist rate. Proc IEEE (1967) 55(10):1701–6. doi:10.1109/proc.1967.5962
34. Sun G, Fan J, Wu H. Research on blackmail virus defense based on multi-defender hybrid strategy. Int J Netw Security (2022) 24(1):83–91. doi:10.6633/IJNS.202201_24(1).10
Keywords: IoT, network traffic classification, deep learning, Fourier transform, hyperparameter optimization frontiers
Citation: Xiong Y, Dong S, Liu R, Shi F and Jing X (2023) IoT network traffic classification: a deep learning method with Fourier transform-assisted hyperparameter optimization. Front. Phys. 11:1273862. doi: 10.3389/fphy.2023.1273862
Received: 07 August 2023; Accepted: 02 October 2023;
Published: 16 October 2023.
Edited by:
Bo Rong, Communications Research Centre Canada (CRC), CanadaReviewed by:
Fuhong Min, Nanjing Normal University, ChinaCopyright © 2023 Xiong, Dong, Liu, Shi and Jing. This is an open-access article distributed under the terms of the Creative Commons Attribution License (CC BY). The use, distribution or reproduction in other forums is permitted, provided the original author(s) and the copyright owner(s) are credited and that the original publication in this journal is cited, in accordance with accepted academic practice. No use, distribution or reproduction is permitted which does not comply with these terms.
*Correspondence: Yiyang Xiong, anhpYW9qdW5AYnVwdC5lZHUuY24=
Disclaimer: All claims expressed in this article are solely those of the authors and do not necessarily represent those of their affiliated organizations, or those of the publisher, the editors and the reviewers. Any product that may be evaluated in this article or claim that may be made by its manufacturer is not guaranteed or endorsed by the publisher.
Research integrity at Frontiers
Learn more about the work of our research integrity team to safeguard the quality of each article we publish.