- 1School of Artificial Intelligence and Computer Science, Jiangnan University, Wuxi, China
- 2Autolink Information Technology Co., Ltd., Wuxi, China
Recently, the growth of blockchain technology and the economic benefits of cryptocurrencies have led to a proliferation of malicious cryptomining activities on the internet, resulting in significant losses for companies and institutions. Therefore, accurately detecting and identifying these behaviors has become essential. To address low accuracy in detecting and identifying cryptomining behaviors in encrypted traffic, a technique for identifying cryptomining behavior traffic is proposed. This technique is based on the time series characteristics of network traffic and introduces the feature of long-range dependence, and the recognition effect is not easily affected by the encryption algorithm. First, 48-dimensional features are extracted from the network traffic using statistical methods and the rescaled range method, of which 47 dimensions are statistical features and 1 dimension is a long-range dependence feature. Second, because there is much less cryptomining traffic information than normal network traffic information in the dataset, the dataset is processed using oversampling to make the two types of traffic data balanced. Finally, a random forest model is used to identify the type of traffic based on its features. Experiments demonstrate that this approach achieves good detection performance and provides an effective solution for identifying encrypted network traffic with malicious cryptomining behavior. The long-range dependence features introduced therein together with the statistical features describe a more comprehensive flow characteristics, and the preprocessing of the dataset improves the performance of the identification model.
1 Introduction
Recently, cryptocurrencies have been appreciating in value, and the trading market of cryptocurrencies has been growing. This results in increasingly negative impacts caused by cryptocurrencies. The high-performance computing resources required by cryptomining lead to large amounts of power consumption and environmental pollution [1–3]. Furthermore, many attackers hijack high-performance computers in networks to help them make illegal profits; malicious cryptomining has become one of the most common forms of cyberattacks [4].
A range of methods for identifying cryptomining activities exists, with the majority focusing on host-side detection [5–9]. This approach necessitates the manipulation of the host to achieve detection. The technique introduced by Carlin et al. [5] demands direct access to information concerning the host program’s operating environment for effective detection. In contrast, the method proposed by Azmoodeh et al. [10] involves accessing the hardware device’s operations, resulting in elevated deployment expenses and limited application possibilities. Conversely, network-based detection [11–13] offers advantages in terms of reduced deployment complexity and expanded application scenarios. Carprolu et al. [11] focus solely on basic statistical features, thereby creating challenges in achieving a comprehensive characterization of network traffic. In comparison, Veselý et al. [13] employ a blend of passive and active techniques for traffic identification, broadening the range of usage scenarios but concurrently introducing additional overhead to the identification process.
Cryptocurrency mining practices have shifted from centralized mining using much computing power to distributed mining using a distributed architecture with free computing power from many users on the internet, so malicious mining practices often require connecting to mining pools [14]. In addition, network companies and government agencies are currently fighting against malicious mining, so Stratum protocols using TLS (Transport Layer Security) encryption have been proposed in the cryptocurrency space to protect the communication between mining pools and miners. This makes it difficult for current malicious traffic detection systems using deep packet inspection technology to effectively identify malicious cryptomining behavior, so we need to use other characteristics of network traffic to effectively do so.
The analysis of the Stratum communication protocol shows that the communication process specified by this protocol has behavioral characteristics such as long connection time, small data volume, and frequent data exchange. These characteristics are different from the current major business traffic on the internet, such as file downloads and video browsing, and thus, the network traffic generated by the Stratum communication protocol used by the mining pool exhibits detectable differences in the temporal statistical characteristics. The method proposed in this paper is based on this understanding and detects and identifies network traffic by extracting temporal statistical features of network traffic that are not affected by encryption. It has been shown that traffic in real networks is long-range dependent [15, 16] and that the long-range dependence of the network is affected by abnormal traffic in normal network traffic [17, 18], so the Hurst exponent of this traffic is added to the temporal statistical characteristics of network traffic to indicate the long-range dependence characteristics of the traffic. Based on the above features of network traffic, network traffic generated by crypto mining behavior can be effectively identified.
In this paper, based on the network traffic characteristics of the communication protocols mentioned previously, we use the statistical properties of network traffic and long-range dependence (LRD) to identify cryptomining behavior.
The main contributions of this paper are as follows:
1) We create a dataset containing mining network traffic for different cryptocurrencies using different computational methods based on the CPUs and GPUs included. Moreover, the imbalance in the dataset is addressed using a Mahalanobis distance-based oversampling method.
2) To obtain more feature information with recognizable features, we introduce long-range dependence in the traffic characterization and combine it with temporal statistical features to represent the complete characterization of encrypted traffic.
3) We design a traffic identification method by extracting 48-dimensional feature data based on TCP (Transmission Control Protocol) flows, which represent the statistical characteristics and long-range dependence of the flows, and finally feeding the features into a random forest model for traffic identification.
The paper is structured as follows. In Section 2, we introduce related work in cryptomining detection. In Section 3, we analyze the characteristics of the communication patterns and protocol used for cryptocurrency mining. Section 4 describes the proposed feature extraction model and data preprocessing methods. Section 5 shows the experimental results. We present the conclusions of this paper in Section 6.
2 Related work
Many current scholars have conducted research on the identification of mining behavior. This research is mainly divided into host-based identification techniques and network-based identification techniques.
Carlin et al. [5] proposed a cryptomining detection method by analyzing dynamic opcodes, which can effectively detect fileless malicious cryptomining behavior based on browsers. Karn et al. [6] studied cryptomining identification in container clouds using system calls as features, which enables the detection of cryptomining behavior based on the aforementioned features because applications in containers are able to run hardware using system calls. Darabian et al. [7] used system calls and opcodes as features for detecting cryptomining behavior; they also used attention-based long short-term memory as a detection model. Gangwal et al. [8] used features in the processor and hardware performance counters for cryptomining behavior detection, and they used random forests and support vector machines as detection models. Zheng et al. [9] integrated different layers of features, such as byte features, PE structure features and mining operation execution features, into the detection model for cryptomining behavior detection. Azmoodeh et al. [10] used energy consumption for the detection of cryptomining behavior, using the fact that cryptomining behavior consumes more energy than other traffic because it requires a large amount of computational resources.
Such host-based identification methods are difficult to deploy for detecting and identifying the behavior of many network users. They are also costly, inefficient, and difficult to use on a large scale to govern cryptomining behavior. Researchers have therefore turned to network-based detection methods. Carprolu et al. [11] extracted a small number of statistical features from network traffic to detect cryptomining behavior. Pastor et al. [12] extracted more traffic features, such as the total number of packets, min–max survival time, and data bytes, to use as features and validated the effectiveness of this method on the generated traffic using models. Veselý et al. [13] created and maintained a database of fingerprint information, such as domain names and IPs of cryptomining pools, and extracted some data about network traffic features to passively detect network traffic and correct the detection results by active detection using the Stratum protocol. The network traffic features used in this method have difficulty fully characterizing the cryptomining behavior, and active detection, which requires high resource consumption, is needed to correct the detection results.
3 Mining communication protocol analysis
To delineate the nature of encrypted mining traffic, this section begins with a comprehensive depiction of the communication dynamics between the mining pool and the mining machine. Subsequently, we expound upon the methodology underlying the computation of the long-range dependency metric, along with the calculation of the Hurst exponent for network traffic generated during the mining of two distinct cryptocurrencies. Ultimately, our findings demonstrate the viability of utilizing temporal statistical attributes of traffic, coupled with the Hurst exponent, as discerning features for the purpose of traffic identification.
3.1 Analysis of the protocol communication process
Current mining pools for major currencies such as Bitcoin, Litecoin, and Ethereum typically use the Stratum protocol as the communication protocol between miners and mining pools. The protocol encapsulates message data based on the JSON (JavaScript Object Notation) format and sets up several different commands to make data exchange between the client and server efficient and reliable. Most mining pools currently support the use of TLS for data encryption in the Stratum protocol to improve data security and disguise encrypted mining of normal network traffic to avoid regulation.
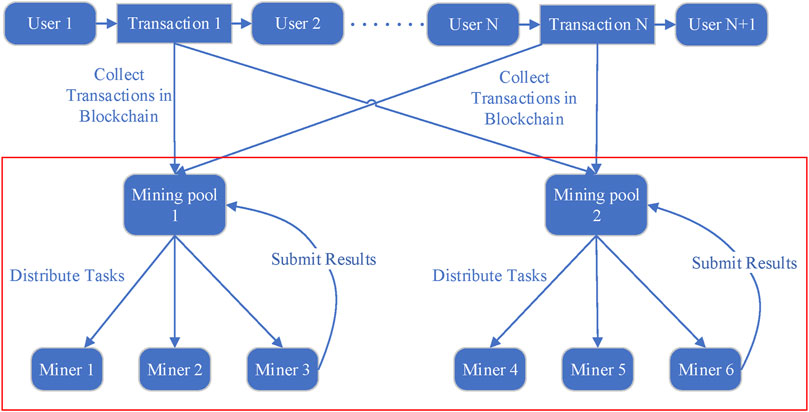
As shown in Figure 1, miners, pools, and users have different responsibilities in the mining process. The role of the mining pool is to collect transaction data from blockchain users and encapsulate it into new blocks. This information is then provided to the miners, who utilize their computing resources to determine the necessary target values. Once the calculations are complete, these results are transmitted back to the mining pool’s servers for a share of the reward. To understand the behavioral characteristics of the mining process, we analyze the interactions marked by the red boxes in Figure 1.
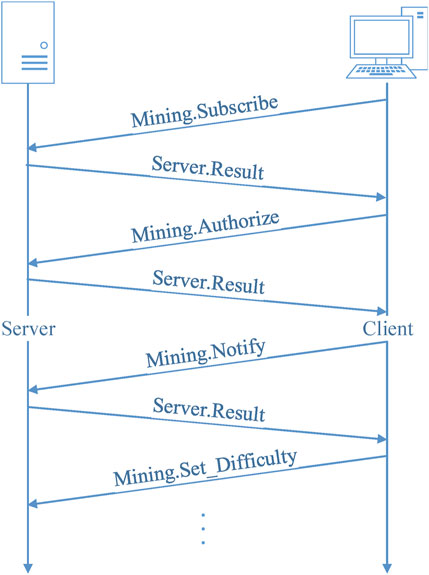
The communication behaviors of pool-based mining using the Stratum protocol are task subscription, task assignment, miner login, result submission, and difficulty adjustment, as shown in Figure 2.
The above communication flow shows that in the mining behavior of a miner, there will be frequent data exchanges between the miner and the pool. First, the miner’s parameters and information will be authorized by the pool, and then the pool will continuously send mining computation tasks to the miner, and the miner will complete the tasks and submit the results. We can extract temporal statistics from network traffic and extract key features as a basis for determining whether the traffic is mining behavior, such as the number of bits transmitted per second, the size of transmitted packets, the number of payload packets, the transmission idle time, and the transmission activity time. Therefore, this paper proposes a series of feature data that characterize network traffic. Since the feature data of the traffic generated by mining behaviors are not accurately judged based on individual statistical features, we extracted the behavioral feature data of network traffic exhibited in the time domain. Since network traffic has a long-term nature and exhibits certain temporal characteristics, the proposed feature extraction model can effectively extract the behavioral characteristics of network traffic for malicious mining behavior and identify that traffic.
3.2 Long-range dependence of the network traffic
In this section, we introduce the computation of the long-range dependence metric and compute the long-range dependence feature of the mining network traffic, which prepares for the subsequent proposal of the feature extraction method and provides experimental support for the introduction of the long-range dependence of the mining traffic.
3.2.1 Calculation of the long-range dependence metric
The long-range dependence of network traffic describes the correlation properties of network traffic, it is generally defined in terms of the autocorrelation function of a process.
Actual network traffic with long-range dependence is caused by many factors, such as network file characteristics and TCP congestion control. Meanwhile, actual network traffic with abnormal traffic usually affects the long-range dependence of network traffic [17, 18]; that is, the Hurst exponent can be used as the basis for abnormal traffic detection. Therefore, we use these data as feature data.
In practical calculations, obtaining accurate estimates of the Hurst exponent is more complicated. In real applications, we usually use the method of analyzing the data obtained in a limited time to estimate the Hurst exponent. We use the rescaled range (R/S) method to calculate the Hurst exponent of network traffic.
In this method, the time series is divided into N subseries of length M, where
where
Therefore, the slope of the curve obtained by fitting the calculated series of Rn/Sn values logarithmically is the value of the final Hurst exponent H.
3.2.2 Long-range dependence of communication traffic
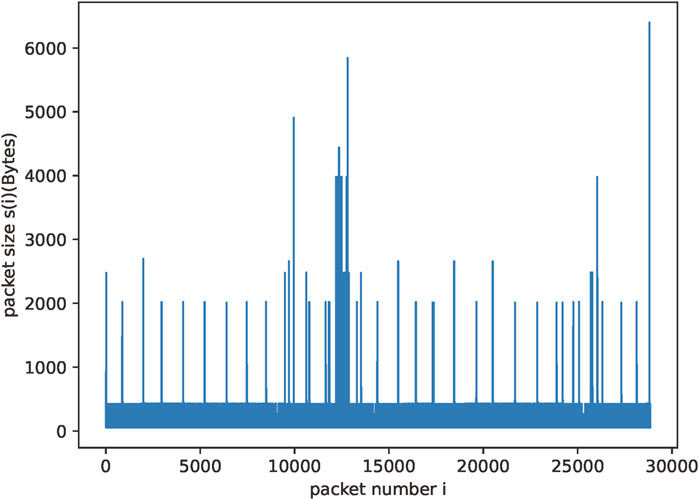
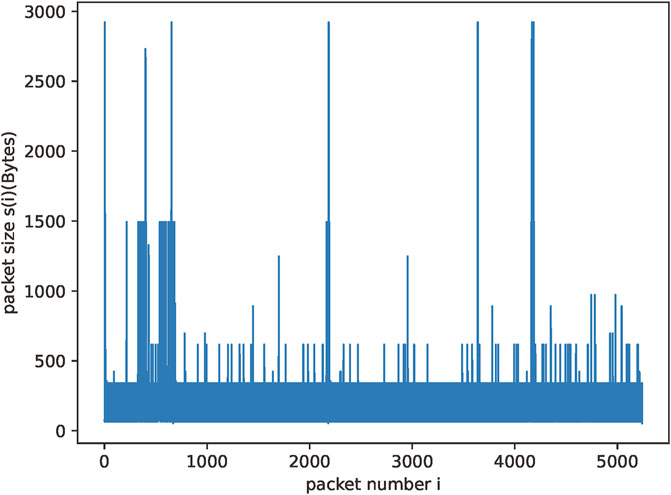
We analyze and calculate the mining behavior traffic of Ethereum and Monero based on our discarded traffic and obtain the overall long-range dependence they present. Figures 3, 4 show the traffic generated when cryptomining is performed for the two different cryptocurrencies.
We calculate the Hurst exponent for these two traffic flows by using Eqs 1, 2 from the previous section, i.e., R/S analysis. We obtain a Hurst exponent of 0.7072 for Monero coin mining traffic and 0.9121 for Ethereum mining traffic. From these data, we are able to determine that the traffic generated by mining behavior has significant long-range dependence, and we are also able to determine the characteristics of the overall behavior in the temporal features.
Cryptomining behavior generates network traffic with distinctive patterns due to its repetitive and consistent nature. The computational process involved in mining results in periodic spikes in traffic. These periodic spikes contribute a high degree of self-similarity in the traffic data. Therefore, the Hurst exponent of the mining traffic tends to be greater than 0.5. Normal traffic generated by regular network activities such as web browsing or file downloads typically does not exhibit the same level of regularity as cryptomining traffic. They tend to have more random and transient patterns. Consequently, the calculated Hurst exponent for normal traffic is different from the calculated Hurst exponent for cryptomining traffic. Therefore, we can use the Hurst exponent of the traffic as a dimension of the features in our identification method.
Because the two cryptocurrencies are computed using different mining algorithms, we assume that the connection characteristics to the server are different for both cryptocurrencies. The dataset used in this paper contains data generated by different mining algorithms using GPUs and CPUs, so it can show the different characteristics generated by different algorithms.
4 Network traffic identification method
4.1 Architecture
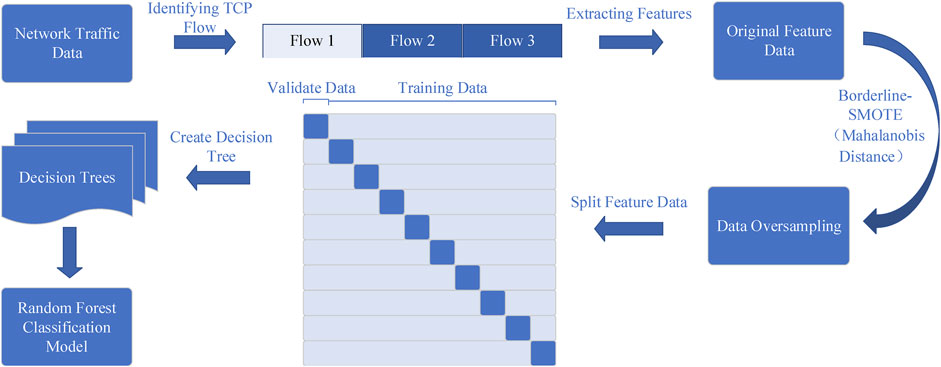
Figure 5 represents the overall flow of the proposed identification method for mining network traffic in this paper.
First, suitable network traffic data are collected, categorized and organized, and then each TCP flow is parsed individually by parsing the TCP data in the traffic packet to obtain its statistical feature data in the time domain and the corresponding Hurst exponent and finally exported to a feature data file. Then, a data oversampling operation is performed on the original dataset to ensure that there is no category imbalance in the final used dataset. Finally, the generated dataset is divided, and the performance metrics of the random forest classification model on the dataset are tested by the ten-fold cross-validation method.
4.2 Feature data extraction
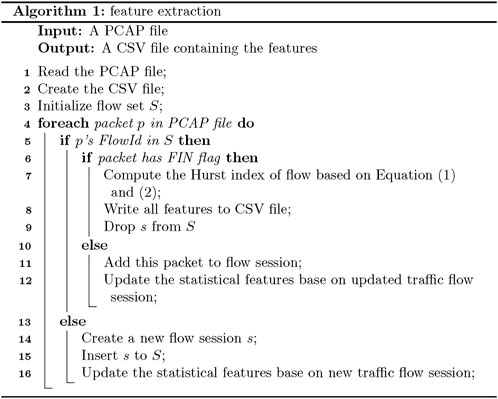
After collecting the required data samples, they have to be converted from the PCAP file format of the network packets to the digital input required by the classification algorithm, i.e., CSV (Comma-Separated Values) files, which store the tabular data in plain text and can be used very easily for analyzing, importing, and exporting the data. Since the contents of network packets are traffic encrypted by TLS, classifying the traffic features by network traffic payload is difficult. Extracting the statistical information of the transport layer in the packets can help effectively eliminate misleading information about TLS encryption on traffic classification.
The specific extraction process is as follows:
A TCP flow is used as the basic unit, taking the FIN flag as the end of the flow. The flow-related statistical features are extracted with FlowID, which is composed of the source address, destination address, protocol number, etc., as the flow flag. The extraction process is presented in Figure 6.
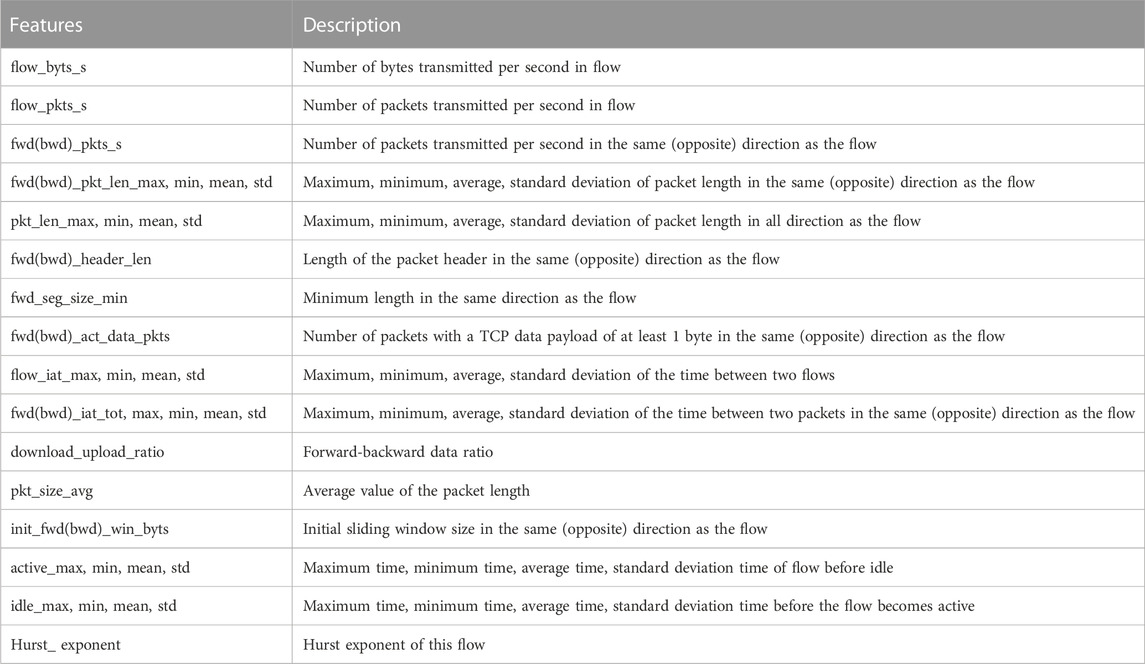
The time series characteristics of network traffic generated by mining behavior have some degree of difference from those of normal network traffic, but detecting this difference by the time series characteristics data of a particular network traffic alone is difficult. Therefore, we need to include feature data that describe the time series characteristics of network traffic as comprehensively as possible in the detection algorithm. In the proposed feature data extraction model, we extract data including the number of packets transmitted per second in the network traffic, the bit rate in the network stream, the Hurst exponent of the network traffic, the packet size in different directions of the TCP connection, the packet header size, the packet arrival interval, statistical data of idle time, and the active time of the connection. The feature data we extracted for identification are shown in Table 1.
4.3 Data preprocessing and model training
In this section, we first use the oversampling technique to address the imbalanced dataset, and then we use the generated dataset to train a random forest model for traffic identification.
Oversampling techniques are commonly used to address data imbalance problems in machine learning. The malicious mining behavior studied in this paper is much smaller than normal network traffic; if the collected data are directly used to train a classification model, the model can easily overfit the learning of most samples and still obtain a single classification result due to the excessive number of some samples as long as the classification model outputs a single classification result.
In this paper, the Borderline SMOTE (Synthetic Minority Over Sampling Technique) algorithm [19] is chosen to oversample the processed feature data. The Borderline SMOTE algorithm is an improved version of the SMOTE algorithm [20]. The SMOTE algorithm is based on a few classes of sample points generating new data points: first, the minority class sample points are found, its k similar sample points are searched, and a new sample point is generated randomly between the sample point and its immediate neighbors. The Borderline SMOTE algorithm increases the sample point selection strategy by classifying the minority class samples into danger, safe and noise classes, where the danger class represents the samples. The algorithm performs oversampling operations only on sample points of the danger class, and the algorithm assumes that samples of this type of edge can provide more effective information for the classification model to obtain better classification results.
The Borderline-SMOTE algorithm usually uses Euclidean distance to calculate the nearest neighbors of sample points. However, in the network traffic feature data studied in this paper, the feature space has 48 dimensions, and accurately expressing the Euclidean distance between sample points in a high-dimensional space is difficult. Therefore, we choose the Mahalanobis distance to measure the distance between sample points. This distance is calculated based on the overall sample and performs better on high-dimensional features than Euclidean distance does. The formula for calculating the Mahalanobis distance is as follows:
D represents the Mahalanobis distance, S is the covariance matrix of the dataset, and (X-Y) represents the difference between two points. The Mahalanobis distance can effectively identify abnormal points in the dataset, so it is suitable for the characteristics of the dataset studied in this paper.
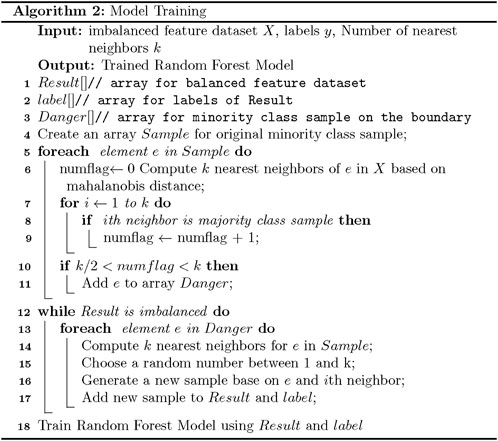
After oversampling, we use this dataset for model training, as shown in Figure 7. The random forest algorithm [21] is a commonly used classification algorithm model that can effectively perform the classification task even on unbalanced datasets, is not affected by missing values in the data and has good generalization ability. We use this algorithm to train the classification model after completing feature extraction and data oversampling and to verify its performance.
To ensure the balance between the algorithm and the overhead of the model, the random forest algorithm used in this paper is set to use 100 decision tree models to form a random forest. To ensure that the model can learn the complete data information for classification, the number of features selected to generate decision trees is set to the maximum number of features.
To validate the model performance, we use tenfold cross-validation during training by dividing the entire dataset into ten parts; nine of these parts are used for training the model, and one is used to validate the model performance. We then replace the validation set and repeat the training ten times. This validation method can more accurately verify the model performance by using all the data in the dataset for testing and training.
5 Experiment
5.1 Data collection and preprocessing
Since no cryptomining traffic dataset is available on the internet for experiments, we need to collect traffic data, extract features from the collected data, extract time series features from traffic sequences, clean the features and wait for them to be read by the detection algorithm.
5.1.1 Data collection
The WSL2-based Ubuntu virtual machine environment was built, and the CUDA on WSL2 driver support enabled the virtual machine to call physical machine graphics resources to meet the requirements of the mining software. The mining software was used to connect to the online mining pool to collect encrypted mining traffic based on the Stratum protocol, and Tcpdump and Wireshark were used to capture the network traffic packets.
We use xmrig1 to collect Monero mining traffic and lolMiner2 to collect Ethereum mining traffic. For normal web surfing traffic, we use the publicly available ISCXTor2016 dataset [22], in particular the non-Tor portion of the network traffic, including web browsing, chat, file transfer, etc. Table 2 shows the final datasets we construct.
5.1.2 Data preprocessing
We first construct the KNN (K-Nearest Neighbor) [23] model using the Mahalanobis distance as a metric. We then input the data into the model, calculate the 5 nearest neighbors of the sample points in the feature space, and divide the points into danger, safe, and noise classes according to the number of sample point types around the few sample points. Finally, we generate new sample points based on the danger sample points to complete the data oversampling.
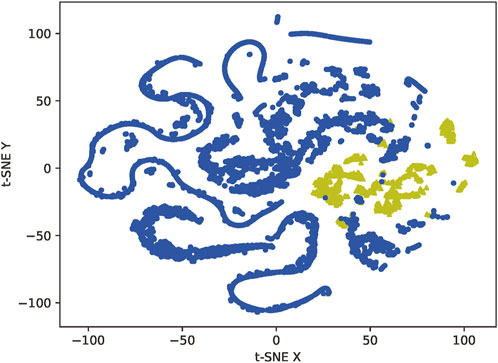
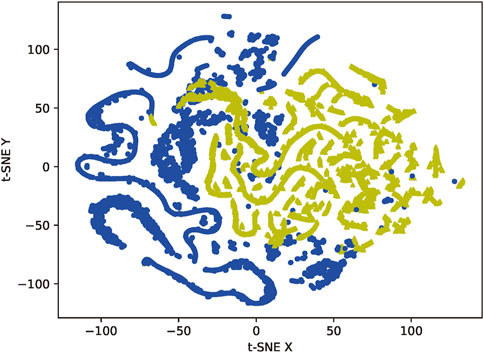
Figures 8, 9 represent the results of data oversampling. The data visualization uses the T-SNE dimensionality reduction algorithm, which reduces the sample points in the 48-dimensional space to a 2-dimensional space that can be directly observed through a probabilistic model, consisting of two main features t-SNE X and t-SNE Y. Due to the characteristics of the dimensionality reduction algorithm, we can only use the results of its dimensionality reduction for visual observation of the distribution characteristics of the data, not as a basis for classification.
5.2 Experimental results
After collecting the experimental data and extracting the feature values as described before, we use the random forest algorithm to evaluate the feature data of the network traffic we obtained. We compare the results of this evaluation with the network traffic feature data obtained by other different feature extraction methods after the same detection algorithm. These results demonstrate that our network data feature extraction model is feasible for the practical application of cryptomining traffic detection.
5.2.1 Evaluation metrics
Before describing the evaluation metrics, four sample-related data, TP, FP, FN, and TN, must be described. Assuming a dichotomous classification problem with positive and negative classification results, TP indicates a correct classification as positive; FP indicates a misclassification as positive; FN indicates a misclassification as negative; and TN indicates that the correct classification is negative. This is shown in Table 3.
5.2.1.1 Accuracy
Accuracy, which indicates the percentage of the number of correct classifications among all classification results, is mathematically described as follows.
5.2.1.2 Precision
Precision, which indicates the ratio of the number of samples correctly classified as positive to the number of all samples classified as positive, is mathematically described as follows.
5.2.1.3 Recall
Recall is similar to precision and is also a criterion for a classification result. Recall, which generally refers to the ratio of the number of samples correctly classified as positive to the total number of samples that should be classified as positive, is mathematically described as follows.
5.2.1.4 F1
Recall and precision are mutually influential. Ideally, we would achieve a high value for both, but generally, when one of them is high, the other will be low. When both need to be at a high value, this is evaluated by F1, which is the summed average of precision and recall, mathematically described as follows.
5.2.2 Feature model performance enhancement experiments
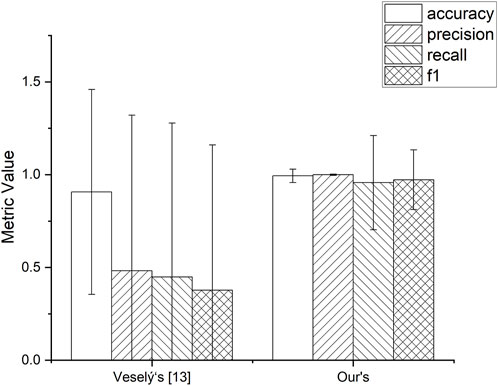
We conducted a comparison experiment using the network traffic features obtained from our feature extraction model and the 9-dimensional network traffic features used in Veselý’s paper [13]. Both models for the experiment used the random forest classification model, the performance metrics in the experimental results were obtained by the ten-fold cross-validation method, and the final experimental results were shown by the performance metrics with the error.
Figure 10 shows that the proposed feature extraction model significantly improves the recall index along with other performance metrics, and the error value in ten-fold cross-validation is also lower for our method. This is enough to prove that our proposed recognition technique is effective and improves usability in traffic detection mining based on network traffic features.
5.2.3 Performance enhancement experiments of the oversampling method
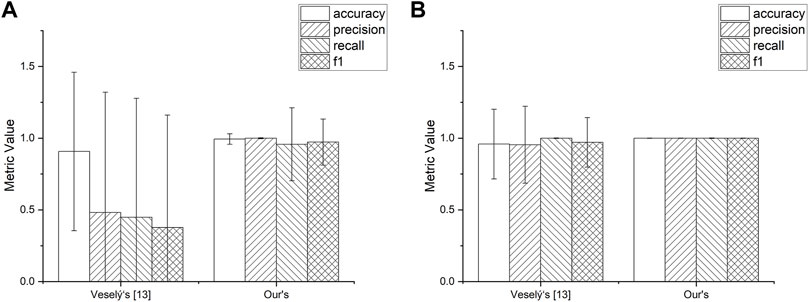
After testing the improved performance of our feature extraction model in detecting malicious mining behavior, we experimentally tested the impact of oversampling the dataset on the performance of the final classification model. We obtained the experimental results by oversampling the current dataset before training the model using the Borderline SMOTE algorithm based on the Mahalanobis distance and finally using ten-fold cross validation.
The results in Figure 11 show that the classification stability of the classification model can be effectively improved after oversampling the dataset, but the large increase in the performance of the feature model proposed in Veselý’s article may be because the model produces a certain amount of overfitting because of its small number of feature dimensions and the small variation in the feature values, which produces many similar data points after oversampling. This is because adding more valid information to the training dataset enables the classification model to learn more types of features, so the error values in the experiment are reduced, reflecting the improved stability of the classification model, but the size of the oversampling needs to be carefully controlled as well as the method to avoid overfitting of the model.
6 Conclusion
By extracting the statistical features of time series information in network traffic and balancing the imbalanced data, we can effectively determine the relationship between data points hidden in network traffic and distinguish encrypted network traffic generated by cryptomining practices from normal network traffic.
The identification performance can be further improved by acquiring more kinds of cryptocurrencies and traffic generated by normal network traffic and by reducing the computational complexity of data preprocessing to cope with more low-computing power edge devices. Moreover, communication protocols for cryptomining are constantly modified and updated, requiring the traffic data to be constantly updated to maintain identification accuracy.
Data availability statement
The original contributions presented in the study are included in the article/Supplementary Material, further inquiries can be directed to the corresponding author.
Author contributions
LD: Writing–original draft, Writing–review and editing, Investigation, Methodology, Validation. ZL: Writing–review and editing, Resources, Supervision. XL: Writing–review and editing, Resources, Supervision. XW: Writing–review and editing, Funding acquisition, Project administration, Supervision. YL: Project administration, Resources, Supervision, Writing–review and editing.
Funding
The author(s) declare financial support was received for the research, authorship, and/or publication of this article. The work is supported by the National Natural Science Foundation of China (Grant Nos 62172191 and 61972182) and the National Key R&D Program of China (Grant No. 2016YFB0800305).
Conflict of interest
Authors ZL and XL were employed by Autolink Information Technology Co., Ltd.
The remaining authors declare that the research was conducted in the absence of any commercial or financial relationships that could be construed as a potential conflict of interest.
Publisher’s note
All claims expressed in this article are solely those of the authors and do not necessarily represent those of their affiliated organizations, or those of the publisher, the editors and the reviewers. Any product that may be evaluated in this article, or claim that may be made by its manufacturer, is not guaranteed or endorsed by the publisher.
Footnotes
1XMRig (2017). https://github.com/xmrig/xmrig (Accessed 24 Mar 2023).
2lolMiner (2018). https://github.com/Lolliedieb/lolMiner-releases (Accessed 28 Feb 2022).
References
1. Goodkind AL, Jones BA, Berrens RP. Cryptodamages: Monetary value estimates of the air pollution and human health impacts of cryptocurrency mining. Energ Res Soc Sci (2020) 59:101281. doi:10.1016/j.erss.2019.101281
2. Pastrana S, Suarez-Tangil G. A first look at the crypto-mining malware ecosystem: A decade of unrestricted wealth. In: Proceedings of the Internet Measurement Conference; Amsterdam, Netherlands: Association for Computing Machinery (2019). p. 73–86. doi:10.1145/3355369.3355576
3. Siddik MAB, Amaya M, Marston LT. The water and carbon footprint of cryptocurrencies and conventional currencies. J Clean Prod (2023) 411:137268. doi:10.1016/j.jclepro.2023.137268
4. Zimba A, Wang Z, Mulenga M, Odongo NH. Crypto mining attacks in information systems: An emerging threat to cyber security. J Comput Inf Syst (2018) 60(4):297–308. doi:10.1080/08874417.2018.1477076
5. Carlin D, O’kane P, Sezer S, Burgess J. Detecting cryptomining using dynamic analysis. In: 2018 16th Annual Conference on Privacy, Security and Trust (PST); 2018 Aug 28; Belfast, Ireland. IEEE (2018). p. 1–6. doi:10.1109/PST.2018.8514167
6. Karn RR, Kudva P, Huang H, Suneja S, Elfadel IM. Cryptomining detection in container clouds using system calls and explainable machine learning. IEEE Trans parallel distributed Syst (2020) 32(3):674–91. doi:10.1109/TPDS.2020.3029088
7. Darabian H, Homayounoot S, Dehghantanha A, Hashemi S, Karimipour H, Parizi RM, et al. Detecting cryptomining malware: A deep learning approach for static and dynamic analysis. J Grid Comput (2020) 18:293–303. doi:10.1007/s10723-020-09510-6
8. Gangwal A, Piazzetta SG, Lain G, Conti M. Detecting covert cryptomining using hpc. In: Cryptology and Network Security: 19th International Conference, CANS 2020; December 14–16, 2020; Vienna, Austria (2020). doi:10.1007/978-3-030-65411-5_17
9. Zheng R, Wang Q-Y, Lin Z-P, Jing R-Q, Jiang Z-W, Fu J-M, et al. Cryptojacking malware hunting: A method based on ensemble learning of hierarchical threat intelligence feature. ACTA ELECTONICA SINICA (2022) 50(11):2707. doi:10.12263/DZXB.20211333
10. Azmoodeh A, Dehghantanha A, Conti M, Choo K-KR. Detecting crypto-ransomware in IOT networks based on energy consumption footprint. J Ambient Intelligence Humanized Comput (2018) 9:1141–52. doi:10.1007/s12652-017-0558-5
11. Caprolu M, Raponi S, Oligeri G, Di Pietro R. Cryptomining makes noise: Detecting cryptojacking via machine learning. Comput Commun (2021) 171:126–39. doi:10.1016/j.comcom.2021.02.016
12. Pastor A, Mozo A, Vakaruk S, Canavese D, López DR, Regano L, et al. Detection of encrypted cryptomining malware connections with machine and deep learning. IEEE Access (2020) 8:158036–55. doi:10.1109/ACCESS.2020.3019658
13. Veselý V, Žádník M. How to detect cryptocurrency miners? By traffic forensics. Digital Invest (2019) 31:100884. doi:10.1016/j.diin.2019.08.002
14. Wang C, Chu X, Qin Y. Measurement and analysis of the Bitcoin networks: A view from mining pools. In: 2020 6th International Conference on Big Data Computing and Communications (BIGCOM). IEEE (2020). doi:10.1109/BigCom51056.2020.00032
15. Paxson V, Floyd S. Why we don't know how to simulate the internet. In: Proceedings of the 29th conference on Winter simulation; Atlanta, Georgia, USA. IEEE Computer Society (1997). p. 1037–44. doi:10.1145/268437.268737
16. Li M, Zhao W, Jia W, Long D, Chi C-H. Modeling autocorrelation functions of self-similar teletraffic in communication networks based on optimal approximation in hilbert space. Appl Math Model (2003) 27(3):155–68. doi:10.1016/S0307-904X(02)00087-2
17. Li M. An approach to reliably identifying signs of DDOS flood attacks based on LRD traffic pattern recognition. Comput Security (2004) 23(7):549–58. doi:10.1016/j.cose.2004.04.005
18. Li M. Change trend of averaged Hurst parameter of traffic under DDOS flood attacks. Comput security (2006) 25(3):213–20. doi:10.1016/j.cose.2005.11.007
19. Han H, Wang W-Y, Mao B-H. Borderline-SMOTE: A new over-sampling method in imbalanced data sets learning. In: International conference on intelligent computing; 2005 Aug 23; Berlin, Heidelberg. Springer (2005). p. 878–87. doi:10.1007/11538059_91
20. Chawla NV, Bowyer KW, Hall LO, Kegelmeyer WP. Smote: Synthetic minority over-sampling technique. J Artif intelligence Res (2002) 16:321–57. doi:10.1613/jair.953
22. Lashkari AH, Gil GD, Mamun MS, Ghorbani AA. Characterization of tor traffic using time based features. In: Proceedings of the 3rd International Conference on Information Systems Security and Privacy (ICISSP); Porto, Portugal (2017). p. 253–62. doi:10.5220/0006105602530262
Keywords: long-range dependence, cryptomining, feature extraction, traffic identification, blockchain
Citation: Dong L, Li Z, Li X, Wang X and Liu Y (2023) Identification technique of cryptomining behavior based on traffic features. Front. Phys. 11:1269889. doi: 10.3389/fphy.2023.1269889
Received: 31 July 2023; Accepted: 11 September 2023;
Published: 21 September 2023.
Edited by:
Ming Li, Zhejiang University, ChinaReviewed by:
Aiping Li, National University of Defense Technology, ChinaNing Hu, Guangzhou University, China
Copyright © 2023 Dong, Li, Li, Wang and Liu. This is an open-access article distributed under the terms of the Creative Commons Attribution License (CC BY). The use, distribution or reproduction in other forums is permitted, provided the original author(s) and the copyright owner(s) are credited and that the original publication in this journal is cited, in accordance with accepted academic practice. No use, distribution or reproduction is permitted which does not comply with these terms.
*Correspondence: Xiaofeng Wang, d2FuZ3hmQGppYW5nbmFuLmVkdS5jbg==
 Lijian Dong
 Zhigang Li2
 Xiangrong Li
 Xiaofeng Wang
 Yuan Liu