- 1Institute of Cyber-Systems and Control, College of Control Science and Engineering, Zhejiang University, Hangzhou, China
- 2Hangzhou Shengshi Technology Co., Ltd., Hangzhou, China
- 3Institute of Fluid Engineering, School of Aeronautics and Astronautics, Zhejiang University, Hangzhou, China
- 4Department of Radiology, Beijing Anzhen Hospital, Capital Medical University, Beijing, China
- 5School of Medicine, Zhejiang University, Hangzhou, China
- 6Department of Radiology, Sir Run Run Shaw Hospital, School of Medicine, Zhejiang University, Hangzhou, China
- 7Department of Medical Imaging, Medical School of Nanjing University, Jinling Hospital, Nanjing, China
Accurate segmentation of cardiac tissues and organs based on cardiac computerized tomography angiography (CCTA) images has played an important role in biophysical modeling and medical diagnosis. The existing research on segmentation of cardiac tissues generally rely on limited public data, which may lead to unsatisfactory performance. In this paper, we first present a unique dataset of three-dimensional (3D) CCTA images collected from multiple centers to remedy this shortcoming. We further propose to efficiently create labels by solving the Laplace’s equation with given boundary conditions. The generated images and labels are confirmed by cardiologists. A deep learning algorithm, based on 3D-Unet model trained with a combined loss function, is proposed to simultaneously segment aorta, left ventricle, left atrium, left atrial appendage and myocardium from the CCTA images. Experimental evaluations show that the model trained with a proposed combined loss function can improve the segmentation accuracy and robustness. By efficiently producing a patient-specific geometry for simulation, we believe that this learning-based approach could provide an avenue to combine with biophysical modeling for the study of hemodynamics in cardiac tissues.
1 Introduction
In recent years, a number of informatic technologies have been applied to improve the efficiency and accuracy for biophysical modeling and medical diagnosis. Quantitative metrics, which become available due to the advancement of computer methods, have been intensively applied for medical imaging, biophysical modeling, disease risk management, etc. For instance, the myocardial mass is employed as an indicator to assess coronary blood flow reserve [1]. The left atrial appendage opening area, fractal dimension and other topological parameters are useful in analyzing the ischemic stroke incidence. In addition, the right ventricle function is of great significance for diagnosing and treating heart diseases such as pulmonary hypertension and the tetralogy of Fallot [2, 3]. Moreover, computational fluid dynamics modelling has been employed for cardiac flow simulations to assess the hemodynamics [4]. In these examples, the accurate segmentation of a specific organ or tissue from a cardiac computerized tomography angiography (CCTA) image is a necessary startpoint for further analysis and therefore plays an essential role.
Traditional methods, based on Ostu’s threshold segmentation [5], transformed shape model [6], or Atlas-Based under-segmentation [7], are commonly used to segment organs of interest in CCTA images. However, it is not easy to extend these methods to the segmentation tasks where the objects have complex geometry or the images contain noises. In the last few years, deep learning has been widely used to extract tissues and organs from images of magnetic resonance imaging (MRI), computer tomography (CT), ultrasound and ophthalmoscopy images, and has been greatly successful [8–11]. For cardiac image segmentation, Vigneault et al. [12] and Sander et al. [13] introduced different approaches to segment cardiac MRI images in a public dataset—2017MICCAI dataset. The former used the convolutional neural network architecture and the latter adopted a method based on (Bayesian) dilated convolutional network. Wang et al. [14] also suggested that the 3D FCN network can perform well in segmenting prostate MR images on different datasets. Moreover, Huang et al. [15] proposed an improved training and inference scheme based on nnUNet [16], and added a coarse-to-fine strategy to reduce computational cost for achieving semi-supervised abdominal organ segmentation. More recently, Huang et al. [17] utilized the large-scale medical image segmentation dataset and conducted a comprehensive and detailed evaluation based on the large-scale model–the Segment Anything Model (SAM) [18], which becomes a promising way to segment different organs simultaneously. There are also some review articles summarizing the advances in this topic [19].
Despite the advances mentioned above, the current studies generally rely on public datasets (e.g., 2018 Atrial Segmentation Challenge [20]) released in deep-learning researches due to the limitation of medical data (e.g., limited medical images and difficulties in data collection) and time-consuming preparation of training labels. Especially, for myocardium segmentation task, manual labeling is usually required in pre-processing step, thus make it difficult to apply supervised learning strategy for myocardium segmentation. To address this problem, a unique dataset, including the 3D CCTA images and the corresponding masks for multiple tissues and organs, is established in this paper. Moreover, we proposed an automatic labeling method based on solving the Laplace’s equation, in order to avoid the troublesome procedure in data preparation.
With the unique dataset, our goal in this paper is to design a deep learning model which can simultaneously segment five cardiac tissues and organs, including aorta, left ventricle (LV), left atrium (LA), left atrial appendage (LAA) and myocardium (Myoc), which has been rarely done before. These tissues and organs are important indicators for disease diagnosis. For example, it is reported that the LAA disfunction is responsible for more than 90% of the ischemic strokes. Therefore, accurate segmentation of these organs can assist the researchers with biophysical simulation and help the cardiologists with proper diagnosis. To achieve this, we employ a 3D-Unet model in this paper and modify it to generate five different outputs, corresponding to five organs of interest. We also propose an appropriate loss function for training the 3D-Unet model according to a systematic study. The experimental results show that the well-trained model can provide segmentation of five different tissues and organs with high accuracy and robustness.
The rest of this paper is organized as follows. The unique dataset, including the CCTA images and the labels for segmentation, is introduced in Section 2. In addition, the 3D-Unet model with the combined loss function and the evaluation metrics are also described in Section 2. The experimental results are demonstrated in Section 3, with a systematic study in the loss function. Discussion and conclusion are given in Sections 4, 5, respectively.
2 Materials and methods
2.1 Dataset
In this paper, we collect 116 sets of CCTA data from multiple hospitals, that will be used for 3D segmentation of cardiac tissues and organs. Each sample image data has a dimension of N × P × Q, representing N slices with each slice containing P × Q pixels. In this work, particularly, each image data is generally composed of 170–330 slices, with each slice containing 512 × 512 pixels. To apply supervised learning strategy, the labeled ground-truth mask is required for each image. In the following, we introduce two sets of masks according to different labeling methods for aorta, LV, LAA and LAA and Myoc.
2.1.1 Dataset for aorta, LV, LA, and LAA segmentation
Instead of using traditional two-dimensional image annotation for each slice, the organs segmentation in this work is directly based on the three-dimensional structure. The rough geometric models, including the aorta, LV, LA, and LAA, were obtained from 3D CCTA images based on an annotation algorithm [21]. The region growing method is applied according to the CCTA gray value with a threshold of 226, since the geometries of these four organs are generally independent and enclosed by consistent brightness. Moreover, to obtain more precise segmentations, the three-dimensional geometric models of organs are mapped to the original CCTA image, and then corrected manually by the cardiologists. The dataset for aorta, LV, LA, and LAA segmentation is referred to the first sample set. An example in this dataset is shown in Figure 1, including several 2D image slices and the whole 3D segmented geometry, where different tissues and organs are marked in different colors.

FIGURE 1. Example of four different tissues and organs. (A) Two-dimensional slices. First row: five original CT slices. Second row: the annotation results of the corresponding tissue organ. (B) A three-dimensional geometric model. The aorta, LV, LA, and LAA are represented in red, green, light blue and dark blue colors, respectively.
2.1.2 Dataset for Myoc segmentation
The labelled masks of Myoc for neural network training can also be established by annotation software as in the first sample set. However, the grayscale value of the myocardium image is considerably lower than other parts containing more blood, and thus the accuracy of threshold segmentation is meager. Consequently, it could be problematic for operators to modify the three-dimensional myocardium geometry. Therefore, a manual labeling process on the 2D slices is necessary and is employed by drawing the outer boundary of Myoc based on the first sample dataset.
To enhance labeling efficiency in this work, the aforementioned manual marking is only activated every five slices in a 3D image. Subsequently, giving the first and the last annotation masks, the intermediate four Myoc annotation images are automatically created by solving the Laplace’s equation, which is a partial differential equation commonly-used to describe the diffusion process, e.g., [22]. In other words, the Laplace’s equation allows us to determine the propagated fields (i.e., intermediate four masks) from given boundary conditions (i.e., the first and last images by manual labeling). The mathematical expression of the Laplace’s equation is given by:
where
Assume that two masks of Myoc are obtained by manually drawing the boundaries on the 2D slices, as shown in Figures 2A, F. The areas representing the tissues or organs are with non-zero values; otherwise, the value is 0. To generate the intermediate masks of Myoc between two slices, we first set the boundary value of the first image as 1, while the boundary value of the other image is 255. By solving Eq. 1 and Eq. 2 based on these boundary conditions, a diffusion map representing the propagation field is generated, as shown in the left panel in Figure 2. Subsequently, we define the brightness thresholds as [52, 103, 154, 205], to generate the intermediate masks from the diffusion map. The resulting 3D masks of one example are illustrated in Figures 2B–E. We also note that the spacing of five slices to perform such a process is a tradeoff between the accuracy and computational cost. In addition, we approximate the locations of the intermediate four masks since the geometry of myocardium is generally smooth and homogeneous.
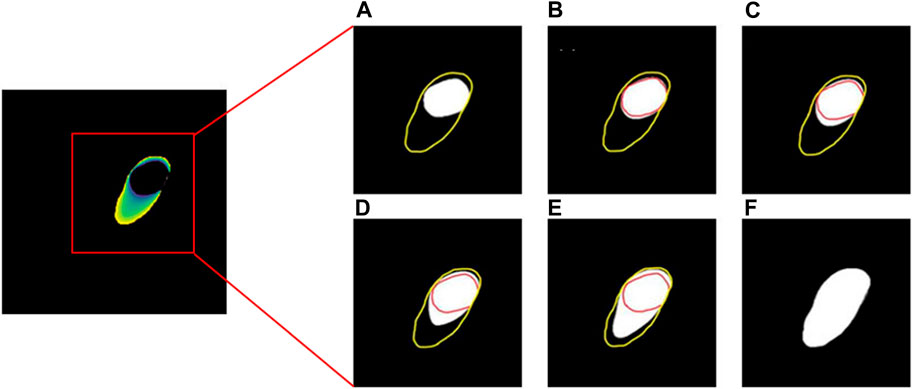
FIGURE 2. The process of solving the Laplace’s equation for obtaining the Myoc segmentations. The yellow and red lines in (A–F) represent outer boundary and inner boundary, respectively. The white areas in (A,F) are the manual segmentations of Myoc in two slices, while the white areas in (B–E) are the interpolated Myoc areas calculated by solving the Laplace’s equation.
In addition, a comparison between the manually-created masks of Myoc and the masks obtained by solving Laplace’s equation is demonstrated in Figure 3, where the outer boundaries of Myoc are marked in pink and red colors. We find that the two sets of images are very similar. However, we note that our proposed labeling method is much more efficient. The 3D geometry is also displayed in Figure 3, including all tissues and organs of interest (i.e., the aorta, LV, LA, LAA, and Myoc). Eventually, with the original CCTA images and the corresponding masks mentioned above, we created a full dataset that can be applied for supervised learning of a segmentation model.

FIGURE 3. Manual labeling and Laplace’s equation-solving labeling for Myoc segmentation. The Myoc segmentation in the first row are all manually marked (pink lines). The Myoc segmentation in the second row are calculated by the Laplace’s equation (red lines), where (A,F) are the two given reference labels; (B–E) are obtained by Laplace’s equation calculation. (G) A three-dimensional structure including the aorta, LV, LA, LAA, and Myoc.
2.2 Data pre-processing
2.2.1 Image scaling
First of all, the actual physical distance of the image data in each direction is calculated according to the resolution of the original CCTA image (e.g., spacing of slice and spacing of pixel). Next, an interpolation procedure, such as linear interpolation of image data, is used to uniformly interpolate the image to the resolution of 1 mm in all directions so as to ensure that the unit space distance of each medical image data in all directions is identical. Finally, each image data group as a whole is scaled. To ensure that the size of the scaled image does not exceed 128 pixels, the scaling ratio of each image data set is: ratio = 128/max(L, W, H), where L, W and H represent the length, width, and height of the image respectively. For those dimensions less than 128 pixels, the missing image elements are supplemented with 0.
2.2.2 Data augmentation
Before being fed into the neural network, the input-output images may be processed with the following operations for data augmentation [23, 24]: random rotation, flipping, affine transformation, and gamma transformation, with the possibility of 50% for each. Random rotation can be carried out by any angle. Here, we choose 90°, 180°, or 270°. Random flip can randomly flip the scaled sample set with respect to the X, Y or Z-axis. For affine transformation, the coordinates may be translated by 0–15 pixels in all directions and rotated by 0°–5°. The coefficient of gamma transformation is randomly sampled between 0.5 and 2.5 to correct the brightness of the input images.
2.2.3 Normalization
The disparity in image data distribution is noticeable due to the diversity of image acquisition, making it more difficult for the network model to learn features with great generalization capacity. In this paper, the pixel value X is normalized by Eq. 3 so that each input image meets the standard normal distribution:
Here,
2.3 3D-Unet
Following [25, 26], the 3D-Unet employed in this paper is composed of a feature extraction network, feature fusion network and feature connection. The architecture of the 3D-Unet is illustrated in Figure 4C. Firstly, the feature extraction network, consisting of several feature extraction units, is expected to extract features from input image data. The feature fusion network is then used to execute network up-sampling on the output data of the feature extraction unit. Different levels of residual connection as well as the jump connection comprise the feature connection, which allows the network to preserve different feature scales.

FIGURE 4. Flowchart of the proposed cardiac partition framework. (A) Workflow in this paper, where the 3D CCTA image is the input and the model outputs the 3D segmentations of five cardiac organs. (B) Mask labeling for aorta, LV, LA, LAA (first image) and Myoc (second image). (C) Architecture of 3D-Unet.
More specifically, a feature extraction unit is composed of a few convolution blocks and the first residual connection. It is designed to extract and down-sample the features from images (shown in the first half in Figure 4C). The first convolution block has a convolutional layer with 3D kernels in a size of
On the other hand, the feature fusion unit in the second half of 3D-Unet is composed of an up-sampling layer, the jump connection and two convolution blocks. In 3D-Unet model, the first and second residual connections and the jump connection are used to concatenate features with same resolution but from different processing stages, helping to avoid the gradient disappearance during 3D-Unet training and accelerate the convergence [30]. Moreover, we note that the image segmentation can be achieved at pixel level. If the image resolution of the input data is the same as that of the expected output of 3D-Unet network, the numbers of feature extraction and fusion units can remain constant. In this work, the numbers are both 5.
The training process of the segmentation network is also depicted in Figure 4. We transform 3D CCTA image data and label (after pre-processing) into images supplied to 3D-Unet model. As mentioned, we collect 116 data items in total, where 88 data sets are used for network training, 20 for validation and 8 for testing. The input dimension of the network is [128, 128, 128, 1], while the output dimension is [128, 128, 128, 5], where the five channels correspond to five different organs of interest. Eventually, we obtain a heart partition model which can be used to segment the aorta, LV, LA, LAA, and Myoc from general CCTA images.
2.4 Combined loss function
Deep-learning segmentation frameworks rely not only on the choice of network structure but also on the choice of loss function. For example, in medical image segmentation, the Dice loss function [31] can evaluate the similarity between the predicted annotation information of the neural network and the actual annotation information. Although the accuracy of Dice loss function is relatively high in most cases, the topological structure of the segmented object has not been taken into account, which leads to insufficient stability and structural errors in the annotation information predicted by the neural network. In particular, the segmentation for objects with small size or non-smooth boundary is not satisfactory. Compared with the Dice loss function, the centerlineDice (clDice) loss function [32] can better balance the overall accuracy of pixel-level segmentation. In addition, training with clDice loss also leads to a firm consistency of the topological structure between the label and predicted result. In other words, the clDice loss function enhances the stability of image segmentation. By taking into account both the characteristics of Dice and clDice loss functions, we propose a combined loss (CL) for our image segmentation task to balance the accuracy and stability when performing segmentation for five organs together.
The Dice loss function is as follows:
while the clDice loss function is calculated through the following equation:
In Eqs 4, 5,
In this paper, we consider a loss function combining the Dice and clDice (Dice_clDice) loss functions, which is given by:
where
where
2.5 Evaluation metrics
In order to evaluate the developed deep learning model from different perspectives, multiple indicators including the Dice similarity coefficient (DSC), precision (Pre.), Recall, and Hausdorff distance (HD) [33], are all used to assess the image segmentation performance. The DSC represents the overlap ratio between the network segmentation result and the reference segmentation result. The DSC is defined as follows:
where TP, TN, FP, and FN denote the number of true positive, true negative, false-positive, and false-negative pixels, respectively. Similarly, the Pre. and Recall are defined as follows:
In addition, Hausdorff distance is more sensitive to the segmented boundary, thus can better evaluate the topological similarity. It is defined as:
where X and Y are the actual boundary and the predicted boundary, respectively;
3 Experimental results
3.1 Training settings
With the data and model prepared, we can train the neural network to perform the segmentation task. In this work, we implement the 3D-Unet model in python based on Tensorflow library. The computational platform includes AMD Ryzen 5 3600X 6-Core Processor with 64 GB RAM, and an Nvidia Geforce RTX 2080Ti with 12 GB RAM. The training of the network parameters is done by using the Adam optimizer [34] and by taking 150 epochs with a mini-batch size of 1, due to the memory limitation for 3D images. The learning rate is initialized by 0.01 in the first 100 epochs and then is reduced by 70% every 25 epochs. During the training, we also evaluate the model performance on the validation dataset (including 20 data items), which can help us determine the hyper-parameters. When the model training is complete, post-processing steps are required to restore the network output to the original image size (i.e., image re-scaling) and to remove the background outliers (median and gaussian filtering).
3.2 Assessment on the loss function
In this section, we compare the 3D-Unet models trained with different loss functions. During the training process, the aorta, LV, LA, LAA, and Myoc tissue and organs are segmented on the validation set to evaluate the accuracy of the models. In addition to the Dice loss (Eq. 4) and the Dice_clDice loss (Eq. 6), we construct two combined loss functions, denoted by CL_LAA and CL_LAA_Myoc. The “CL_LAA” represents the combined loss function where only the LAA segmentation is optimized by Dice_clDice loss, while the “CL_LAA_Myoc” denotes the combined loss given exactly in Eq. 7. The weighting coefficient in the loss functions is set as a = 0.7. The loss values and the accuracy metrics during the training process are demonstrated in Figure 5, where we can see the proposed model with combined loss functions outperforms the others including those with Dice and Dice_clDice losses. The model with “CL_LAA_Myoc” is slightly better than that with “CL_LAA,” providing a lower loss value and higher accuracy in 3D segmentation.
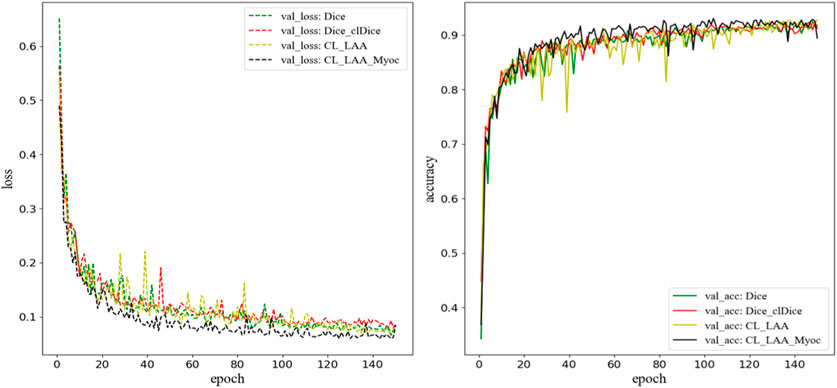
FIGURE 5. The loss function and accuracy on the validation dataset during model training. Here, “CL_LAA” denotes the combined loss function where only the LAA segmentation is optimized by Dice_clDice loss; “CL_LAA_Myoc” denotes the combined loss given in Eq. 7. The weighting parameter
Quantitatively, the proposed model, after training, predicts higher DSC values for all the segmentations of cardiac organs, as shown in Figure 6. Specifically, the mean DSC values for aorta, LV, and LA are much higher than 0.9, the mean DSC value for Myoc is 0.879, and the mean value for atrial appendage is 0.894. Compared to the model trained with Dice_clDice loss, the model infers the segmentation results of the whole heart partition, the mean DSC value was improved by 0.7%, and the SD value was reduced by 0.3%; the mean Pre. value is increased by 1.2% and SD value is decreased by 0.5%. For the model with Dice_clDice loss function, the maximum value of Hausdorff distance for myocardium segmentation is 25, while the maximum value for the new model is 12. The mean and SD of the HD index of the heart segmentation results for the new model are 1.865 and 1.55, respectively. Moreover, the index value of HD calculated by the new model in image segmentation was much lower. All the indicators shown in Figure 6 demonstrate that the proposed combined loss function is effective to improve the segmentation results for multiple cardiac tissues and organs.
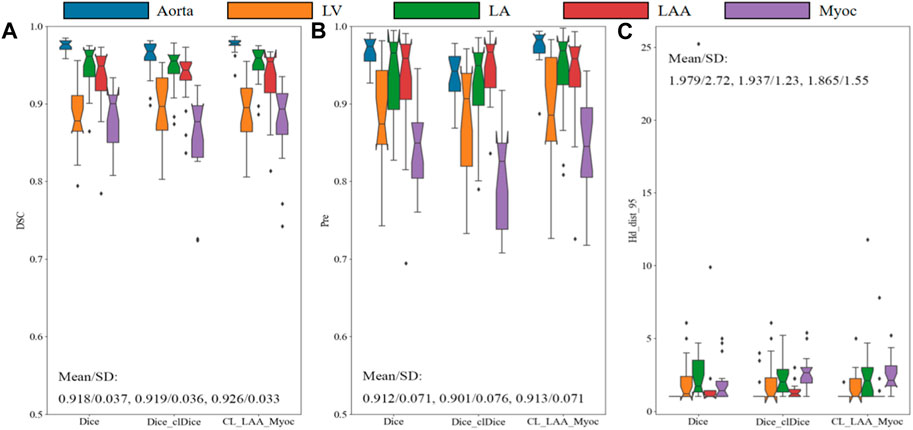
FIGURE 6. Comparison of models with different loss functions on the validation set. The Dice similarity coefficient (A), precision (B) and Hausdorff distance (C) are demonstrated for aorta, LV, LA, LAA, and Myoc. The mean and standard deviation are also illustrated in the figures.
To visualize the topological structures, the segmentation results of a testing example predicted by different models are illustrated in Figure 7, showing seven 2D slices in a 3D image. We can find that the size, shape and contrast of different organs (i.e., aorta, LV, LA, LAA and Myoc) vary against different slices. As demonstrated in the fourth–seventh rows, the proposed method is more accurate in predicting the segmentation details compared to the 3D-Unet models with Dice and Dice_clDice loss functions. In particular, the models with Dice and Dice_clDice loss functions fail to segment the LV, which is surrounded by Myoc, in the last slice shown in Figure 7. On the contrary, the proposed model is able to distinguish the LV and Myoc accurately, since the designed loss function can preserve details for the Myoc, correspondingly, can preserve the LV.
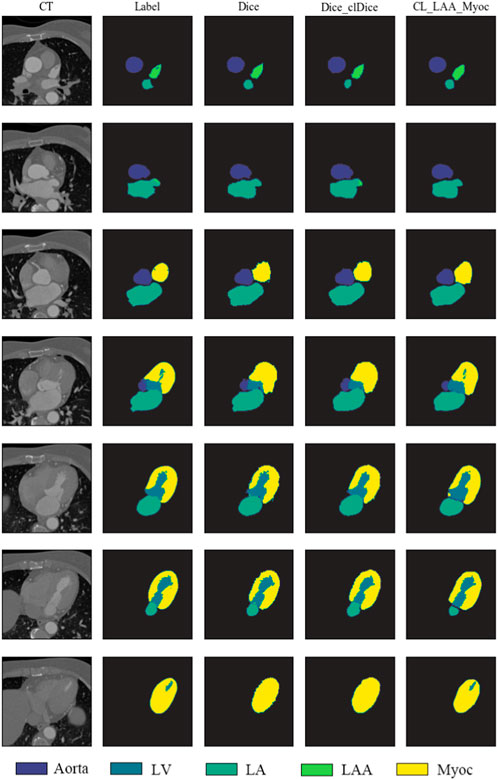
FIGURE 7. Segmentation results of sample slices from a testing set. First column: the original CT slices of aorta, LV, LA, LAA, and Myoc. Second column: sample labels are marked by software as well as solving the Laplace’s equation. Third–fifth columns: the heart segmentation results from 3D-Unet models with different loss functions.
Furthermore, we note that the weighting coefficient in the combined loss can affect the segmentation result to some extent. Therefore, we perform a systematic study to investigate the influence of using different weight parameters. The results of the cardiac segmentation were evaluated by using the mean and SD values of DSC on the validation set. All the resulting values are given in Table 1, together with the results of using identical Dice loss and Dice_clDice loss. As shown in the table, although the best metrics for different tissues or organs are given by different settings, the combined loss function provides better overall performance (i.e., higher average DSC values). It is clearly seen that the Dice_clDice loss can predict better segmentation for LAA, as the LAA is relatively a small structure. The combined loss (CL_LAA_Myoc) outperforms the others. In particular, the experimental results show that when
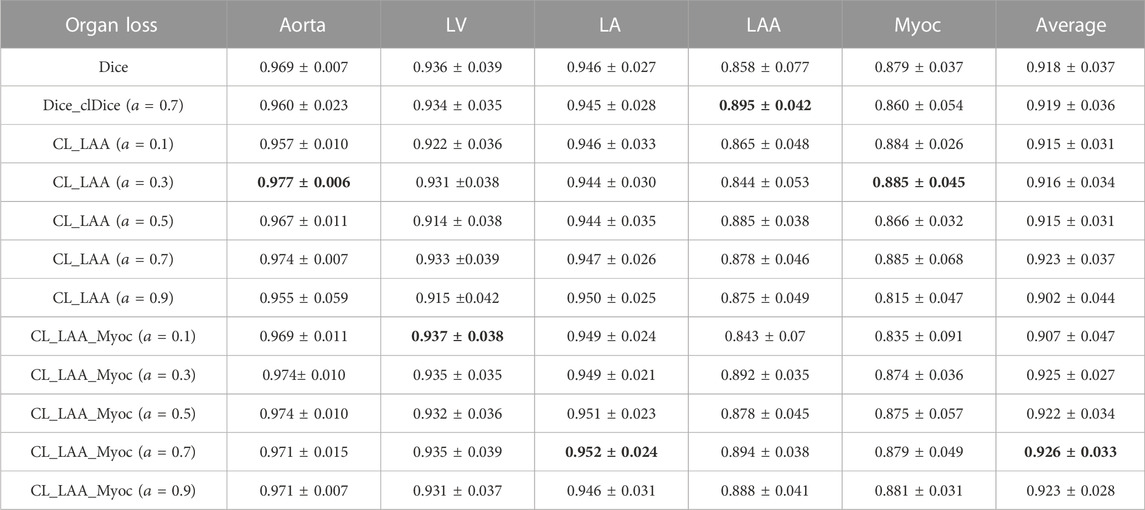
TABLE 1. Validation results with different weight parameters
3.3 Testing results
After training the neural network with proper parameters, we can apply the well-trained 3D-Unet model to perform 3D segmentation of five different tissues and organs by providing a 3D CCTA image. The segmentation results of the proposed model, evaluated by using the mean and SD of various indicators (DSC, Pre., Recall and HD), are listed in Table 2. The results show that the average DSC value of aorta is the highest (mean: 0.961, SD: 0.008), whereas that of the LAA is the lowest (mean: 0.882, SD: 0.021). Once again, we note that the LAA is with small size and intricate geometry, thus minor difference in the shape may result in large difference in the DSC. For the Myoc segmentation, which is an attractive task in the community, we achieve relatively good performance. The average Pre. value of Myoc, average Recall value and the average HD value are 0.867, 0.994 and 2.9, respectively. Overall, the average DSC of the five organs, given by the proposed model, can reach 0.924; and the Recall is all close to 1, which is promising in practical applications.
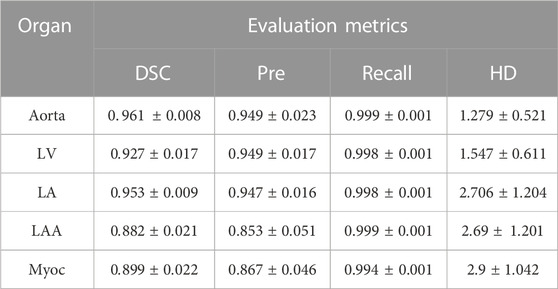
TABLE 2. Performance of the 3D-Unet model on segmenting cardiac organs. The mean and SD of various indicators are computed based on the testing sets. The 3D-Unet model is trained with the proposed combined loss function (
A testing example is demonstrated in Figures 8, 9, where several 2D slices are shown in Figure 8 and the overall 3D geometric structures are shown in Figure 9. It can be seen in the figures that the labels and the segmentation results of the proposed 3D-Unet model are in great agreement, indicating the effectiveness of our proposed method.

FIGURE 8. Comparison between labels and segmentation results. (A) original CT images. (B) Semi-automatic labeling of 2D slices. Green, red, light blue, dark blue and pink colors represent LV, aorta, LA, LAA and Myoc, respectively. (C) Predictions and labels plotted together, where the black line is the result predicted by the proposed deep learning model.
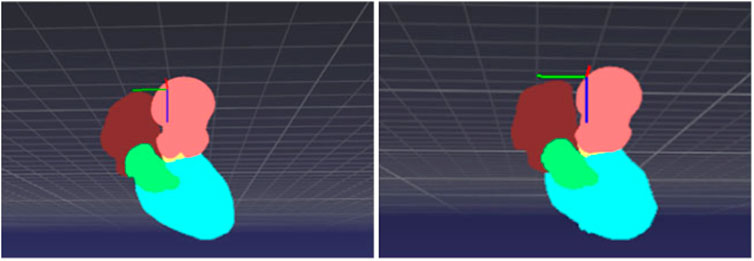
FIGURE 9. 3D point cloud structure of cardiac partitions: (left) label and (right) segmentation from the proposed deep learning model.
4 Discussion
In this paper, we propose to use a deep learning model for the segmentation of multiple cardiac organs, including the aorta, LV, LA, LAA, and Myoc. The contributions are multifolds. Firstly, we novelly propose to perform myocardium labeling by solving the Laplace’s equation, which dramatically improves the efficiency for preparing the training data. Instead of making masks manually for all slices, only a small portion of slices in a 3D CCTA image are labeled manually, and the masks of the intermediate slices are created automatically, which takes about 1.8 s to generate the intermediate 4 masks per solving an equation. The fully-manual labeling method and the proposed semi-automatic manual labeling method provide similar segmentation masks; the DSC between two sets of mask is about 0.934. Moreover, the masks created by solving the Laplace’s equation have been confirmed by the cardiologists and are suitable to be the reference in disease diagnosis. Second, we propose a 3D-Unet model trained with a combined loss function. The combined loss function (Eq. 7) employs different objective functions for different output layers in the neural network (i.e., different organs of interest), which allows us to improve the overall performance of the 3D-Unet. The main reason to design a combined loss function is that we aim to segment multiple cardiac tissues and organs in the same time. Compared to using five different models for five organs, using a single network for five organs can provide more information for the cardiologists, and it is much more efficient and necessary when the model is embedded in real-time applications.
There are some related works performing cardiac segmentation in the literature. For example, Jun Guo et al. [35] performed 3D Myoc segmentation for CCTA images using a 3D deeply supervised attention U-net model, and it was reported that the average HD index was about 6.840. The whole dataset contains 100 patient-specific cases. In this paper, the mean and SD of the HD index for Myoc segmentation are 2.9 and 1.042, respectively. Although the testing data are different, these values are much smaller and indicate better generalization of our model. Li et al [36] came up with an 8-layer residual U-Net with deep supervision for the segmentation of LV in CCTA images, achieving a Pred. value of 0.938
We note that there are some newly-developed learning-based segmentation methods that can achieve state-of-the-art performance on public datasets. For examples, the nnU-Net [16], which is a general framework with adaptive data augmentation, was developed and validated on ten different datasets provided by the medical segmentation decathlon. However, training the nnU-Net may consume more memory and time. In our work, we design a relatively simple model for a specific task, namely segmenting different cardiac organs simultaneously. A comparison with the nnU-Net on the specific dataset is worth investigating in the future. On the other hand, the large models such as SAM [18] needs fine-tuning in order to be applied for cardiac segmentation, which is also promising in our case.
5 Conclusion
In this paper, a unique multi-center dataset consisting of 116 CCTA images is employed to accomplish 3D cardiac partition tasks. We propose to perform labeling for myocardium by solving the Laplace’s equation, which can expedite the data preparation process and has been confirmed by the cardiologists. A modified 3D-Unet model is employed to segment multiple tissues and organs (including aorta, LV, LA, LAA, and Myoc) from the 3D CCTA images. We conduct a systematic study to investigate the influence of the loss function and its weighting coefficient. A combined loss function is eventually applied in training the 3D-Unet model, which outperforms the single Dice loss and Dice_clDice loss. After training, the proposed model achieves satisfactory accuracy and robustness, indicated by multiple metrics such as DSC, Pre., Recall and HD.
There are still some ongoing works that can be done. Although we know that the segmentation for left atrial appendage is relatively difficult due to the small size and complex shape, we expect to improve the segmentation accuracy of LAA in the future. This is important for disease diagnosis since it is known that the LAA is responsible for most of the ischemic strokes. To overcome the difficulties in segmenting LAA in CCTA images, imposing a prior knowledge during the data preparation stage or adding more layers specifically for the LAA output in the neural network may be a possible direction. Moreover, we are collecting more CCTA from numerous hospitals to enlarge our training dataset, which will help to improve the segmentation accuracy and generalization ability of our proposed model.
Data availability statement
The raw data supporting the conclusion of this article will be made available by the authors, without undue reservation.
Author contributions
SC: Conceptualization, Methodology, Writing–original draft, Writing–review and editing. YL: Methodology, Software, Writing–original draft, Writing–review and editing. BL: Methodology, Writing–original draft. QG: Conceptualization, Supervision, Writing–review and editing. LX: Data curation, Resources, Writing–review and editing. XH: Resources, Writing–review and editing. LZ: Resources, Supervision, Writing–review and editing.
Funding
The author(s) declare financial support was received for the research, authorship, and/or publication of this article. This work was supported by the National Natural Science Foundation of China (Grant No. 12072320).
Acknowledgments
The authors would like to acknowledge the contributions from multiple hospitals for providing the CCTA images, including Jinling Hospital (Medical School of Nanjing University), Sir Run Run Shaw Hospital (Medical school of Zhejiang University), Peking Union Medical College Hospital (Chinese Academy of Medical Sciences and Peking Union Medical College), Shanghai Jiao Tong University Affiliated Sixth People’s Hospital, Xijing Hospital (Fourth Military Medical University), Shengjing Hospital (China Medical University), Jiangsu Taizhou People’s Hospital, Nanjing First Hospital (Nanjing Medical University), Beijing Anzhen Hospital (Capital Medical University), The First Affiliated Hospital (Xi’an Jiaotong University), and Guangdong Provincial People’s Hospital.
Conflict of interest
Authors YL and BL were employed by Hangzhou Shengshi Technology Co., Ltd.
The remaining authors declare that the research was conducted in the absence of any commercial or financial relationships that could be construed as a potential conflict of interest.
The author(s) declared that they were an editorial board member of Frontiers, at the time of submission. This had no impact on the peer review process and the final decision
Publisher’s note
All claims expressed in this article are solely those of the authors and do not necessarily represent those of their affiliated organizations, or those of the publisher, the editors and the reviewers. Any product that may be evaluated in this article, or claim that may be made by its manufacturer, is not guaranteed or endorsed by the publisher.
References
1. Choy JS, Kassab GS. Scaling of myocardial mass to flow and morphometry of coronary arteries. J Appl Physiol (2008) 104(5):1281–6. doi:10.1152/japplphysiol.01261.2007
2. Brewis MJ, Bellofiore A, Vanderpool RR, Chesler NC, Johnson MK, Naeije R, et al. Imaging right ventricular function to predict outcome in pulmonary arterial hypertension. Int J Cardiol (2016) 218:206–11. doi:10.1016/j.ijcard.2016.05.015
3. Kutty S, Shang Q, Joseph N, Kowallick JT, Schuster A, Steinmetz M, et al. Abnormal right atrial performance in repaired tetralogy of Fallot: A CMR feature tracking analysis. Int J Cardiol (2017) 248:136–42. doi:10.1016/j.ijcard.2017.06.121
4. Zhong L, Zhang JM, Su B, Tan RS, Allen JC, Kassab GS. Application of patient-specific computational fluid dynamics in coronary and intra-cardiac flow simulations: Challenges and opportunities. Front Physiol (2018) 9:742. doi:10.3389/fphys.2018.00742
5. Katouzian A, Prakash A, Konofagou E. A new automated technique for left-and right-ventricular segmentation in magnetic resonance imaging. Int Conf IEEE Eng Med Biol Soc (2006) 2006:3074–7. doi:10.1109/IEMBS.2006.260405
6. Schramm H, Ecabert O, Peters J, Philomin V, Weese J. Toward fully automatic object detection and segmentation. In: Medical imaging 2006: Image processing. San Diego, California, United States: SPIE (2006). p. 11–20.
7. Wachinger C, Golland P. Atlas-based under-segmentation. In: Medical Image Computing and Computer-Assisted Intervention–MICCAI 2014: 17th International Conference; September 14-18, 2014; Boston, MA, USA (2014). p. 315–22.
8. Hesamian MH, Jia W, He X, Kennedy P. Deep learning techniques for medical image segmentation: Achievements and challenges. J Digital Imaging (2019) 32:582–96. doi:10.1007/s10278-019-00227-x
9. Wang R, Lei T, Cui R, Zhang B, Meng H, Nandi AK. Medical image segmentation using deep learning: A survey. IET Image Process (2022) 16(5):1243–67. doi:10.1049/ipr2.12419
10. Zhang Q, Sampani K, Xu M, Cai S, Deng Y, Li H, et al. AOSLO-Net: A deep learning-based method for automatic segmentation of retinal microaneurysms from adaptive optics scanning laser ophthalmoscopy images. Translational Vis Sci Tech (2022) 11(8):7. doi:10.1167/tvst.11.8.7
11. Deng Y, Li H. Deep learning for few-shot white blood cell image classification and feature learning. Computer Methods Biomech Biomed Eng Imaging Visualization (2023) 2023:1–11. doi:10.1080/21681163.2023.2219341
12. Vigneault DM, Xie W, Ho CY, Bluemke DA, Noble JA. Ω-Net (omega-net): Fully automatic, multi-view cardiac MR detection, orientation, and segmentation with deep neural networks. Med Image Anal (2018) 48:95–106. doi:10.1016/j.media.2018.05.008
13. Sander J, de Vos BD, Wolterink JM, Išgum I. Towards increased trustworthiness of deep learning segmentation methods on cardiac MRI. Med Imaging 2019: image Process (2019) 10949:324–30. doi:10.1117/12.2511699
14. Wang B, Lei Y, Tian S, Wang T, Liu Y, Patel P, et al. Deeply supervised 3D fully convolutional networks with group dilated convolution for automatic MRI prostate segmentation. Med Phys (2019) 46(4):1707–18. doi:10.1002/mp.13416
15. Huang S, Mei L, Li J, Chen Z, Zhang Y, Zhang T, et al. Abdominal CT organ segmentation by accelerated nnUNet with a coarse to fine strategy. In: MICCAI Challenge on fast and low-resource semi-supervised abdominal organ segmentation. Berlin, Germany: Springer (2022). p. 23–34.
16. Isensee F, Jaeger PF, Kohl SA, Petersen J, Maier-Hein KH. nnU-Net: a self-configuring method for deep learning-based biomedical image segmentation. Nat Methods (2021) 18(2):203–11. doi:10.1038/s41592-020-01008-z
17. Huang Y, Yang X, Liu L, Zhou H, Chang A, Zhou X, et al. Segment anything model for medical images? (2023). arXiv preprint arXiv:2304.14660.
18. Kirillov A, Mintun E, Ravi N, Mao H, Rolland C, Gustafson L, et al. Segment anything (2023). arXiv preprint arXiv:2304.02643.
19. Chen C, Qin C, Qiu H, Tarroni G, Duan J, Bai W, et al. Deep learning for cardiac image segmentation: A review. Front Cardiovasc Med (2020) 7:25. doi:10.3389/fcvm.2020.00025
20. Xiong Z, Fedorov VV, Fu X, Cheng E, Macleod R, Zhao J. Fully automatic left atrium segmentation from late gadolinium enhanced magnetic resonance imaging using a dual fully convolutional neural network. IEEE Trans Med Imaging (2018) 38(2):515–24. doi:10.1109/tmi.2018.2866845
21. Adams R, Bischof L. Seeded region growing. IEEE Trans Pattern Anal Machine Intelligence (1994) 16(6):641–7. doi:10.1109/34.295913
22. Jones SE, Buchbinder BR, Aharon I. Three-dimensional mapping of cortical thickness using Laplace's equation. Hum Brain Mapp (2000) 11(1):12–32. doi:10.1002/1097-0193(200009)11:1<12::aid-hbm20>3.0.co;2-k
23. Shorten C, Khoshgoftaar TM. A survey on image data augmentation for deep learning. J Big Data (2019) 6(1):60–48. doi:10.1186/s40537-019-0197-0
24. Nalepa J, Marcinkiewicz M, Kawulok M. Data augmentation for brain-tumor segmentation: A review. Front Comput Neurosci (2019) 13:83. doi:10.3389/fncom.2019.00083
25. Han D, Liu J, Sun Z, Cui Y, He Y, Yang Z. Deep learning analysis in coronary computed tomographic angiography imaging for the assessment of patients with coronary artery stenosis. Comp Methods Programs Biomed (2020) 196:105651. doi:10.1016/j.cmpb.2020.105651
26. Çiçek Ö, Abdulkadir A, Lienkamp SS, Brox T, Ronneberger O. 3D U-net: Learning dense volumetric segmentation from sparse annotation. In: Medical Image Computing and Computer-Assisted Intervention–MICCAI 2016: 19th International Conference; October 17-21, 2016; Athens, Greece (2016). p. 424–32.
27. Huang X, Belongie S. Arbitrary style transfer in real-time with adaptive instance normalization. In: Proceedings of the IEEE International Conference on Computer Vision; 22-29 October 2017; Venice, Italy (2017). p. 1501–10.
28. Nam H, Kim HE. Batch-instance normalization for adaptively style-invariant neural networks. Adv Neural Inf Process Syst (2018) 31.
29. Srivastava N, Hinton G, Krizhevsky A, Sutskever I, Salakhutdinov R. Dropout: A simple way to prevent neural networks from overfitting. J Machine Learn Res (2014) 15(1):1929–58. doi:10.5555/2627435.2670313
30. Xue Y, Farhat FG, Boukrina O, Barrett AM, Binder JR, Roshan UW, et al. A multi-path 2.5 dimensional convolutional neural network system for segmenting stroke lesions in brain MRI images. NeuroImage: Clin (2020) 25:102118. doi:10.1016/j.nicl.2019.102118
31. Sudre CH, Li W, Vercauteren T, Ourselin S, Jorge Cardoso M. Generalised DICE overlap as a deep learning loss function for highly unbalanced segmentations. In: Deep Learning in Medical Image Analysis and Multimodal Learning for Clinical Decision Support: Third International Workshop, DLMIA 2017, and 7th International Workshop, ML-CDS 2017, Held in Conjunction with MICCAI 2017; September 14; Québec City, QC, Canada (2017). p. 240–8.
32. Shit S, Paetzold JC, Sekuboyina A, Ezhov I, Unger A, Zhylka A, et al. clDice - a novel topology-preserving loss function for tubular structure segmentation. In: Proceedings of the IEEE/CVF Conference on Computer Vision and Pattern Recognition; 18-24 June 2022; New Orleans, Louisiana, USA (2021). p. 16560–9.
33. Taha AA, Hanbury A. Metrics for evaluating 3D medical image segmentation: Analysis, selection, and tool. BMC Med Imaging (2015) 15(1):29–8. doi:10.1186/s12880-015-0068-x
34. Kingma DP, BaAdam J. A method for stochastic optimization (2014). arXiv preprint arXiv:1412.6980.
35. Jun Guo B, He X, Lei Y, Harms J, Wang T, Curran WJ, et al. Automated left ventricular myocardium segmentation using 3D deeply supervised attention U-net for coronary computed tomography angiography; CT myocardium segmentation. Med Phys (2020) 47(4):1775–85. doi:10.1002/mp.14066
36. Li C, Song X, Zhao H, Feng L, Hu T, Zhang Y, et al. An 8-layer residual U-Net with deep supervision for segmentation of the left ventricle in cardiac CT angiography. Comp Methods Programs Biomed (2021) 200:105876. doi:10.1016/j.cmpb.2020.105876
37. Chen C, Bai W, Rueckert D Multi-task learning for left atrial segmentation on GE-MRI. In Statistical Atlases and Computational Models of the Heart. Atrial Segmentation and LV Quantification Challenges: 9th International Workshop, STACOM, Held in Conjunction with MICCAI 2018, Granada, Spain, September 16, 2018, (2019) 292–301.
Keywords: 3D image segmentation, cardiac computerized tomography angiography, cardiac disease, 3D-Unet, Laplace’s equation
Citation: Cai S, Lu Y, Li B, Gao Q, Xu L, Hu X and Zhang L (2023) Segmentation of cardiac tissues and organs for CCTA images based on a deep learning model. Front. Phys. 11:1266500. doi: 10.3389/fphy.2023.1266500
Received: 25 July 2023; Accepted: 21 August 2023;
Published: 31 August 2023.
Edited by:
Zhen Li, Clemson University, United StatesReviewed by:
Yixiang Deng, Ragon Institute, United StatesZhigang Ren, Guangdong University of Technology, China
Copyright © 2023 Cai, Lu, Li, Gao, Xu, Hu and Zhang. This is an open-access article distributed under the terms of the Creative Commons Attribution License (CC BY). The use, distribution or reproduction in other forums is permitted, provided the original author(s) and the copyright owner(s) are credited and that the original publication in this journal is cited, in accordance with accepted academic practice. No use, distribution or reproduction is permitted which does not comply with these terms.
*Correspondence: Qi Gao, cWlnYW9Aemp1LmVkdS5jbg==; Longjiang Zhang, a2V2aW56aGxqQDE2My5jb20=
 Shengze Cai
 Yunxia Lu2
 Bowen Li
 Longjiang Zhang