 Xudong Xie1,2
 Ke Yao
95% of researchers rate our articles as excellent or good
Learn more about the work of our research integrity team to safeguard the quality of each article we publish.
Find out more
ORIGINAL RESEARCH article
Front. Phys. , 08 September 2023
Sec. Optics and Photonics
Volume 11 - 2023 | https://doi.org/10.3389/fphy.2023.1266374
In ultra-high-power/energy solid-state Nd:glass laser facilities, the gain distribution of the main amplifier system (MAS) is nonuniform owing to strong amplified spontaneous emissions in the MAS. A shaped beam profile from a preamplifier (PreAMP) should be set opposite to the gain profile in the MAS to obtain a high-power beam with an approximately flat beam profile. This flat beam profile can result in the high efficiency of the frequency-conversion crystals. In this study, the laser beam was spatially formatted as an M-shaped beam with precompensation (PreCOM) for the nonuniform gain profile of the MSA. Modulation of the cross-sectional gain distribution of the PreAMP was demonstrated by selecting the absorption coefficient of the Nd:glass rod and pump configuration. Using the proposed off-axis relay-imaging eight-pass amplifier, an M-shaped beam with an output pulse energy of 1 J and a repetition rate of 1 Hz was experimentally achieved. With an Nd3+ concentration of 1.2 wt% and Nd: glass rod diameter of 18 mm, an M-shaped beam profile with a 4.3:1 ratio of intensity at the margin to that at the center was successfully obtained. Such controllable M-shaped beams can be optionally introduced to the MAS to compensate for non-uniform spatial gain profiles.
Ultrahigh-power/energy solid-state Nd:glass laser facilities are highly desired for a wide range of applications, such as high-energy-density science, inertial confinement fusion, and astrophysics [1]. Generally, these laser facilities consist of a fiber-based front-end system, preamplifier system (PreAMP), main amplifier system (MAS), and final optical assemblies [2–5]. To maximize the laser energy and efficiency of frequency conversion, and reduce the risk of optical damage resulting from the intensity-modulation-induced nonlinear effect, a beam profile output from the MAS with a flat-top profile is required. However, owing to the strong amplified spontaneous emission in MAS, the gain distribution is nonuniform, which typically indicates that the gain coefficient is higher at the center of the active medium than at the margin. Therefore, to obtain the desired flat-beam profile, the beam profile from the PreAMP should be opposite the gain profile in the MAS, which is related to the gain distribution and geometry of the MAS [6].
Currently, the most commonly used method to obtain a flat-beam profile is beam shaping with an optically or electrically addressed liquid crystal spatial light modulator (LC-SLM) [7–10]. An LC-SLM can perform accurately programmable manipulations; hence, the beam intensity can be dynamically adjusted to have an arbitrary profile and compensate for gain nonuniformities in the downstream amplifiers. An LC-SLM can also be used for flaws or damaged spot shadows in downstream optical components that are susceptible to laser-induced damage growth [11, 12]. However, because the contrast of an LC-SLM is relatively low (e.g., 100:1–200:1), its beam shaping capability is limited. If the shaping capability of an LC-SLM is further partly consumed to compensate for the gain of nonuniformities, the effect of damaged location shadows will decrease, which may affect the safe operation of downstream optical components. To solve this problem, an additional shaping mask with a specified transmission distribution was introduced to compensate (i.e., include a precompensation, PreCOM) for the nonuniform spatial gain profile in the MAS [13]. However, both the aforementioned methods suffer from unavoidable laser-energy losses. In particular, when the amplifier is saturated (e.g., in a multipass amplifier), the loss is considerably large.
In this study, an M-shaped beam method based on gain-distribution manipulation was proposed, and a theoretical analysis and experimental demonstration were performed. The gain distribution in the PreAMP was manipulated to match the nonuniform gain distribution in the MAS by optimizing the pump configuration and parameters of the preAMP. Finally, the fluorescence distribution and beam with an M-shaped profile that was output from the PreAMP were experimentally measured and verified; the results agreed well with the theoretical results. The obtained results demonstrated the feasibility of the beam-intensity shaping method based on accurate gain distribution manipulations. This method can be applied in high-power laser facilities to improve beam quality and energy conversion efficiency.
In this study, to improve energy extraction efficiency and beam quality, we developed an off-axial relay-imaged eight-pass PreAMP configuration (Figure 1). The PreAMP mainly contains an amplifier (AMP), 45° Faraday rotators (FR1 and FR2), imaging systems (SF1 and SF2), and other optical components such as flat reflecting mirrors (M1, M2, M3, M4, M5, M6, CM1, CM2 and CM3), and thin-film polarizers (THP1, THP2, THP3, and THP4) (Figure 1A). FR2, placed after M2 in the layout to eliminate the depolarization of M1 and M2 owing to the different reflectivities of s- and p-polarization, compensates for AMP depolarization. Each imaging system comprises two convex lenses and a vacuum tube for relay imaging, low-pass spatial filtering, off-axial amplification control, and beam-aperture matching. The amplifier is designed to generate pulses with 1J energy and an M-shaped profile to satisfy the energy requirement and compensate for the nonuniform gain distribution in the downstream amplifier.
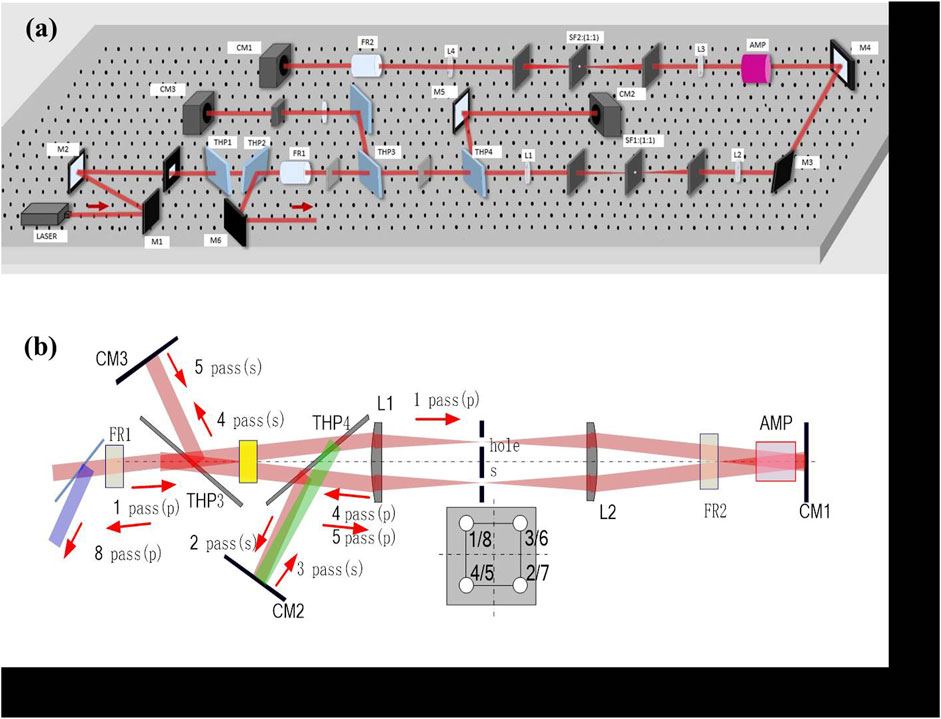
FIGURE 1. (A) Schematic diagram and (B) whole optical path of an off-axis relay-imaging eight-pass Nd:glass PreAMP. THP1, THP2, THP3, THP4, thin-film polarizer; M1, M2, M3, M4, CM1, CM2, flat reflecting mirror; L1, L2, L3, L4, lens; SF1, SF2, spatial filter; AMP, amplifier; FR1, FR2, 45o Faraday rotator.
The entire optical path in the off-axis relay-imaging eight-pass PreAMP is shown in Figure 1B. An input laser with p-polarization was injected into the amplifier system through THP4. After passing through FR1, THP2, and THP1, the polarization state remained p-polarized. The laser was then directed into a traditional four-pass amplification cavity comprising M3 and M5 [2, 3]. In the four-pass amplification cavity, the laser was amplified four times (first to fourth pass) because of the polarization control of FR2 and then coupled out from THP1 with p-polarization. The amplifier system is off-axis; hence, the directions of the fourth-pass and first-pass lasers are different. The direction differences and optic principles of a birefringence crystal (BFC) were used to change the polarization state from p-to s-polarization. The detailed principles are presented in our previously published study [14]. The fourth-pass laser was bounced using THP2. THP3 and CM3 were used to reflect the fourth-pass laser to the BFC along the same direction, which is called the fifth-pass laser. Similar to the polarization change of the fourth-pass laser, the polarization state of the fifth-pass laser was rotated by 90° after passing through the BFC. Consequently, the polarization state of the laser changed from s-to p-polarization. It was then injected into a four-pass amplifier cavity. According to the reversibility of light propagation, the laser was successively amplified for another four-passes, and the directions of the eighth- and first-pass lasers were the same. The polarization state of the eighth-pass laser rotated by 0° after passing through the BFC once again and a p-polarization was maintained. Finally, the eighth-pass laser was coupled from THP4 using HWP and ROT1.
In the off-axial eight-pass PreAMP, the focal lengths of L1, L2, L5, and L6 were 700 mm, and those of L3 and L4 were 600 mm. The BFC were DKDP crystals, 32 mm in length. Laser diodes (LDs) were selected as the pump source to reduce heat wastage, and the center wavelength was 802 nm. The structure of the AMP (Figure 2) mainly consists of 12 annular units and a Nd:glass rod. Each annular unit comprised 13 LD stack side-ring-pumping schemes to improve the gain and heat uniformity, and each LD stack consisted of three LD bars. We used a ray tracing approach [15] to determine the optical characteristics of the LD rays inside the Nd:glass rod (Figure 3). When the number of LD stacks was greater than 13, a relatively uniform pump light distribution was obtained in the angular direction of the rod. Odd-numbered LD side pumping was used to prevent the residual pump light that is not absorbed by the gain medium from destroying the LD on the opposite side. A stack, comprising three LD bars, was used on each side to further homogenize the pump deposition.
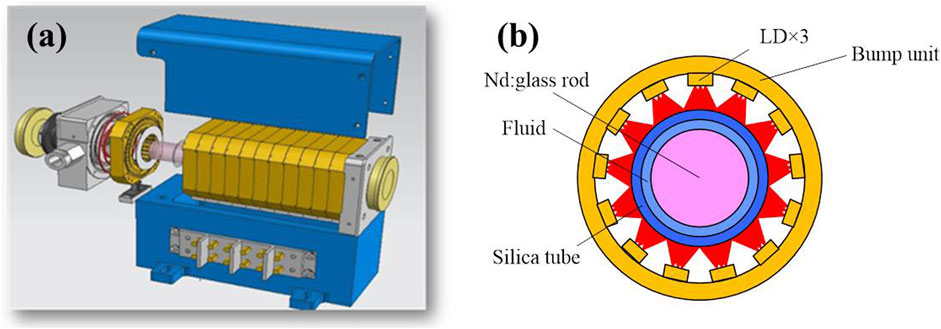
FIGURE 2. (A) Structure of the amplifier head. (B) Schematic of the structure of 13 LD stacks side-pumped Nd:glass rod. Each stack consists of three LD bars.
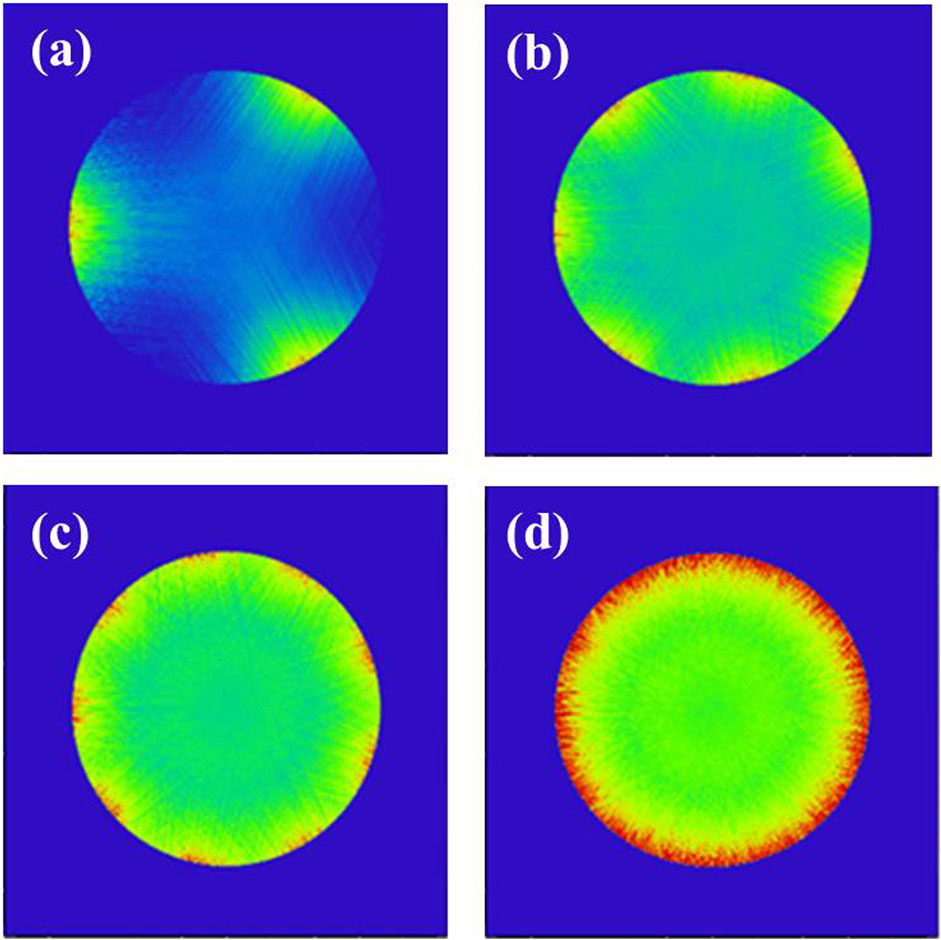
FIGURE 3. Simulation by a ray-tracing method. The number of LD stacks is (A) 3, (B) 7; (C) 9, and (D) 13.
The peak power of each LD bar was 500 W. Each ring unit had a peak power of 19.5 kW. Thus, the total pump power of the AMP was 234 kW. The pump pulse width was set to 500 μs. The geometric size of the Nd:glass rod was Ф18 mm × 200 mm with an effective pump length of 140 mm. The absorbed pump energy distributions at Nd:glass rod with a radius of 18 mm were calculated. Nd3+ concentrations were 0.8, 1.0, 1.2, and 1.4 wt%, respectively. When the Nd3+ concentration is 1.2 wt%, the absorbed pump energy distributions have an M-shaped profile; therefore, the small-signal gain coefficient also has the desired M-shaped profile, which is capable of outputting the M-shaped beam profile. According to the four-level rate equations, the dynamic amplification process of the population inversion and photon densities obeys Eq. 1 [16].
where
Because the equations are complex, we adopted numerical calculations to analyze the amplification process. The typical optical component parameters are listed in Table 1. In the numerical simulations, the input beam is a 10 mm × 10 mm flat-top square beam with energy is 0.16 mJ and the average single-pass small-signal gain is 3.85. The calculated gain and intensity distributions of the output beam for single-to eight-pass amplifications are shown in Figures 4, 5, respectively. The intensity distribution is centrosymmetric, and the intensity at the margin is larger than that at the center. The ratio of the intensity at the margin to that at the center was approximately 4.2:1.
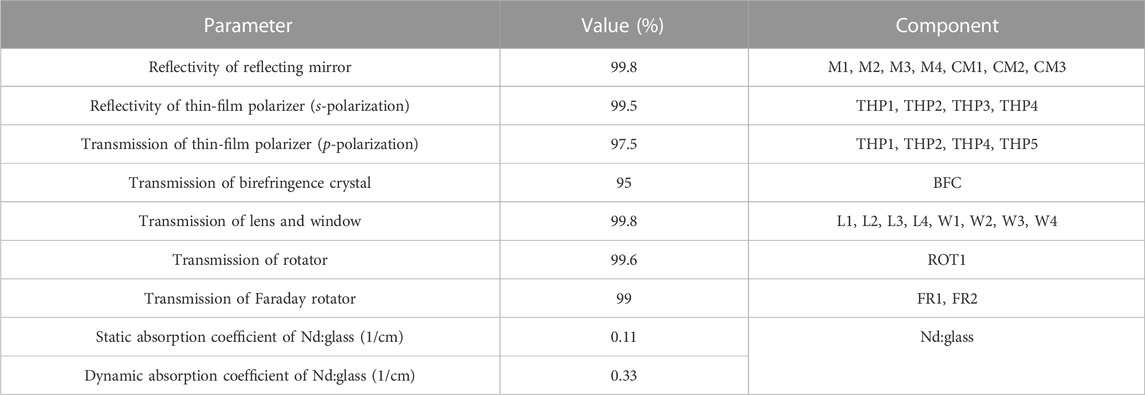
TABLE 1. Typical-optical component parameters used for numerical simulation.
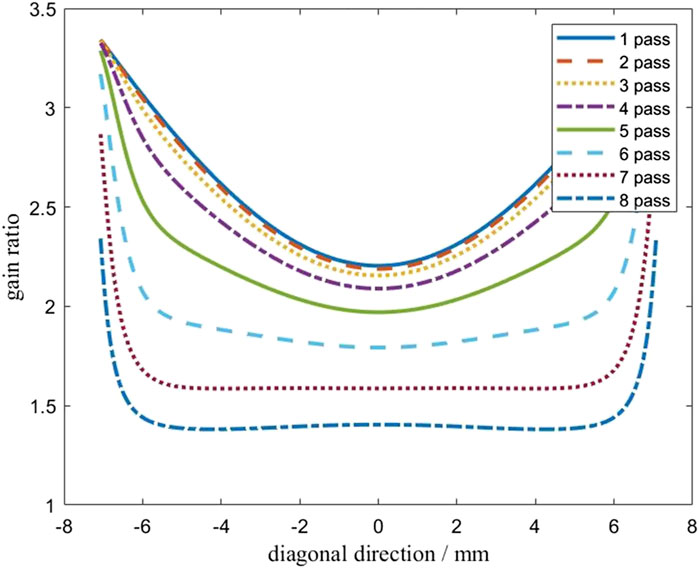
FIGURE 4. Calculated gain distribution for single-to eight-pass amplifications.
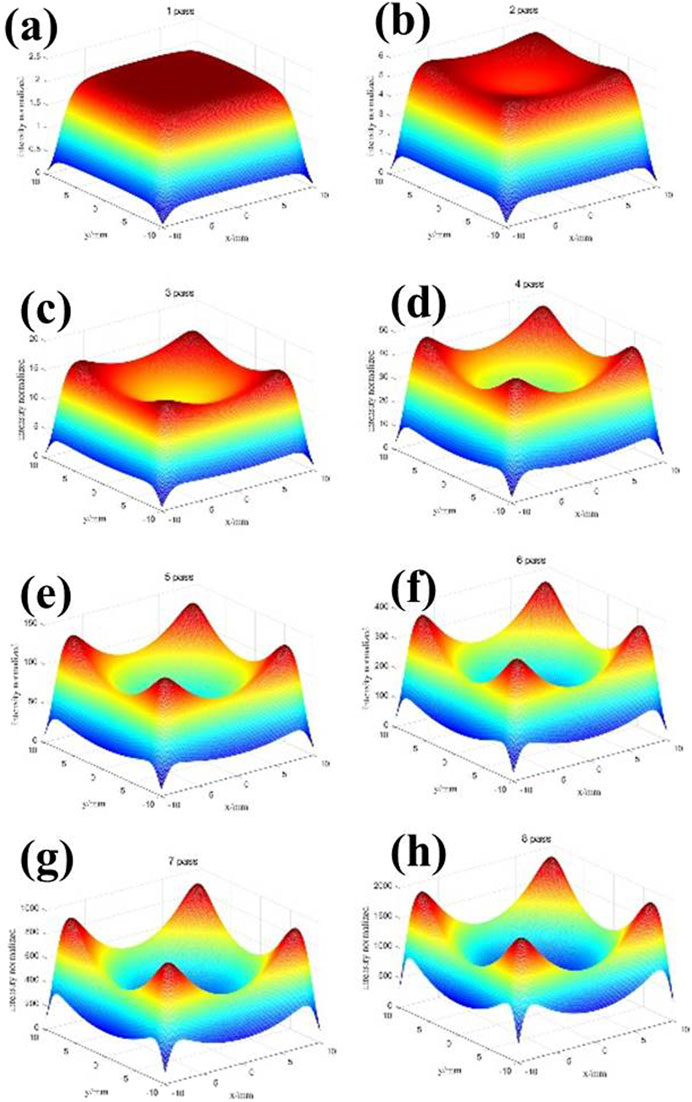
FIGURE 5. Simulated intensity distribution of output beam for single-to eight-pass amplifications. (A–H) single–8 passes.
The experimental setup for the fluorescence distribution measurement included a capture CCD, an imaging lens, and an amplifier. An imaging lens was used to image the fluorescence distribution from the end face of the Nd:glass rod to the CCD detection surface. The charge-coupled device capture system was a silicon camera (VH-4MG2-M20A2). The fluorescence distributions measured at different Nd3+ concentrations are shown in Figure 6. When the Nd3+ concentration was 0.8 wt%, as shown in Figure 6A, the small-signal gain exhibited a flat-top profile. When the Nd3+ concentration was 1.0 wt% or 1.2 wt% (Figures 6B, C, respectively), the small-signal gain exhibited an M-shaped profile.
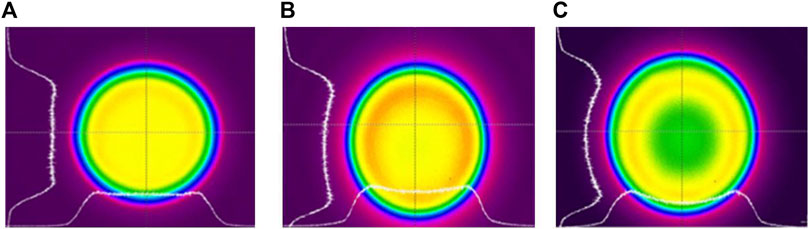
FIGURE 6. Measured fluorescence distribution at different Nd3+ concentrations. (A) 0.8 wt%; (B) 1.0 wt%; and (C) 1.2 wt%.
The output energy is measured as a function of the input energy (Figure 7). For comparison, a theoretical curve is presented in the figure, in which the experimental results are in good agreement with the theoretical values. When the input energy was 0.16 mJ, the output energy was ∼1J.
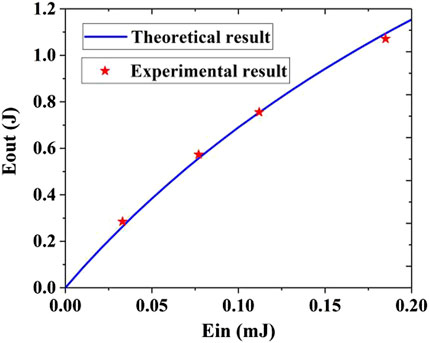
FIGURE 7. Theoretical and experimental output energies as a function of input energy.
The M-shaped output-beam profiles were measured at an energy of approximately 1J (Figure 8A). The intensity at the margin was larger than that at the center. Moreover, the beam intensity was well-distributed in mass, demonstrating the feasibility of the gain-manipulation-based beam-shaping method. Similarly, for a quantitative comparison, the intensity along the diagonal direction is plotted in Figure 8B. The ratio of the intensity at the margin to that at the center was approximately 4.3:1, which matches that of the MAS.
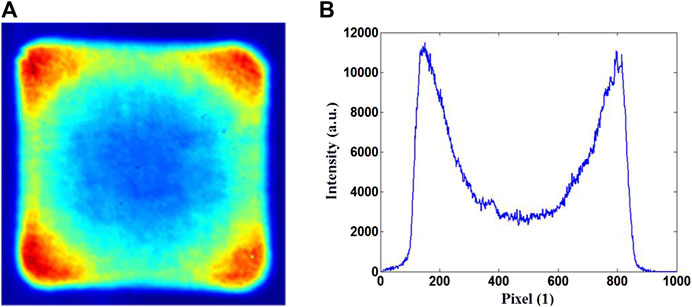
FIGURE 8. Measured M-shaped intensity distribution of output beam from the eight-pass amplifier at 1 J. (A) Near-field pattern; (B) Intensity distribution along the diagonal direction. The ratio of intensity at the margin to that at the center is approximately 4.3:1.
In this study, an M-shaped beam output from an off-axis eight-pass PreAMP was demonstrated. Using the amplification theory, the desired M-shaped small-signal gain coefficient was numerically calculated to match the MSA. Finally, the actual output beam intensity profile was experimentally measured and verified, and it agreed well with the simulation results. The obtained results demonstrate the feasibility of the beam-intensity shaping method based on the accurate selection of the small-signal gain coefficient. The energy efficiency of our method is considerably higher than that of the commonly used LC-SLM beam-shaping technique, particularly for saturated multipass amplifier systems.
The original contributions presented in the study are included in the article/Supplementary Materials, further inquiries can be directed to the corresponding author.
XX: Writing–original draft. KY: Writing–review and editing. SZ: Writing–review and editing.
The author(s) declare financial support was received for the research, authorship, and/or publication of this article. This research is financially supported by National Key Research and Development Program of China under Grant No. 2022YFB3606300.
The authors wish to acknowledge Prof. Qihua Zhu, CAEP, for his help in the experiment.
The authors declare that the research was conducted in the absence of any commercial or financial relationships that could be construed as a potential conflict of interest.
All claims expressed in this article are solely those of the authors and do not necessarily represent those of their affiliated organizations, or those of the publisher, the editors and the reviewers. Any product that may be evaluated in this article, or claim that may be made by its manufacturer, is not guaranteed or endorsed by the publisher.
1. Yamanaka C, Sakabe S. Prospects of high power laser applications. Rev Laser Eng (2002) 30:185–92. doi:10.2184/lsj.30.185
2. Hogan WJ, Moses EI, Warner BE, Sorem MS, Soures JM. The national ignition facility. Nucl Fusion (2001) 41:567–73. doi:10.1088/0029-5515/41/5/309
3. Spaeth ML, Manes KR, Kalantar DH, Miller PE, Heebner JE, Bliss ES, et al. Description of the NIF laser. Fusion Sci Technol (2016) 26(1):25–145. doi:10.13182/fst15-144
4. Zheng WG, Wei XF, Zhu QH, Jing F, Hu DX, Yuan XD, et al. Laser performance upgrade for precise ICF experiment in SG-Ⅲ laser facility. Matter Radiat Extremes (2017) 2:243–55. doi:10.1016/j.mre.2017.07.004
5. Zhu JQ, Chen SH, Zheng YX, Huang GL, Liu RH, Tang XZ, et al. Review on development of shenguang-II laser facility. Chin J Lasers (2019) 46(1):0100002. doi:10.3788/CJL201946.0100002
6. Manes KR, Spaeth ML, Adams JJ, Bowers MW, Bude JD, Carr CW, et al. Damage mechanisms avoided or managed for NIF large optics. Fusion Sci Technol (2016) 69:146–249. doi:10.13182/fst15-139
7. Yao K, Gao S, Tang J, Xie X, Fan C, Lu Z, et al. Off-axis eight-pass neodymium glass laser amplifier with high efficiency and excellent energy stability. Appl Opt (2018) 57:8727–32. doi:10.1364/ao.57.008727
8. Yao K, Xie XD, Tang J, Fan C, Gao S, Lu ZH, et al. Diode-side-pumped joule-level square-rod Nd:glass amplifier with 1 Hz repetition rate and ultrahigh gain. Opt Express (2019) 27(23):32912–23. doi:10.1364/oe.27.032912
9. Wang C, Wei H, Wang J, Huang D, Fan W, Li XC. 1 J, 1 Hz lamp-pumped high-gain Nd: Phosphate glass laser amplifier. Chin Opt Lett (2017) 15:011401–5. doi:10.3788/col201715.011401
10. Bahk SW, Begishev IA, Zuegel JD. Precompensation of gain nonuniformity in a Nd:glass amplifier using a programmable beam-shaping system. Opt Commun (2014) 333:45–52. doi:10.1016/j.optcom.2014.07.054
11. Heebner J, Borden M, Miller P, Stolz C, Suratwala T, Wegner P, et al. A programmable beam shaping system for tailoring the profile of high fluence laser beams. In: 2010 Boulder Conference; September 26, 2010 - September 29, 2010; Boulder, CO, United States (2010). p. 78421C.
12. Heebner J, Borden M, Miller P, Hunter S, Christensen K, Scanlan M, et al. Programmable beam spatial shaping system for the National Ignition Facility. In: SPIE Photonics West; January 22, 2011 - January 27, 2011; San Francisco, CA, United States (2011). p. 7916.
13. Bowers M, Burkhart S, Cohen S, Erbert G, Heebner J, Hermann M, et al. The injection laser system on the National Ignition Facility. In: SPIE Photonics West; January 20, 2007 - January 25, 2007; San Jose, CA, United States (2006). UCRL-PROC-226945.
14. Yao K, Xie XD, Tang J, Fan C, Gao S, Lu ZH, et al. An efficient off-axis multi-pass Nd:glass amplifier utilizing a birefringence crystal. Laser Phys (2018) 27:115002. doi:10.1088/1555-6611/ab44b7
16. Frantz LM, Nodvik JS. Theory of pulse propagation in a laser amplifier. J Appl Phys (1963) 34:2346–9. doi:10.1063/1.1702744
Keywords: Nd:glass preamplifier, off-axis relay-imaging eight-pass amplifier, beam shaping, M-shaped beam profile, flat-beam profile
Citation: Xie X, Yao K and Zhou S (2023) M-shaped beam profile output from an off-axis relay-imaging eight-pass Nd:glass laser preamplifier. Front. Phys. 11:1266374. doi: 10.3389/fphy.2023.1266374
Received: 24 July 2023; Accepted: 21 August 2023;
Published: 08 September 2023.
Edited by:
Xinzhong Li, Henan University of Science and Technology, ChinaReviewed by:
Yulei Wang, Hebei University of Technology, ChinaCopyright © 2023 Xie, Yao and Zhou. This is an open-access article distributed under the terms of the Creative Commons Attribution License (CC BY). The use, distribution or reproduction in other forums is permitted, provided the original author(s) and the copyright owner(s) are credited and that the original publication in this journal is cited, in accordance with accepted academic practice. No use, distribution or reproduction is permitted which does not comply with these terms.
*Correspondence: Ke Yao, eXloMTQzQDE2My5jb20=
Disclaimer: All claims expressed in this article are solely those of the authors and do not necessarily represent those of their affiliated organizations, or those of the publisher, the editors and the reviewers. Any product that may be evaluated in this article or claim that may be made by its manufacturer is not guaranteed or endorsed by the publisher.
Research integrity at Frontiers
Learn more about the work of our research integrity team to safeguard the quality of each article we publish.