Corrigendum: Towards high-resolution quantitative assessment of vascular dysfunction
 Maria Guidi
 Giovanni Giulietti
 Emma Biondetti
 Richard Wise
 Federico Giove
- 1Museo Storico della Fisica e Centro Studi e Ricerche Enrico Fermi, Rome, Italy
- 2Neuroimaging Laboratory, Fondazione Santa Lucia IRCCS, Rome, Italy
- 3Institute for Advanced Biomedical Technologies, University “G. d’Annunzio” of Chieti-Pescara, Chieti, Italy
- 4Department of Neuroscience, Imaging and Clinical Sciences, University “G. d’Annunzio” of Chieti-Pescara, Chieti, Italy
- 5Laboratory of Neurophysics and Neuroimaging (NaN), Fondazione Santa Lucia IRCCS, Rome, Italy
Neurovascular alterations are increasingly recognized as a key feature of many brain diseases. They can manifest as a reduction in resting cerebral blood flow or cerebrovascular reactivity (CVR) in the whole brain or in specific regions, depending on the underlying condition. Neurovascular impairment is observed in hypertension, Alzheimer’s disease, stroke, multiple sclerosis and cerebral small vessel disease. Magnetic resonance imaging (MRI)-derived CVR mapping is a reliable marker of vascular dysfunction and has been performed mainly at standard functional MRI (fMRI) resolutions of 2–3 mm using the blood oxygen level dependent (BOLD) contrast. However, vascular alterations may occur at a finer scale (i.e., in the capillary bed) which would be better characterized with smaller voxel sizes. Capillaries in gray matter deliver oxygen and glucose to neural tissue and are arranged in a mesh structure, with variable density across the cortical depth. Given that the human cortex is, on average, 2.5 mm thick, submillimetric voxel sizes are effective in increasing the spatial specificity of measurements of hemodynamic and metabolic changes. Novel MRI sequences offer the possibility to map physiological parameters at high resolution with relatively simple experimental setups. In particular, pairing the BOLD acquisition with a contrast sensitive to blood volume changes, while administering a mild hypercapnic challenge, allows for simultaneous mapping of CVR, cerebral metabolic rate of oxygen consumption and other relevant parameters at a high resolution and can be performed at the clinical field strength of 3 T. We propose that this approach will help provide crucial insights into vascular impairment.
1 Introduction
Neurodegenerative diseases represent a huge socio-economic burden in aging societies. Magnetic resonance imaging (MRI) offers information about different brain features non-invasively and it is widely employed in the detection of structural damage. Functional alterations, however, may initiate years before anatomical alterations and are important in the picture of disease pathophysiology. Therefore, reliably mapping vascular dysfunction and identifying early biomarkers should aid prevention and catalyze the development of therapies.
MRI contrast based on the blood oxygen level dependent (BOLD) effect is widely exploited in brain research. BOLD-based functional MRI (fMRI) is largely confined to clinical or basic research due to its nonquantitative nature and its dependency on multiple parameters, which are related partly to baseline tissue structure and physiology [1] and partly to underlying dynamic changes in cerebral blood flow (CBF), cerebral blood volume (CBV) and cerebral metabolic rate of oxygen consumption (CMRO2). Other fMRI techniques that have found a comparatively large application in clinical studies are arterial spin labeling (ASL), for quantifying perfusion, and cerebrovascular reactivity (CVR) mapping based on BOLD or ASL. These have been applied to the study of aging, stroke, tumor, dementia, multiple sclerosis, brain injury, arterial stenosis, and more [2].
Other quantitative, less explored, fMRI techniques include vascular-space occupancy (VASO) [3], able to quantify changes in CBV, and calibrated fMRI, which relies on a simple model of the BOLD signal for extracting CMRO2 [4–6]. These techniques have found limited application in disease states, for reasons including the lack of standardized protocols, limited contrast-to-noise and more difficulties in data acquisition and processing compared to BOLD. In this perspective article, we propose that VASO and calibrated fMRI at high resolutions can add valuable information to the picture of vascular impairment because of their straightforward physiological interpretation and their closer link to the microvasculature compared to BOLD [7]. Indeed, many neurodegenerative diseases are accompanied by (or originate from) a microvascular dysfunction, which can be assessed by observing the effects on microvascular parameters (CBF and CBV) or metabolic parameters (CMRO2), as reported, for example, by Klinkmueller et al. in the case of Huntington’s disease [8].
For microvascular assessment, imaging at submillimetric resolution is needed, since the average human cortical thickness is about 2.5 mm [9] and, thus, gray matter (GM) voxels having similar or larger sizes are typically affected by severe partial volume contamination by the surrounding cerebrospinal fluid (CSF) and white matter (WM), which has a different vascularization. Moreover, in terms of vascular density and function, the cortex is organized in a layered structure [10] and it has been shown that voxel sizes of about 0.8 mm are capable of distinguishing layer-specific activation in certain areas based on haemodynamic responses [11].
Calibrated fMRI is currently limited in resolution. In order to calibrate the BOLD signal, in addition to the BOLD contrast, a “vascular” contrast needs to be acquired (usually ASL for mapping CBF) while modulating the arterial partial pressure of carbon dioxide (PaCO2). The experiments are typically performed at low image resolutions (e.g., 3.5 × 3.5 × 3–8 mm3) [12], which are often dictated by the low signal-to-noise ratio (SNR) of ASL sequences.
VASO-fMRI, on the other hand, has been recently proven to be feasible at submillimetric resolutions (0.8 mm) at the clinical field strength of 3 T [13], therefore it represents a good candidate for microvascular state assessment in disease. Additionally, in the framework of calibrated fMRI, it has been shown that the term related to CBF changes can be replaced by a term related to CBV changes (obtainable with VASO) via Grubb’s law, while assuming different coupling exponents for venous and total CBV changes [14, 15]. Therefore, VASO can be used to obtain submillimetric maps of CMRO2 changes [14].
This perspective article is structured as follows: Section 2 focuses on disease states characterized by microvascular impairment; Section 3 describes the parameters that can be derived from MRI in order to assess microvascular dysfunction in such diseases; Section 4 proposes an acquisition protocol and functional paradigm for mapping the parameters listed.
2 The microvascular component in neurodegenerative diseases
While submillimetric VASO and calibrated fMRI have been proven feasible for the characterization of the microvascular component in healthy individuals [13, 14], we suggest that the same methodology may be useful in the study of disease states. A dysfunctional microvasculature is indeed common in many pathological conditions, such as small vessel disease (SVD), vascular dementia, Alzheimer’s disease (AD), ischemic stroke, brain tumors, cerebral amyloid angiopathy (CAA), mild cognitive impairment (MCI), Huntington’s disease, Parkinson’s disease, among others [16]. We focus here on SVD, AD and brain tumors as case studies for investigating microvascular impairment.
2.1 Small vessel disease
Cerebral small vessel disease includes a wide spectrum of cerebrovascular diseases that involve endothelial dysfunction of capillaries, small arteries and small veins in the brain, leading to blood-brain barrier (BBB) dysfunction, impaired vasodilation, vessel stiffening, dysfunctional blood flow and interstitial fluid drainage, WM rarefaction, ischemia, inflammation, myelin damage, and secondary neurodegeneration [17]. The underlying neurobiological mechanisms are, to date, not clear, and SVD is generally assessed by looking at macroscopic or mesoscopic manifestations, such as WM hyperintensities, lacunas, microbleeds, perivascular spaces, or small subcortical infarcts. In terms of hemodynamic measures, a reduction in CVR and CBF has been observed [18]. Given the microvascular nature of the disease, mapping microvascular reactivity and the possible related metabolic impairment can help clarify the underlying mechanisms and pathological effects of the observed alterations [19].
2.2 Alzheimer’s disease
AD is characterized by amyloid-β accumulation and impaired CVR [20], but the relationship between these alterations is not clear. One hypothesis is that amyloid-β accumulation may directly induce vascular dysfunction by impairing vasorelaxation, but therapies aimed at amyloid-β plaque reduction are not effective in reversing cognitive decline [21].
Another hypothesis identifies the microvasculature and related inflammatory processes as fundamental in the pathogenesis of AD [22]. In particular, a CBF reduction is currently the earliest known change associated with the disease, and the mechanism behind it might be a pericyte-driven constriction of capillaries [23]. It is hypothesized that this constriction and the associated hypoperfusion are the precursors of amyloid-β accumulation via upregulation of the BACE1 enzyme. Capillary dysfunction and microvascular CVR reduction were additionally observed to be associated with symptom severity [24, 25], and resting CMRO2 was found to be reduced in a calibrated BOLD study in AD patients [26].
2.3 Brain tumors
Brain tumors are accompanied by strong alterations in the vasculature (e.g., angiogenesis), which often lead to a local disruption in the neurovascular coupling, also termed neurovascular uncoupling (NVU). Even low grade brain tumors show some degree of NVU [27]. In practice, this may cause a reduced or absent BOLD response to functional tasks in the region affected, even if neuronal activation is present [28]. Distinguishing regions of NVU from regions effectively lacking neuronal response is very important in presurgical planning to avoid excess surgical resection [27, 28]. In place of task-based BOLD fMRI, CVR mapping is generally preferred as it relies on a purely vascular stimulus. CVR mapping was found to be superior (i.e., able to identify NVU regions also in low and intermediate brain gliomas) to perfusion mapping with T2* dynamic susceptibility contrast [27]. Increasing spatial resolution in CVR maps and adding a vascular contrast (such as CBV-weighted) is important for precise localization and characterization of the tissue affected.
3 Quantitative parameters for high resolution mapping of vascular dysfunction
In the following, we list quantitative fMRI-derived parameters useful in the study of neurovascular disease and that can be mapped at high resolution at 3 T.
3.1 Cerebral blood volume
Mapping of CBV with MRI without the use of contrast agents can be achieved with vascular-space occupancy [3]. VASO is an inversion recovery technique exploiting the different T1 of blood and tissue (T1,tissue < T1,blood) for creating a contrast sensitive to CBV changes. In the original VASO formulation the images were acquired at the time of blood nulling [3], while more recent implementations showed that different inversion times can be used, as long as a difference in the T1 weighting of the two compartments is achieved [29, 30]. When the vasculature dilates, either following a metabolic demand of the tissue or a vasodilatory stimulus, the volume of blood in a responding voxel increases. VASO measures quantitative changes in blood volume, which can be expressed as a percentage change or in volume units, but VASO does not quantify baseline CBV.
The slice-saturation slab-inversion VASO (SS-SI-VASO) [31], developed at 7 T, permits the acquisition of gradient-recalled echo (GRE)-BOLD and VASO contrasts interleaved by adding a second excitation pulse at each repetition time (TR). VASO demonstrated a high specificity for the capillaries, arterioles and intracortical arteries [32, 33], making it a valuable tool for high-resolution fMRI [34]. Recently, the VASO implementation acquiring BOLD volumes concomitantly has been adapted for high-resolution applications at 3 T, where it has been shown capable of distinguishing layer-dependent activation [13], thus reflecting a microvascular sensitivity.
Using the VASO sequence requires some effort in setting up a working protocol, dealing with the lower SNR and longer TRs compared to BOLD, as well as a less standardized data processing. Examples of protocols for submillimetric acquisitions can be found at https://github.com/layerfMRI/Sequence_Github/tree/master/3T.
3.2 Cerebrovascular reactivity
Cerebrovascular reactivity (CVR) reflects the capacity of brain vessels to dilate or constrict in response to a vasoactive stimulus. MRI-based CVR is generally expressed as percent BOLD or ASL signal change per mmHg change in end-tidal carbon dioxide (EtCO2) [2]. Despite the relative simplicity of the measure, it is one of the most reliable MRI-derived predictors of cerebrovascular impairment and has been applied in the study of several diseases, including SVD and AD [2, 35, 36].
Since GRE-BOLD signal changes are heavily weighted towards the venous macrovasculature, both due to an inherent weighting towards larger vessels and to dHb-containing compartments [37], CVR maps based on such contrast show similar features. In order to target microvascular CVR, different sequences should be employed, such as ASL, spin-echo (SE)-BOLD, or VASO. In particular, VASO-based CVR could be interesting due to the high resolutions achievable and the observed stability to hypercapnic stimuli [14]. In one study, VASO reactivity was found to be more negative (i.e., larger CBV increase) in patients with carotid artery disease compared to healthy controls [38].
3.2.1 Vasodilatory stimuli
CVR mapping with MRI can be achieved with administration of carbon dioxide (CO2)-enriched gas [2], breath holding [39] or amplitude of resting-state fluctuations in CO2 [40]. CVR mapping has been performed at a variety of spatial resolutions, determined by the BOLD or ASL acquisition protocol used. For CVR mapping at high resolution, inhalation of a CO2-enriched gas mixture (typically 5% CO2) is preferable over the other approaches because it gives the strongest increase in CBF and thus improves the contrast-to-noise ratio (CNR), while being safe and well tolerated [41]. A few studies have indeed successfully mapped CVR at voxel sizes below 2 mm using breathing manipulations [2, 42]. In particular, a recent study by Schellekens et al. reports depth-dependent profiles of CVR using GRE-BOLD and SE-BOLD, showing a detectable variation with cortical depth [15].
3.3 Cerebral metabolic rate of oxygen consumption
BOLD signal changes in a voxel during a task of interest can be modeled according to Eq. 1 [4]:
where CBVv is the CBV contributing to BOLD signal changes (“venous” CBV), M is the calibration parameter which corresponds to the maximum BOLD signal change (BOLD = M for complete deoxy-hemoglobin washout from the vasculature), β is a magnetic-field dependent exponent, and the subscript 0 indicates quantities at baseline.
It is generally assumed that CBV and CBF are coupled via Eq. 2:
where α is a coupling constant, often taken to be equal to 0.38 [43].
The goal of calibrated fMRI is isolating the CMRO2 term from the Eq. 1: to this end, a pure CBF or CBV sensitive contrast needs to be acquired in addition to BOLD, and the calibration parameter M needs to be estimated. For extracting M a vasoactive, isometabolic (CMRO2/CMRO2,0 ∼ 1) stimulus is used, which introduces a BOLD dependency only on CBF or CBV (measurable) if Eq. 2 is assumed [4, 5].
Most calibrated fMRI studies use ASL sequences for mapping CBF and extract CBV via Eq. 2. Since the technique allows for voxelwise mapping, the resolution achievable by ASL at 3 T dictates the resolution of CMRO2 maps. For submillimetric applications, CBV mapping can be used and CBF changes estimated by Eq. 2, while assuming a different coupling exponent for venous and total CBV changes [14, 15].
Other approaches for CMRO2 mapping have been introduced using different gas mixtures or without exogenous gas manipulations. Existing acquisition techniques and modelling approaches have been recently reviewed [44, 45].
4 Functional paradigms for multiparametric mapping at high resolution
Given the sequences currently available, we propose that it is possible to obtain, in less than 30 min at 3 T, submillimetric maps of 1) BOLD-based CVR; 2) VASO-based CVR; 3) the calibration parameter M; 4) relative changes in CMRO2 elicited by a task of interest; 5) BOLD signal changes elicited by the same task; 6) VASO signal changes elicited by the same task.
To this end, the use of the VASO sequence with a 3D readout [13] has shown to be suitable for submillimetric fMRI at 3 T.
Figure 1 shows the activation maps obtained for two tasks using the same acquisition protocol. The sequence used was the 3 T VASO [13] with the following acquisition parameters: isotropic nominal resolution = 0.9 mm, matrix size = 188 × 188 × 28, echo time (TE) = 21.2 ms, TR = 3.9 s (this refers to the time it takes to acquire a BOLD-VASO pair of volumes), 210 measurements (210 BOLD volumes and 210 VASO volumes), partial Fourier = 6/8, GRAPPA = 3, bandwidth = 1,026 Hz/Px, echo spacing = 1.1 ms, inversion delay = 550 ms, flip angle = 30° with a variable flip angle scheme [13], water selective excitation achieved with long binomial 1-1 pulses. The acquisition was performed on a Siemens Prisma 3 T (Siemens Healthineers, Erlangen, Germany) scanner and a 32-channel head coil. Informed consent was obtained according to international standards, the study was approved by the Ethical Committee of Fondazione Santa Lucia, CE/2022_010.
FIGURE 1
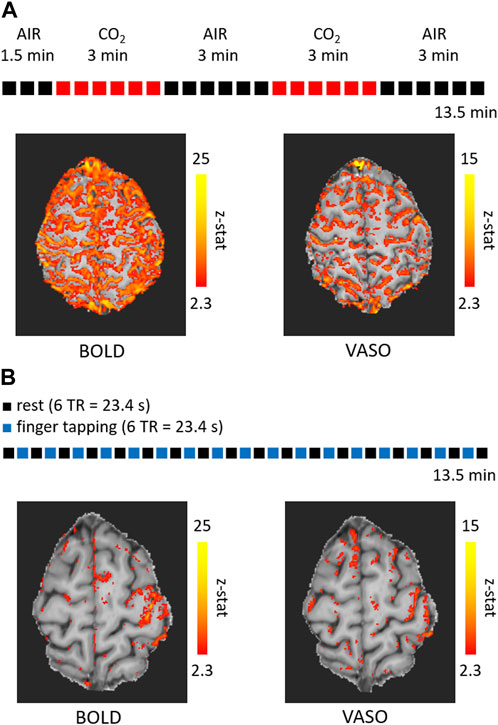
FIGURE 1. Activation maps overlaid on the mean of the VASO timecourse obtained with the acquisition of 210 pairs of volumes (210 BOLD volumes and 210 VASO volumes) at a isotropic resolution of 0.9 mm for a breathing paradigm involving hypercapnia (A) and a right-hand finger tapping task (B). The duration was 13.5 min (TR = 3.9 s) for each run.
One acquisition was performed during a breathing challenge consisting of an alternation of medical air and 5%-CO2-enriched air administration (Figure 1A), for a total acquisition time of 13.5 min. The other acquisition was performed during a functional task consisting of an alternation of right-hand finger tapping for 6 TRs and rest for 6 TRs (Figure 1B). For both acquisitions, the timecourses were corrected for motion using the ASL toolbox based on SPM [46, 47]. Statistical activation maps were obtained using FSL FEAT [48] and z-stats are reported in Figure 1. A detectable activation was present for both contrasts and conditions, with BOLD generating larger clusters as expected. The submillimetric voxel size of 0.9 mm allows to have 2 to 4 voxels within the gray matter thickness and to reduce partial voluming with the neighboring CSF and WM. Nevertheless, the large BOLD signal changes following the pial venous vasculature are located outside the GM and reduce the spatial specificity. VASO signal changes have in general a lower amplitude and are more affected by noise, which result in smaller clusters as in Figure 1, while the specificity of the signal changes is less compromised by the pial vasculature (more clearly visible in Figure 1B).
This preliminary dataset confirms that it is possible to have a statistically significant response in both BOLD and VASO timecourses for a functional run of 13.5 min (210 BOLD-VASO pairs of volumes).
With the two datasets referred to in Figure 1, the signal changes in BOLD and VASO upon hypercapnia can be used to estimate the calibration parameter M across gray matter from Eq. 1 (assuming Eq. 2), and the signal changes in BOLD and VASO elicited by the finger tapping task can then be used to estimate changes in CMRO2 from the same equation, once M has been calculated.
4.1 Limitations
The proposed multiparametric acquisition can offer a multi-faceted window into microvascular dysfunction, by mapping vascular and metabolic features concomitantly at 3 T and at voxel volumes below 1 mm3.
The submillimetric VASO sequence has been introduced only recently at 3 T and has some limitations. First of all, the low SNR of 10–20 [13] limits its flexibility: tasks associated with small effect sizes are hard to detect, unless the acquisition time is largely increased. Moreover, the generation of the VASO contrast has some timing constraints that impact the TR duration: the typical TR is about 4–5 s (for the acquisition of a full BOLD-VASO pair) for slab protocols.
Additionally, the breathing challenge could create excessive discomfort in patient populations, both due to wearing a mask and being in a hypercapnic state. Therefore, it is important to familiarize each subject with the gas challenge prior to scanning. An earlier study showed an increase in participant dropouts for AD patients compared to healthy control for the breathing challenge [26].
While CVR mapping is reliable and has been applied in disease, the same does not hold for calibrated fMRI. Calibrated BOLD models rely on several assumptions, which, even at typical image resolutions, might not be a good approximation of the real underlying mechanisms. Such limitations could be exacerbated at higher resolutions where the spatial heterogeneity of the vasculature is resolved. Most notably, the flow-volume coupling expressed by Grubb’s relationship is unlikely to hold true with the same exponent for small voxel sizes and between healthy subjects and patients. Therefore, differences in CMRO2 between a healthy group and a disease group could stem from a disrupted CBF-CBV coupling rather than a true metabolic difference. To avoid such bias, imaging CBF, CBV, and BOLD concomitantly [8] is preferable, but CBF mapping via arterial spin labeling at high resolution is challenging [49], therefore studying the flow-volume coupling relationship experimentally in humans is difficult.
If using VASO in the calibrated BOLD framework, the CBV at baseline needs to be assumed. A fixed fraction of 5.5% [50] might be acceptable considering that the microvascular blood density, which is the major factor responsible for VASO signal changes for short stimulations, is relatively homogeneous across the cortical depth [10, 51]. During hypercapnic stimulations, however, the fraction of VASO signal change coming from venous blood increases [52], challenging the assumption of a fixed baseline blood fraction.
Finally, the assumption of isometabolism during gas administration has been challenged in several studies. Although there is not a definitive answer, some evidence suggests a reduction, rather than an increase, in CMRO2 of up to 13% during a 5%-CO2 gas challenge [53]. However, this value depends on the concentration of arterial CO2 and on the length of the respiratory challenge, with shorter epochs having less impact on CMRO2 [2].
5 Discussion and conclusion
We propose that, to obtain more insight into neurovascular diseases, several contrasts and approaches sensitive to microvascular function should be used at 3 T and at submillimetric resolutions. The acquisition scheme that we propose here involves the use of VASO at 3 T (BOLD and CBV-weighted contrast interleaved) with a gas manipulation inducing hypercapnia, and a functional task. Scanning under these conditions for less than 30 min makes it feasible to obtain maps of BOLD and VASO signal changes for each condition, CVR, regional CMRO2 changes and M at a submillimetric resolution.
Data availability statement
The raw data supporting the conclusion of this article will be made available by the authors, without undue reservation.
Ethics statement
The studies involving humans were approved by the Ethical Committee of Fondazione Santa Lucia. The studies were conducted in accordance with the local legislation and institutional requirements. The participants provided their written informed consent to participate in this study. Written informed consent was obtained from the individual(s) for the publication of any potentially identifiable images or data included in this article.
Author contributions
MG: Conceptualization, data collection and analysis, writing. GG: Conceptualization, data analysis, writing. EB, RW, and FG: Conceptualization, writing.
Funding
MG is funded by Regione Lazio POR-FESR 2014-2020 A0375-2020-36648, “FISASMEM—Fisiologia dell'aging: sviluppo di metodi MRI quantitativi.” This work was partially conducted under the framework of the Departments of Excellence 2018-2022 initiative of the Italian Ministry of Education, University and Research for the Department of Neuroscience, Imaging and Clinical Sciences (DNISC) of the University of Chieti-Pescara, Italy. This work was partially funded by European Union—Next Generation EU, by Ministero della Salute—Ricerca Corrente Linea 1 and Regione Lazio; Ministero dell'Istruzione, dell'Università e della Ricerca; European Commission. This project has received funding from the European Union's Horizon Europe research and innovation programme under the Marie Skłodowska-Curie Grant Agreement No. 101066055—acronym HERMES. Views and opinions expressed are however those of the author(s) only and do not necessarily reflect those of the European Union or the European Research Executive Agency (REA). Neither the European Union nor the granting authority can be held responsible for them.
Acknowledgments
We would like to thank Laurentius Huber, Harald E. Möller, and Lasse Knudsen for helpful discussion and support.
Conflict of interest
The authors declare that the research was conducted in the absence of any commercial or financial relationships that could be construed as a potential conflict of interest.
Publisher’s note
All claims expressed in this article are solely those of the authors and do not necessarily represent those of their affiliated organizations, or those of the publisher, the editors and the reviewers. Any product that may be evaluated in this article, or claim that may be made by its manufacturer, is not guaranteed or endorsed by the publisher.
Abbreviations
AD, Alzheimer’s disease; ASL, arterial spin labeling; BBB, blood-brain barrier; BOLD, blood oxygen level dependent; CAA, cerebral amyloid angiopathy; CBF, cerebral blood flow; CBV, cerebral blood volume; CMRO2, cerebral metabolic rate of oxygen consumption; CO2, carbon dioxide; CSF, cerebrospinal fluid; CVR, cerebrovascular reactivity; EtCO2, end-tidal CO2; fMRI, functional magnetic resonance imaging; GM, gray matter; GRE, gradient echo; M, calibration parameter; MCI, mild cognitive impairment; MRI, magnetic resonance imaging; NVU, neurovascular uncoupling; PaCO2, arterial partial pressure of CO2; SE, spin echo; SNR, signal-to-noise ratio; SS-SI-VASO, slice-saturation slab-inversion VASO; SVD, small vessel disease; T1, longitudinal relaxation time; TE, echo time; TR, repetition time; VASO, vascular-space occupancy; WM, white matter.
References
1. Lu H, Zhao C, Ge Y, Lewis-Amezcua K. Baseline blood oxygenation modulates response amplitude: Physiologic basis for intersubject variations in functional MRI signals. Magn Reson Med Official J Int Soc Magn Reson Med (2008) 60:364–72. doi:10.1002/mrm.21686
2. Liu P, De Vis JB, Lu H. Cerebrovascular reactivity (CVR) MRI with CO2 challenge: A technical review. Neuroimage (2019) 187:104–15. doi:10.1016/j.neuroimage.2018.03.047
3. Lu H, Golay X, Pekar JJ, Van Zijl PC. Functional magnetic resonance imaging based on changes in vascular space occupancy. Magn Reson Med Official J Int Soc Magn Reson Med (2003) 50:263–74. doi:10.1002/mrm.10519
4. Davis TL, Kwong KK, Weisskoff RM, Rosen BR. Calibrated functional MRI: Mapping the dynamics of oxidative metabolism. Proc Natl Acad Sci (1998) 95:1834–9. doi:10.1073/pnas.95.4.1834
5. Hoge RD, Atkinson J, Gill B, Crelier GR, Marrett S, Pike GB. Investigation of BOLD signal dependence on cerebral blood flow and oxygen consumption: The deoxyhemoglobin dilution model. Magn Reson Med Official J Int Soc Magn Reson Med (1999) 42:849–63. doi:10.1002/(sici)1522-2594(199911)42:5<849::aid-mrm4>3.0.co;2-z
6. Bulte DP, Kelly M, Germuska M, Xie J, Chappell MA, Okell TW, et al. Quantitative measurement of cerebral physiology using respiratory-calibrated MRI. Neuroimage (2012) 60:582–91. doi:10.1016/j.neuroimage.2011.12.017
7. Iannetti G, Wise RG. BOLD functional MRI in disease and pharmacological studies: Room for improvement? Magn Reson Imaging (2007) 25:978–88. doi:10.1016/j.mri.2007.03.018
8. Klinkmueller P, Kronenbuerger M, Miao X, Bang J, Ultz KE, Paez A, et al. Impaired response of cerebral oxygen metabolism to visual stimulation in Huntington’s disease. J Cereb Blood Flow Metab (2021) 41:1119–30. doi:10.1177/0271678x20949286
9. von Economo CF, Koskinas GN. Die cytoarchitektonik der hirnrinde des erwachsenen menschen. New York City: J. Springer (1925).
10. Duvernoy HM, Delon S, Vannson JL. Cortical blood vessels of the human brain. Brain Res Bull (1981) 7:519–579. doi:10.1016/0361-9230(81)90007-1
11. Bandettini PA, Huber L, Finn ES. Challenges and opportunities of mesoscopic brain mapping with fMRI. Curr Opin Behav Sci (2021) 40:189–200. doi:10.1016/j.cobeha.2021.06.002
12. Sleight E, Stringer MS, Marshall I, Wardlaw JM, Thrippleton MJ. Cerebrovascular reactivity measurement using magnetic resonance imaging: A systematic review. Front Physiol (2021) 12:643468. doi:10.3389/fphys.2021.643468
13. Huber L, Kronbichler L, Stirnberg R, Ehses P, Stoecker T, Fernandez-Cabello S, et al. Evaluating the capabilities and challenges of layer-fMRI VASO at 3T. Aperture Neuro (2023) 3:1–17. doi:10.52294/001c.85117
14. Guidi M, Huber L, Lampe L, Gauthier CJ, Möller HE. Lamina-dependent calibrated BOLD response in human primary motor cortex. Neuroimage (2016) 141:250–61. doi:10.1016/j.neuroimage.2016.06.030
15. Schellekens W, Bhogal AA, Roefs EC, Báez-Yáñez MG, Siero JC, Petridou N. The many layers of BOLD. The effect of hypercapnic and hyperoxic stimuli on macro-and micro-vascular compartments quantified by CVR, M, and CBV across cortical depth. J Cereb Blood Flow Metab (2023) 43:419–32. doi:10.1177/0271678x221133972
16. Chen JJ. Functional MRI of brain physiology in aging and neurodegenerative diseases. Neuroimage (2019) 187:209–25. doi:10.1016/j.neuroimage.2018.05.050
17. Wardlaw JM, Smith C, Dichgans M. Small vessel disease: Mechanisms and clinical implications. Lancet Neurol (2019) 18:684–96. doi:10.1016/s1474-4422(19)30079-1
18. Paschoal AM, Secchinatto KF, da Silva PHR, Zotin MCZ, Dos Santos AC, Viswanathan A, et al. Contrast-agent-free state-of-the-art MRI on cerebral small vessel disease—part 1. ASL, IVIM, and CVR. NMR Biomed (2022) 35:e4742. doi:10.1002/nbm.4742
19. Zwanenburg JJ, van Osch MJ. Targeting cerebral small vessel disease with MRI. Stroke (2017) 48:3175–82. doi:10.1161/strokeaha.117.016996
20. Cantin S, Villien M, Moreaud O, Tropres I, Keignart S, Chipon E, et al. Impaired cerebral vasoreactivity to CO2 in Alzheimer's disease using BOLD fMRI. Neuroimage (2011) 58:579–87. doi:10.1016/j.neuroimage.2011.06.070
21. Andrieu S, Coley N, Lovestone S, Aisen PS, Vellas B. Prevention of sporadic alzheimer's disease: Lessons learned from clinical trials and future directions. Lancet Neurol (2015) 14:926–44. doi:10.1016/s1474-4422(15)00153-2
22. Steinman J, Sun H-S, Feng Z-P. Microvascular alterations in Alzheimer's disease. Front Cell Neurosci (2021) 14:618986. doi:10.3389/fncel.2020.618986
23. Korte N, Nortley R, Attwell D. Cerebral blood flow decrease as an early pathological mechanism in Alzheimer's disease. Acta Neuropathologica (2020) 140:793–810. doi:10.1007/s00401-020-02215-w
24. Nielsen RB, Egefjord L, Angleys H, Mouridsen K, Gejl M, Møller A, et al. Capillary dysfunction is associated with symptom severity and neurodegeneration in Alzheimer's disease. Alzheimer's Demen (2017) 13:1143–53. doi:10.1016/j.jalz.2017.02.007
25. Jellinger K, Attems J. Prevalence and impact of cerebrovascular pathology in Alzheimer's disease and parkinsonism. Acta Neurol Scand (2006) 114:38–46. doi:10.1111/j.1600-0404.2006.00665.x
26. Lajoie I, Nugent S, Debacker C, Dyson K, Tancredi FB, Badhwar A, et al. Application of calibrated fMRI in Alzheimer's disease. NeuroImage: Clin (2017) 15:348–58. doi:10.1016/j.nicl.2017.05.009
27. Pillai JJ, Zacà D. Comparison of BOLD cerebrovascular reactivity mapping and DSC MR perfusion imaging for prediction of neurovascular uncoupling potential in brain tumors. Tech Cancer Res Treat (2012) 11:361–74. doi:10.7785/tcrt.2012.500284
28. Agarwal S, Sair HI, Pillai JJ. The problem of neurovascular uncoupling. Neuroimaging Clin (2021) 31:53–67. doi:10.1016/j.nic.2020.09.003
29. Ciris PA, Qiu M, Constable RT. Non-invasive quantification of absolute cerebral blood volume during functional activation applicable to the whole human brain. Magnet Reson Med (2014) 71:580–90. doi:10.1002/mrm.24694
30. Huber L, Finn ES, Chai Y, Goebel R, Stirnberg R, Stöcker T, et al. Layer-dependent functional connectivity methods. Prog Neurobiol (2021) 207:101835. doi:10.1016/j.pneurobio.2020.101835
31. Huber L, Ivanov D, Krieger SN, Streicher MN, Mildner T, Poser BA, et al. Slab-selective, BOLD-corrected VASO at 7 Tesla provides measures of cerebral blood volume reactivity with high signal-to-noise ratio. Magnet Reson Med (2014) 72:137–48. doi:10.1002/mrm.24916
32. Akbari A, Bollmann S, Ali TS, Barth M. Modelling the depth-dependent VASO and BOLD responses in human primary visual cortex. Hum Brain Mapp (2023) 44:710–26. doi:10.1002/hbm.26094
33. Lu H, van Zijl PC. A review of the development of Vascular-Space-Occupancy (VASO) fMRI. Neuroimage (2012) 62:736–42. doi:10.1016/j.neuroimage.2012.01.013
34. Huber L, Handwerker DA, Jangraw DC, Chen G, Hall A, Stüber C, et al. High-resolution CBV-fMRI allows mapping of laminar activity and connectivity of cortical input and output in human M1. Neuron (2017) 96:1253–63.e7. e7. doi:10.1016/j.neuron.2017.11.005
35. Chen JJ. Cerebrovascular-reactivity mapping using MRI: Considerations for Alzheimer’s disease. Front Aging Neurosci (2018) 10:170. doi:10.3389/fnagi.2018.00170
36. Blair GW, Doubal FN, Thrippleton MJ, Marshall I, Wardlaw JM. Magnetic resonance imaging for assessment of cerebrovascular reactivity in cerebral small vessel disease: A systematic review. J Cereb Blood Flow Metab (2016) 36:833–41. doi:10.1177/0271678x16631756
37. Uludağ K, Müller-Bierl B, Uğurbil K. An integrative model for neuronal activity-induced signal changes for gradient and spin echo functional imaging. Neuroimage (2009) 48:150–65. doi:10.1016/j.neuroimage.2009.05.051
38. Donahue MJ, Jan van Laar P, Van Zijl PC, Stevens RD, Hendrikse J. Vascular space occupancy (VASO) cerebral blood volume-weighted MRI identifies hemodynamic impairment in patients with carotid artery disease. J Magn Reson Imaging Official J Int Soc Magn Reson Med (2009) 29:718–24. doi:10.1002/jmri.21667
39. Urback AL, MacIntosh BJ, Goldstein BI. Cerebrovascular reactivity measured by functional magnetic resonance imaging during breath-hold challenge: A systematic review. Neurosci Biobehavioral Rev (2017) 79:27–47. doi:10.1016/j.neubiorev.2017.05.003
40. Golestani AM, Wei LL, Chen JJ. Quantitative mapping of cerebrovascular reactivity using resting-state BOLD fMRI: Validation in healthy adults. Neuroimage (2016) 138:147–63. doi:10.1016/j.neuroimage.2016.05.025
41. Spano VR, Mandell DM, Poublanc J, Sam K, Battisti-Charbonney A, Pucci O, et al. CO2 blood oxygen level–dependent MR mapping of cerebrovascular reserve in a clinical population: Safety, tolerability, and technical feasibility. Radiology (2013) 266:592–8. doi:10.1148/radiol.12112795
42. Bhogal AA, Philippens ME, Siero JC, Fisher JA, Petersen ET, Luijten PR, et al. Examining the regional and cerebral depth-dependent BOLD cerebrovascular reactivity response at 7 T. Neuroimage (2015) 114:239–48. doi:10.1016/j.neuroimage.2015.04.014
43. Grubb RL, Raichle ME, Eichling JO, Ter-Pogossian MM. The effects of changes in PaCO2 cerebral blood volume, blood flow, and vascular mean transit time. Stroke (1974) 5:630–9. doi:10.1161/01.str.5.5.630
44. Chen JJ, Uthayakumar B, Hyder F. Mapping oxidative metabolism in the human brain with calibrated fMRI in health and disease. J Cereb Blood Flow Metab (2022) 42:1139–62. doi:10.1177/0271678x221077338
45. Germuska M, Wise RG. Calibrated fMRI for mapping absolute CMRO2: Practicalities and prospects. Neuroimage (2019) 187:145–53. doi:10.1016/j.neuroimage.2018.03.068
46. Wang Z, Aguirre GK, Rao H, Wang J, Fernández-Seara MA, Childress AR, et al. Empirical optimization of ASL data analysis using an ASL data processing toolbox: ASLtbx. Magn Reson Imaging (2008) 26:261–9. doi:10.1016/j.mri.2007.07.003
47. Ashburner J, Barnes G, Chen C-C, Daunizeau J, Flandin G, Friston K, et al. SPM12 manual. London, UK: Wellcome Trust Centre for Neuroimaging (2014). p. 2464.
48. Jenkinson M, Beckmann CF, Behrens TE, Woolrich MW, Smith SM. Fsl. Neuroimage (2012) 62:782–90. doi:10.1016/j.neuroimage.2011.09.015
49. Hernandez-Garcia L, Aramendía-Vidaurreta V, Bolar DS, Dai W, Fernández-Seara MA, Guo J, et al. Recent technical developments in ASL: A review of the state of the art. Magnet Reson Med (2022) 88:2021–42. doi:10.1002/mrm.29381
50. Lu H, Hua J, van Zijl PC. Noninvasive functional imaging of cerebral blood volume with vascular-space-occupancy (VASO) MRI. NMR Biomed (2013) 26:932–48. doi:10.1002/nbm.2905
51. Schmid F, Barrett MJ, Jenny P, Weber B. Vascular density and distribution in neocortex. Neuroimage (2019) 197:792–805. doi:10.1016/j.neuroimage.2017.06.046
52. Hua J, Liu P, Kim T, Donahue M, Rane S, Chen JJ, et al. MRI techniques to measure arterial and venous cerebral blood volume. Neuroimage (2019) 187:17–31. doi:10.1016/j.neuroimage.2018.02.027
Keywords: BOLD, fMRI, VASO, calibrated fMRI, CMRO2, CVR, SVD, AD
Citation: Guidi M, Giulietti G, Biondetti E, Wise R and Giove F (2023) Towards high-resolution quantitative assessment of vascular dysfunction. Front. Phys. 11:1248021. doi: 10.3389/fphy.2023.1248021
Received: 26 June 2023; Accepted: 14 September 2023;
Published: 27 September 2023.
Edited by:
Ewald V. Moser, Medical University of Vienna, AustriaReviewed by:
Jun Hua, Johns Hopkins University, United StatesCopyright © 2023 Guidi, Giulietti, Biondetti, Wise and Giove. This is an open-access article distributed under the terms of the Creative Commons Attribution License (CC BY). The use, distribution or reproduction in other forums is permitted, provided the original author(s) and the copyright owner(s) are credited and that the original publication in this journal is cited, in accordance with accepted academic practice. No use, distribution or reproduction is permitted which does not comply with these terms.
*Correspondence: Federico Giove, ZmVkZXJpY28uZ2lvdmVAdW5pcm9tYTEuaXQ=