 Jerome Faillettaz
- GéoCod Team, CEREMA, Bron, France
Forecasting the imminent failure of natural slopes is crucial for effective Disaster Risk Reduction. However, the nonlinear nature of geological material failure makes predictability challenging. Recent advancements in seismic wave monitoring and analysis offer promising solutions. In this study, we investigated the co-detection method, which involves real-time processing of micro-seismic events detected concurrently by multiple sensors, to provide easy access to their initial magnitude and approximate location. By studying the Fiber Bundle Model and considering the attenuation of seismic waves, we demonstrated disparities in the statistical behavior of various rupture types before global catastrophic failure. Comparing avalanches with attenuated seismic wave amplitudes directly measured at sensor locations, we observed differences in their evolution towards catastrophic rupture. Leveraging a network of seismic wave sensors, we showed that the co-detection method was effective in detecting precursory seismic events, even with weak signals, making it a valuable tool for monitoring and predicting unstable slopes. Additionally, we demonstrated that a multi-threshold analysis of co-detection activity allowed for instantaneous capture of the seismic activity structure on unstable slopes. These findings contribute to our understanding of slope stability and offer insights for improved hazard assessment and risk management.
1 Introduction
Geophysical ruptures—or gravity-driven instabilities—range from landslides, rockfalls and mountain collapse to glacier break-offs or snow avalanches. Although rare, such phenomena can lead to natural disasters and represents an important class of natural hazards in mountainous regions.
The potential damages (human fatalities or economic loss) can be huge, especially when the initial instability is at the origin of a chain of processes (cascading effects, [1]), involving other materials such as water (floods), debris (debris-mud flows) [2], or snow. Between 2004 and 2016, more than 55,000 deaths were attributed to landslide phenomena alone, and overall losses were estimated to be USD 20 billion annually [3, 4].
These numbers will presumably increase in the near future as ongoing climate change is expected to lead to an increase in precipitation, melting of ice and permafrost in the Alps, variations in the hydrological cycle, extreme weather, short-duration heavy downpours (storms), and other meteorological events [4]. An increasing trend was already observed in fatalities and occurrence of fatal landslides worldwide [5–7].
Active or passive mitigation measures are expensive and therefore not always possible in developing countries. Moreover, in the case of extreme magnitude phenomena, mitigation becomes useless to ensure population safety. A reliable forecasting combined with a timely evacuation of the endangered areas remains the most effective way to cope with such natural disasters. In the last decades, efforts were carried out by the geo-scientist community to improve slope stability assessment of gravity-driven instabilities, leading to recent advances in local slope early warning systems [8]. Typically, such systems acquire and monitor changes in both environmental conditions (i.e., rainfall, temperature, soil moisture content, pore water pressure) and kinematic (i.e., slope movement, geometrical changes) data [9]. They are based on different monitoring strategies (ground-based or remote sensing) [8], as well as on a variety of methods and techniques [for a review, see [10]], possibly involving long-term monitoring of event precursors [11].
However, the nonlinear nature of geological material failure hampered by inherent heterogeneity, unknown initial mechanical state, and complex load application (rainfall, temperature, etc.) hinders predictability.
Recently, a new simple strategy for early warning systems based on the evolution of an internal parameter, i.e., seismic characterization, was proposed. The aim is to continuously monitor and analyze seismic waves generated by a potential instability before the failure. This method aims at capitalizing on both heterogeneity and seismic wave attenuation properties of natural media: A natural material is heterogeneous, and when subjected to stress, its weakest part will break first, generating thus an elastic wave that travels through the material. Capturing and monitoring micro-seismic activity offers valuable information concerning the progression of damage and imminence of global catastrophic failure [12, 13]. Monitoring seismic activity was already applied to natural gravity-driven instabilities such as cliff collapse [14], slope instabilities [15–17], glacier break-off [18] or failure in snow pack [19, 20].
However, to our knowledge, such a seismic method has never been used for early warning purposes yet, facing the problems of both real-time big data processing, and energetic considerations (autonomy, performance, communication) of sensors in harsh natural environment. To cope with these problems, [21] proposed a new method - called co-detection method - to detect emergence of large events announcing impeding failure (precursors) based on a simple idea: As an elastic waves travel in the material, their amplitudes decay with distance from the source. An event (i.e., a crack formation in the material) may also be observed and recorded differently by an acoustic/seismic sensor depending on its location. Real-time processing of measured events that are detected concurrently on more than one sensor (co-detected) would then enable easy access to their initial magnitude as well as their approximate initial location. This simple method may provide a straightforward means to access characteristics and temporal evolution of surrogate variables linked to damage and mechanical state of the natural slope.
The aim of this work is to explore the co-detection strategy and its potential for early warning purposes. Specifically, we plan to characterize the behavior of the co-detection number as a function of the imminence of catastrophic failure and to assess slope stability for all types of ruptures, from brittle to ductile.
To achieve this, we propose to reinvestigate the Fiber Bundle Model, which is the simplest model of rupture for heterogeneous materials, trying to characterize what seismic (or acoustic) sensors can measure (accounting also for attenuation phenomenon). In particular, we are interested in the properties of elastic energy radiated as a fiber (or group of fibers) fails and propagates to the sensor. Previous studies, such as [22], have shown that avalanches and radiated elastic energy are not strictly equivalent in brittle rupture and may have different size frequency distributions. Additionally, [23] demonstrated that the correlation between avalanche size (related to strain) and the corresponding energy bursts (related to AE amplitude) decreases as load redistribution localization increases in a local load-sharing fiber bundle model in one and two dimensions. Recently, [24] confirmed these numerical results experimentally by showing that local strain (measured through x-ray imaging) and the corresponding acoustic emission AE amplitudes could be uncorrelated. As in reality, the only accessible measurable parameter will be the attenuated amplitude of the radiated elastic energy through a seismic wave at the location of the sensor, we propose to investigate the statistics of the attenuated amplitude on a seismic network of sensors to model the evolution of the co-detection numbers as the catastrophic rupture of the bundle approaches (by analogy to the rupture of a natural slope).
By introducing attenuation and evaluating radiated energy during the progression of damage, we will be able to characterize the evolution of co-detection as the rupture progresses. We can then evaluate the benefits of this method and discuss the results from an experimental perspective and for early warning purposes.
After presenting an overview of the model and methodology utilized in Section 2, this study proceeds by examining the relationship between average emitted energy and avalanche size in Section 3.1.1. The aim is to characterize any potential correlation between these two variables. Furthermore, the evolution of the avalanche size frequency distribution (Section 3.1.2) and the attenuated amplitude (Section 3.1.3) is analyzed as the system approaches its final catastrophic rupture. These analyses provide valuable insights into the feasibility of utilizing seismic measurements for early warning purposes. Section 3.2 introduces the co-detection method, exploring its potential for enhancing the analysis and understanding of the ongoing instability. In this section, the application of multi-threshold analysis is also explored, offering new perspectives for early warning systems. Finally, the results are discussed in Section 4, focusing particularly on their implications for early warning systems. A critical evaluation is undertaken, highlighting the significance of the findings and their potential contributions to the field.
2 Model and method
Several models for heterogeneous material failure and fracturing exist in the literature such as fiber bundle model, random fuse model, the Burridge-Knopoff (spring block) model, cellular automaton, (see [25–27] for a review). We selected the Fiber Bundle Model for several reasons: First, its simplicity and generality make it a useful framework for systematically studying processes preceding global failure [26, 28–32]. Second, this framework provides a means to quantitatively study precursory seismic signals preceding catastrophic rupture, as the discrete nature of failure events offers a direct link with acoustic emissions that are suggested for monitoring such progressive failures [12, 33]. Third, Fiber Bundle Model exhibits different kinds of rupture behaviors, ranging from brittle to ductile fracture, through a limited number of parameters. Such models offer a valuable framework to study the different types of rupture behavior observed in nature.
2.1 Fiber bundle model
2.1.1 General description
Our study was performed using the Fiber Bundle Model developed in [13, 21]: We considered a set of parallel elasto-brittle fibers assembled on a square regular lattice with periodical boundary conditions. The fibers exhibit a linear-elastic behavior, with a Young modulus E [Pa] arbitrarily set to E = 1, followed by an abrupt failure at a prescribed critical threshold load (or strength) termed σth. The values of σth were drawn from a prescribed probability distribution, i.e., uniform, Weibull or lognormal distribution. An external load was applied quasi-statically to the fiber bundle, ensuring a separation in time scales between external loading and internal stress redistribution. As soon as the load of a single fiber exceeded its strength σth, the fiber failed irreversibly. The load previously carried by this failing fiber was subsequently redistributed equally to intact surviving fibers, possibly causing a cascade of further fiber failures called “avalanches”.
Different rules of load distribution could be applied, either a global load sharing rule (“democratic” Equal Load Sharing, denoted here as DFBM) or local load sharing to nearest intact neighbors (Local Load Sharing, denoted here as LFBM). We considered two modes of local load sharing [34], the nearest 4 neighbors on a square lattice (denoted as LFBM4) or eight nearest neighbors (denoted as LFBM8) that also accounted for the diagonal neighbors (Figure 1). Note that if a fiber concerned with load redistribution had already failed, the neighbors to the “crack” formed by the connected failed fibers (using LFBM4 or LFBM8 scheme respectively) were then considered for the redistribution [13], as illustrated in Figures 1B, D.
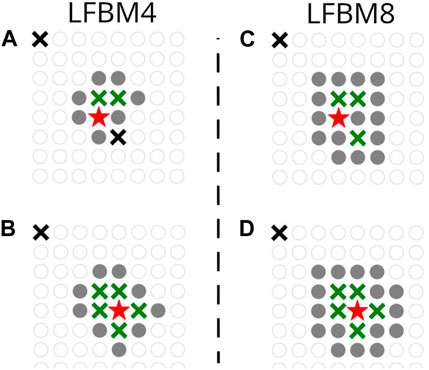
FIGURE 1. Illustration of the redistribution rule for the LFBM4 (A, B) and LFBM8 (C, D) on a 8 × 8 lattice at different stages of external loading. Empty gray circles represent the fibers. The large thick crosses indicate the already failed fibers. The large red star indicates the failed fiber considered for load redistribution. The thick crosses in green represent the fiber connected to the failed fiber, forming the “crack” according to the four- (A, B) or eight- (C, D) neighbor scheme. The filled gray circles represent the fibers to which load will be redistributed in the next step. Note that periodic boundary conditions connect opposite borders, enabling a large crack to form. As evidenced here, long-range load redistribution is possible, depending only on the geometrical characteristics of the cluster formed by failed fibers.
Note also that more complex modes of local load sharing exist, which redistribute stress based on the distance to the failed fiber [35–37]. In this study, we assumed the simplest possible mechanical behavior for each fiber (elasto-brittle). However, other FBM studies considered for more complex mechanical behavior, such as the work of [33] which accounted for healing or viscous properties of snow.
For the global load sharing (DFBM) no stress concentration occurred anywhere around failed fibers because the load of already broken fibers was redistributed on all the surviving fibers. Conversely, for Local Load Sharing (LFBM), stress concentration was observed as the load was redistributed around the crack, i.e., the patch of intact neighbors. Decreasing the number of possible neighbors (from 8 to 4) will increase the effect of stress concentration around the crack tip.
The three load redistribution rules studied here were expected to model the different modes of failure in heterogeneous natural materials, ranging from brittle-like rupture (LFBM4) to ductile-like rupture (DFBM).
Note that, along with the range of interaction, the strength of disorder also influences the mechanical response of the bundle [38, 39]. Increasing amounts of disorder gives rise to a transition from brittle to ductile fracture and a more intensive precursory activity.
In the following, we will only deal with a random uniform distribution of initial fiber strengths, but with different redistribution rules (DFBM, LFBM4 and LFBM8) and different bundle sizes ranging from 642 to 10242 fibers to study the co-detection method.
2.1.2 Attenuation phenomenon
The amplitude of acoustic waves propagating in natural media decreases with distance from the source due to various phenomena, such as geometrical spreading, absorption or scattering [21]. Introduced signal attenuation into the load-controlled FBM with equal and local load-sharing, which was developed by [13]. The amplitude attenuation was computed for each fiber failure burst (i) assuming that the amplitude is proportional to the burst size s and (ii) accounting for geometrical spreading only (decrease of amplitude with
with xi being the position of the failing fiber i in the avalanche s.
However, the definition of amplitude in this equation (measured as the number of failed failure) strictly refers to the opening up of a fractured surface, i.e., the area of the crack, not to the amplitude of the elastic wave generated by the strain energy released by each failed fibers composing the avalanche.
2.2 Model development
2.2.1 Attenuated amplitude
In practice, seismic sensors are installed on potentially unstable slopes to record seismic waves amplitudes reaching their location. However, the avalanches s studied in the model are not strictly speaking the seismic wave amplitude as they do not account for energy stored in the failed fibers. To properly characterize this amplitude using our FBM, the first step is to compute elastic energy radiated from the failure of the fibers composing the avalanche.
For an avalanche of size s, if n fibers with strength values
As the energy transported by a wave is directly proportional to the square of the amplitude of the wave, each rupture of a fiber of strength
Combining Eqs 1–3, it follows that an avalanche of size s will generate an amplitude Aatt(s) at the sensor location xsensor, expressed as:
where xi being the position of the failing fiber i with its associated strength
During the maturation of the catastrophic rupture, the location of the failed fibers xi in an avalanche Sj and their associated applied load
2.2.2 Co-detection procedure
The number of co-detections associated with each avalanche was evaluated by setting a “virtual” network of sensors on the bundle. The attenuated amplitude could be evaluated at any sensor location using Eq. 4. If the attenuated amplitude at the sensor location was greater than a predefined detection threshold Thr (which could refer to the sensitivity of a sensor
For this study, we arbitrary considered a network of virtual sensors that are arranged in a grid-like pattern with seven rows and seven columns, resulting in a total of 49 sensors. The sensors were also placed at regular intervals throughout the grid to ensure even spacing.
3 Results and analysis
Before exploring the co-detection strategy and its potential for early warning purposes, it is essential to have a comprehensive understanding of the statistical properties of avalanches and their associated radiated energy for all redistribution schemes (DFBM, LFBM4 and LFBM8). Although the Fiber Bundle Model has been extensively studied, we specifically aim to investigate the distinctions between avalanches (the number of fibers failing simultaneously), emitted energy (the total elastic energy radiated during fiber failure in an avalanche), and attenuated amplitude (the directly measured field quantity).
To accomplish this, our study will begin by examining the general relationship between avalanches and their corresponding radiated energy. Subsequently, we will analyze the size frequency distribution of both avalanches and attenuated amplitudes. By doing so, we can provide a clear assessment of the potential utility of seismic measurements in assessing slope stability. Additionally, these findings will offer valuable insights when discussing the results of the co-detection analysis.
3.1 Avalanche, energy and attenuated amplitude
3.1.1 Relationship between energy and avalanche size
[22] demonstrated that avalanche size and energy burst size were not correlated in Fiber Bundle Model with local local sharing (LFBM) in 1D. This theoretical result was recently confirmed in a rock deformation experiment: [24] indicated that local strain (measured through x-ray imaging) and the corresponding acoustic emission (AE) amplitudes could be uncorrelated. [23] also showed a decrease in the correlation between avalanche size and the corresponding energy bursts with an increase in the load redistribution localization in the fiber bundle model in one and two dimensions.
Following [22, 23], we first investigated the relationship between average emitted energy
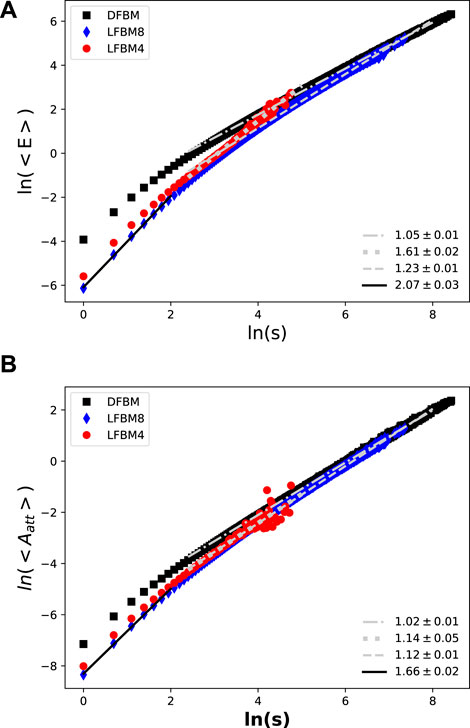
FIGURE 2. Relationship between avalanche size and (A) average emitted energy, (B) average attenuated amplitude at one location for DFBM, LFBM4 and LFBM8 for a bundle of size 5122 and 1000 different runs.
As expected, the average emitted energy was directly proportional to avalanche size for DFBM for large values of
For DFBM, i.e., no stress concentration, we observed
On the other hand, for LFBM4, the bundle broke long before we observed any linear behavior between s and
Accounting now for attenuation phenomenon, we performed the same analysis to assess the relationship between average attenuated amplitude and avalanche size. Results are shown in Figure 2B. We observed the following behavior:
We showed that the average attenuated amplitude was proportional to avalanche size for DFBM in the same way as average emitted energy and slightly non linear in LFBM cases (γ = 1.14 ± 0.05 for LFBM4 and γ = 1.12 ± 0.01 for LFBM8). Note also slightly lower non linear behavior than averaged radiated energy for small avalanches (γ = 1.52 ± 0.04 for LFBM4 and γ = 1.66 ± 0.02 for LFBM8).
These results indicate that avalanche size in the Fiber Bundle Model could not be directly considered as a proxy for seismic measurements or acoustic emission measurements, especially in natural systems where attenuation and stress concentration phenomena coexist. This implies that the relationship between avalanche size and seismic or acoustic signals might not be straightforward. Furthermore, our results suggest that avalanche size and attenuated amplitude may not exhibit the same statistical behavior. This discrepancy could have significant implications for the potential of early warning systems. In the following sections, we studied the statistical behaviors of these two metrics and explore how they evolve as the system approaches global rupture.
3.1.2 Avalanche size distribution
In the initial phase, our investigation focused on analyzing the frequency distribution of avalanche sizes (SFD) for various stress redistribution schemes, namely, DFBM, LFBM4, and LFBM8. Our primary objective was to understand the evolution of these distributions leading up to the final catastrophic rupture.
To assess the influence of bundle size on our results, we initially computed the global frequency distribution of avalanche sizes, considering all avalanches that occurred during the simulation. We conducted this analysis for different bundle sizes ranging from 642 to 10242 fibers. The results, which involved stacking 1,000 simulations for each configuration (DFBM, LFBM4, and LFBM8), can be observed in the insets of Figure 3.
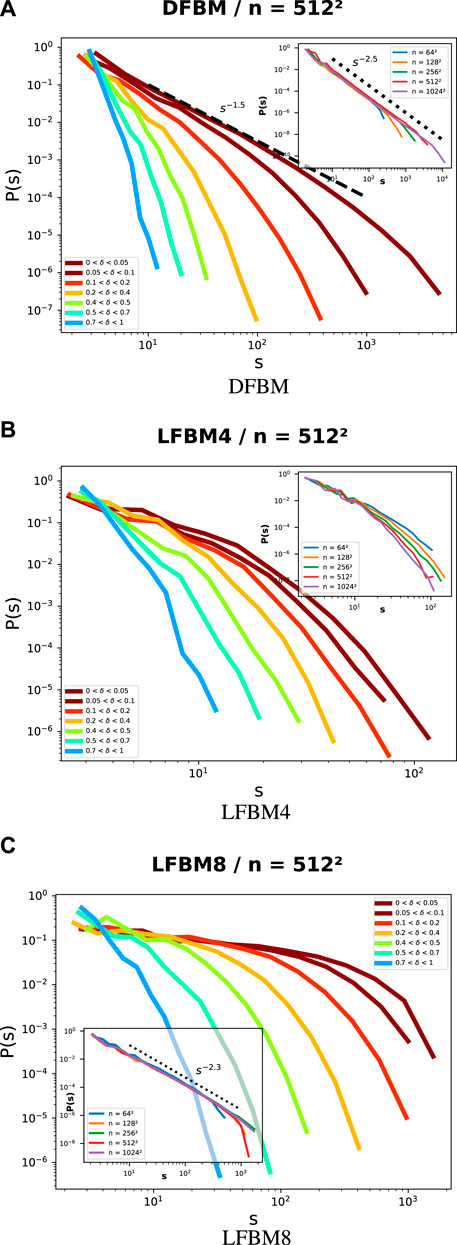
FIGURE 3. Evolution towards final catastrophic rupture of avalanche size distribution (s) for (A) DFBM (B) LFBM4 and (C) LFBM8, with
Furthermore, to gain insights into how the distribution of avalanche sizes changed as the system approached macro-failure, we calculated the size frequency distribution (SFD) within successive bins of the control parameter δ. In our stress-controlled simulations, we employed
The failure dynamics of the DFBM have been analyzed for a long time, both analytically and numerically by several distinguished groups ranging from engineering, physics to applied mathematics (see [40] for a review) [31, 41]. demonstrated that the global avalanche size distribution (accounting for all the avalanches in the simulation) follows a power law with an exponent −5/2 for a wide class of disorder distributions, including uniform random distribution. This behavior is illustrated in the inset of Figure 3A.
When considering the evolution towards global failure, the SFD appeared to change prior to global failure. Larger avalanches appeared and the simulated power law exponent decreased to 3/2 (Figure 3A) as the system was approaching catastrophic rupture, in agreement with analytical results for ductile-like rupture (DFBM, [42]). This crossover behavior was suggested to be a useful tool for prediction purposes, as this change in avalanche size distribution could announce catastrophic failure of the bundle, and, by analogy the failure of the heterogeneous material [42, 43].
The change in avalanche size distribution became less pronounced as stress concentration phenomenon became stronger (Figures 3B, C). For LFBM4 (Figure 3B), no clear power-law behavior of avalanche size could be found (although [44] claimed a −4.8 and [22] an exponential behavior for 1D LFBM). The size effect seemed to play a role, with an exponential cutoff.
For LFBM8 (Figure 3C), the global distribution of avalanche sizes followed a power-law distribution with an exponent of −2.3 (inset of Figure 3C that considers all the avalanches during all simulations), which was similar to that observed in DFBM. However, as the system approached global failure, a significant difference in the behavior of LFBM8 is evidenced: The size frequency distribution (SFD) of LFBM8 underwent a drastic change, displaying an almost uniform distribution of avalanche sizes over a range of approximately 2 orders of magnitude. This drastic shift in the SFD suggests a fundamental difference in the behavior of LFBM8 compared to DFBM near the point of global failure. The near-uniform distribution of avalanche sizes implies that, at low δ, small and large avalanches occur with similar probabilities. In other words, the system becomes more susceptible to both small and large events as it approaches the point of rupture. This particular behavior observed in LFBM8 could be attributed to the specific stress redistribution mechanism employed in this model. As stress accumulated and reached critical levels, the redistribution of stress became more uniform throughout the material. This equalization of stress distribution could enable the occurrence of avalanches of various sizes, thereby resulting in the observed nearly uniform SFD.
Note that avalanche sizes in LFBM4 are almost two order of magnitude smaller than in DFBM and LFBM8, confirming that brittle rupture produce less precursory activity than ductile like failure.
3.1.3 Attenuated amplitude distribution
By evaluating the attenuated amplitude using Eq. 4 at a specific location, we were able to perform a statistical analysis on the attenuated amplitude. The size frequency distribution (SFD) of attenuated amplitudes for different δ intervals is presented in Figure 4, with the inset showing the overall SFD for the 1,000 stacked simulations conducted with varying numbers of fibers ranging from 642 to 10242. The frequency distribution of attenuated amplitudes was found to depend on the lattice size.
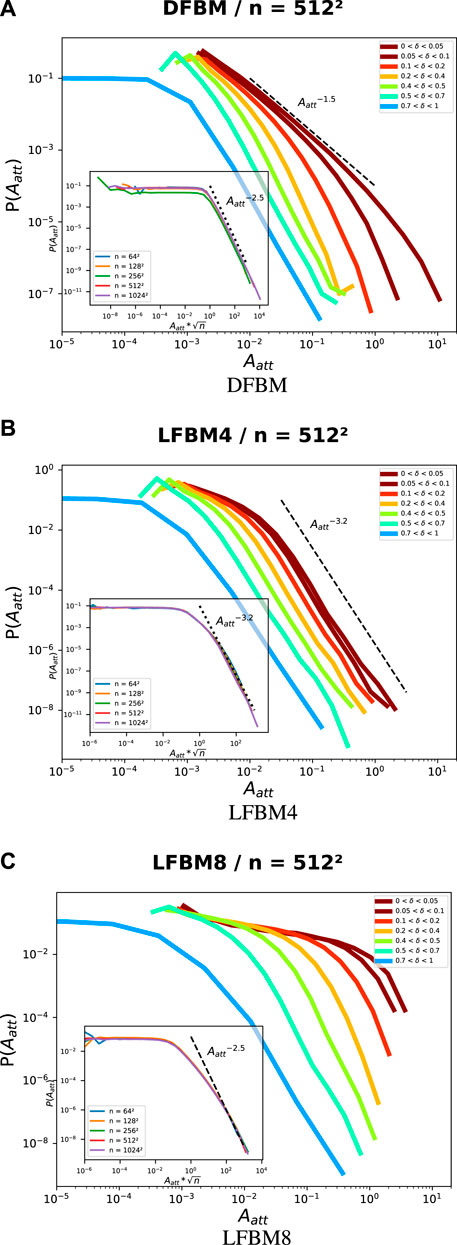
FIGURE 4. Evolution towards final catastrophic rupture of attenuated amplitude distribution evaluate at ine location (s) for (A) DFBM (B) LFBM4 and (C) LFBM8, with
The best collapse of SFD for attenuated amplitude is obtained when plotting for the different lattice sizes P(Aatt) versus
For DFBM, as shown in Figure 4A, a similar behavior was observed for the SFD of attenuated amplitude. The distribution followed a power-law pattern with an exponent of −5/2 for the entire simulation duration (as seen in the inset). When approaching rupture, a crossover behavior similar to that of avalanches was observed, with a power-law exponent of −3/2.
In the case of LFBM4, a difference in behavior between avalanches and attenuated amplitude was evidenced. Figure 4B showed that the attenuated amplitude exhibited a power-law distribution with an exponent of −3.2, while the avalanches did not follow a power-law distribution. This finding aligns with the results reported in [22], which demonstrated the scale-free nature of energy burst distributions in local load sharing with an exponent of −3.5. When approaching rupture, no drastic change in the distribution of attenuated amplitude was observed, although a slight increase in the mean amplitude was evident.
Similar qualitative results between avalanches and attenuated amplitudes were observed for LFBM8: the global distribution of attenuated amplitude exhibited a power law behavior with exponent of −2.5 with similar evolution of SFD as macro rupture was approaching.
Contrary to the SFD of avalanches, a uniform distribution was noticeable for low attenuated amplitudes in all redistribution schemes (insets in Figure 4), typically below Aatt < 10–4. However, this behavior was only observed for δ values greater than 0.7, and it reflected the initial uniform distribution of fiber strengths: At the early stages of the loading process and for such low amplitudes, the weakest fibers broke first without interacting with others, leading to independent failures and an almost unchanged stress field. This resulted in a uniform distribution of attenuated amplitudes in this range.
Comparing SFD from avalanches (Figure 3) and attenuated amplitudes (Figure 4), our results suggested that avalanches (analogous to a measure of a crack area) and attenuated amplitudes (analogous to a measure of seismic wave recorded at a specific location) exhibited different statistical behaviors, especially when approaching macro failure. Notably, the change in SFD is less pronounced for attenuated amplitudes, particularly in cases of brittle-like rupture (Figure 4B). Additionally, the maximum attenuated amplitude remained relatively consistent across all redistribution schemes, in contrast to avalanches where the maximum sizes in LFBM4 were an order of magnitude smaller compared to DFBM and LFBM8. This raises the question of whether the increase in maximum seismic events before catastrophic failure could be utilized for early warning purposes.
Based on these results, we now would like to quantify the effectiveness of the co-detection strategy [21] for all type of rupture present in nature, including both brittle to ductile-like rupture. To do so, we used attenuated amplitudes (analogous to the amplitude of elastic wave measured at a sensor location) and a network of “virtual” sensors (see Section 2.2.2 for more details).
3.2 Co-detection of attenuated amplitudes
3.2.1 Co-detection and imminence of global failure
By setting an arbitrary detection threshold, which corresponds to the minimum amplitude of the elastic wave that can be detected by a sensor, and using method described in Section 2.2.2, simultaneous detections (co-detection number) could be evaluated as macro-failure approached. The averaged co-detection number
with
To investigate the influence of sensor sensitivity on the evolution of the co-detection number, this type of analysis was performed using different detection thresholds: Figure 5 shows the mean co-detection number
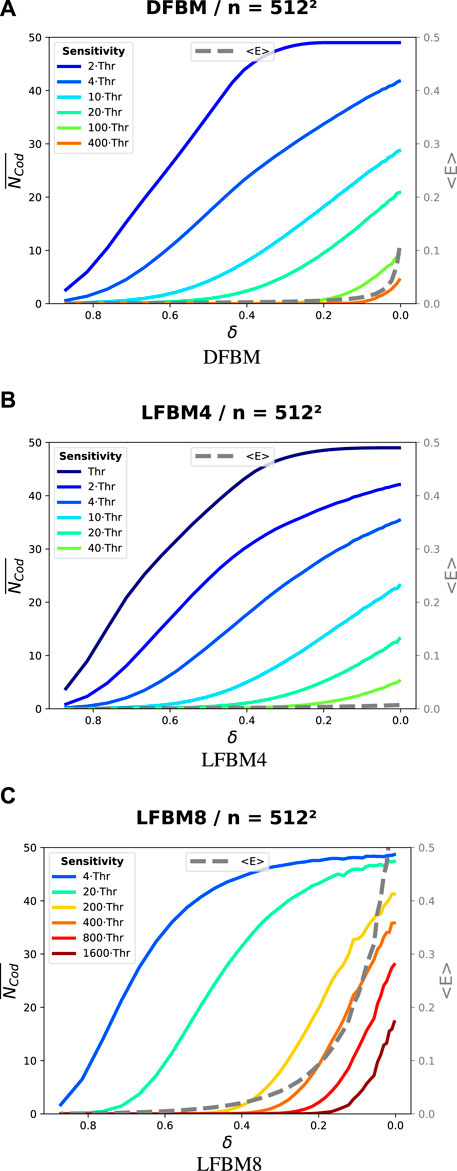
FIGURE 5. Evolution towards final catastrophic rupture of the mean number of codetection (averaged on 1,000 simulations) for different sensor sensitivity (indicated as multiple of detection threshold Thr in legend) for (A) DFBM (B) LFBM4 and (C) LFBM8 with 5122 fibers, with
Figure 5 showed that the mean total radiated energy (dashed lines in Figure 5) was significantly higher in ductile-like rupture (DFBM) than in brittle-like rupture (LFBM4). Moreover, a clear increase in seismic activity was observed prior to global failure in ductile-like failure whereas brittle failures occurred abruptly with only a few seismic precursors.
When considering the evolution of the co-detection number for different sensor sensitivities, a clear decrease was observed as detection threshold increased. In other words, small avalanches or those occurring far from some sensors were no longer detected due to the attenuation phenomenon. In all types of rupture, provided a sufficiently low detection threshold,
These results suggest that a network of sensitive sensors is able to detect the initiation of the maturation process towards final catastrophic rupture but fails to provide a valuable metric for assessing imminence of global failure. On the contrary, as network of sensors with low sensitivity only detects seismic activity in the vicinity of the rupture, making possible to assess slope stability. However, if the sensitivity is too low, such network could also fail to detect any signal before rupture, especially in brittle cases where seismic activity is expected to be quite low.
Nevertheless, these two extreme cases provide valuable information on the process of destabilization, either high sensitivity showing a high number of co-detection indicating that the failure maturation process is initiated or low sensitivity indicating imminence of rupture.
Interestingly, when comparing the progression of the number of co-detection
3.2.2 Co-detection multi-threshold analysis to infer imminence of global failure
From a practical perspective, if each sensor is able of recording and transmitting the maximum amplitude of each detected signal, it would be possible to perform an additional multi-threshold re-analysis of the data: By re-analyzing the co-detections using different thresholds and with sufficient sensitivity, it would be possible to artificially increase the detection threshold and fine-tune the system to detect only seismic activity preceding the macro failure, that is, the instability.
As a change in the detection threshold obviously affects the evolution of co-detections prior global failure and could potentially indicate an impeding catastrophic failure, we analyzed how the co-detection activity is affected by a change in detection threshold, which could be of interest for early warning purposes.
We evaluated how a change in the sensitivity, expressed through a change in detection threshold (Thr), affected
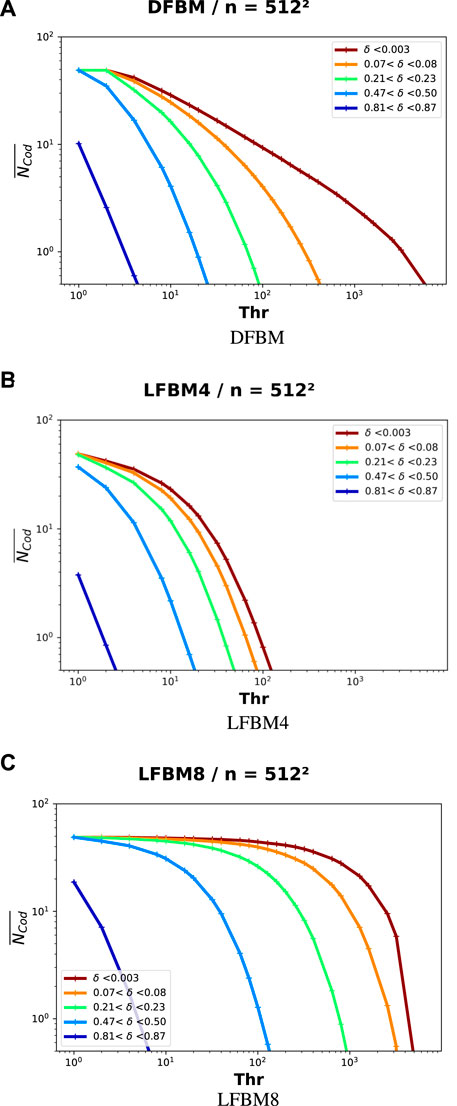
FIGURE 6. Averaged number of codetection
The comparison between the co-detection structure and the evolution of SFD of attenuated amplitude (Figure 4) reveals striking similarities, highlighting the close relationship between the two. Specifically, the structure of co-detection appears to reflect the evolution of the SFD almost exactly.
This finding has important implications for seismic activity monitoring, as it suggests that the multi-threshold analysis of co-detection provides an instantaneous means of capturing the statistical properties of the attenuated amplitudes. This approach can be used to monitor the evolution of seismic activity towards instability, providing a simple yet powerful means of detecting the onset of global failure.
Moreover, multi-threshold analysis of co-detection provides an instantaneous snapshot of the statistical structure of the seismic activity, which can be useful for early warning purposes. By detecting changes in the co-detection structure, the system can alert operators to potential impending failures, allowing them to take appropriate action to prevent catastrophic events.
Overall, these findings highlight the potential of multi-threshold analysis of co-detection for seismic activity monitoring and early warning systems. The ability to capture the statistical properties of the attenuated amplitudes in real-time provides a powerful tool for detecting the onset of instability and preventing catastrophic events.
4 Discussion
4.1 Model
This study revisited the model initially introduced by [13] and elaborated upon by [21]. We thus implemented local load sharing using both the 4 and 8 neighbors schemes. As illustrated by the Figure 1, the concept of local load sharing involves the redistribution of load among neighboring fibers connected to the “crack” formed by the failed fibers, utilizing either the LFBM4 or LFBM8 scheme. The extent of load redistribution during the simulation can vary depending on the geometry of the cluster formed by these connected failed fibers. To gain deeper insights into the role of load redistribution, it would be valuable to further investigate a power-law load redistribution approach, similar to the one employed by [35]. This approach would allow for the tuning of the exponent value to enable a continuous interpolation between local and global load sharing.
The attenuation phenomenon was modeled in a very simple way, accounting only for geometrical spreading and neglecting both intrinsic (anelastic) attenuation and scattering attenuation [45]. In reality, seismic wave attenuation in a natural medium is expected to be much more pronounced and dependent on various factors such as the frequency content of the wave, the quality factor (depending on the medium of propagation), the velocity model, and the nature of the wave (body wave or surface wave). Despite this simplification, it provided a convenient starting point for testing the co-detection strategy using FBM. It’s worth noting that attenuation is likely underestimated in this approach, leading to the filtering out of small waves in reality. These small waves would not be detected due to their low amplitudes at the sensor positions, resulting in reduced co-detection activity, especially for events with low amplitudes and a low number of co-detections. However, since the co-detection method primarily focuses on capturing and characterizing the largest events, higher attenuation is not expected to significantly change the overall outcomes.
The co-detection analysis was conducted using a deliberately high number of 49 (7*7) virtual sensors. This choice of the number of virtual sensor’s number was made intentionally to facilitate a comprehensive examination of co-detection dynamics and to clearly observe an increase in the co-detection count as the global rupture of the bundle was approached. Since this analysis was carried out on various lattice sizes, ranging from 642 to 10242, the relative density of virtual sensors in the bundle decreased as lattice size increased. Nevertheless, consistent results were observed across all lattice sizes, indicating that the number of virtual sensors, while arbitrary, does not substantially impact the key findings of this study.
One of the intriguing findings from this study was the relatively minor discrepancies in the co-detection behavior of LFBM4 and DFBM, even though their avalanche size distributions exhibited noticeable differences, and their total radiated energy before catastrophic failure displayed very distinct patterns (3.2.1). This unanticipated behavior could be qualitatively attributed to the existence of clustered avalanche patterns preceding global failure. To validate this hypothesis, it is essential to conduct a surrogate analysis that involves a careful comparison between the LFBM4 data and an equivalent null-model (with identical statistical properties). This rigorous analysis will help provide empirical evidence to either support or refute the notion of clustered avalanche patterns playing a role in the observed co-detection behavior.
4.2 Practical perspectives
To ensure separation in time scales between external loading and internal stress redistribution, the external load was applied quasi-statically. Time is thus not present in these simulations. This might have two primary implications: Firstly, while we have modeled the progression of rupture, in reality, destabilization can naturally stop due to changes in internal geometry, water level, thermal conditions and other environmental factors. This non-uniform progression of rupture is a critical factor that needs to be considered when analyzing seismic activity and estimating slope stability. The analysis needs to take into account the possibility of such non-uniform progression and incorporate appropriate measures to address it. Secondly, this study does not account for the time it takes for seismic waves to propagate from the source to a specific location, as propagation velocity in our analysis is not considered in our analysis. In practice, seismic waves travel at velocities on the order of kilometers per second, such as around 8 km/s for P-waves in granite. Consequently, from a practical perspective, a post-processing analysis that considers the timing of detection in relation to both sensor spacing and estimated wave velocity would be necessary to classify a detection as part of a co-detected event group.
The number of sensors required for such an analysis depends on the size and complexity of the slope being monitored. While a higher number of sensors can provide more accurate and detailed results, it may not always be feasible or necessary to use a large number of sensors. It is possible to perform such an analysis with fewer sensors, for example, 10, but it would require a more sophisticated analysis technique.
In reality, some sensors may be situated outside the endangered zone. These sensors might detect fewer events compared to those located inside the destabilized area. However, the presence of sensors outside the unstable slope would not impact the analysis and would additionally offer a rough estimation of the extent of the instability. Furthermore, since these sensors will also capture earthquakes, they would provide valuable complementary information to directly filter out the global background seismic activity.
The detection capability of the network depends on both the sensitivity of individual sensors and also on the signal-to-noise ratio (SNR): Detection can only occur if the signal’s amplitude at the sensor location is higher than the background noise. If the background noise is too high, it can alter the detection and saturate the network of co-detection. In this case, even very sensitive sensors would not be able to detect any precursory seismic activity. Moreover, an ambiguity arises when it is possible to determine whether the origin of the network’s saturation comes from the onset of the rupture process or the coherent structure of the ambient seismic noise. The network has also to be tuned, and threshold set correctly. On the contrary, a complete absence of seismic detection does not indicate that damage is not progressing on the slope. Detection threshold may be too high, the coupling of the sensor may be too low or the rupture type may be brittle (implying fewer precursors).
Furthermore, when a survey is planned on an natural slope suspected of becoming unstable, neither δ nor the rupture type is known. Despite our efforts, we were unable to find any instantaneous estimation of the stability (i.e., finding δ). The system would need to be deployed and calibrated over a certain period, followed by data analysis, before stability could be accurately assessed. However, with help of multi-threshold analysis of co-detection activity, we have shown in Figure 6 that a snapshot of seismic activity could be directly estimated when a sufficient number of sensors is used. This provides a way to instantaneously capture the structure of the seismic activity and thus helps to estimate slope stability.
The sensitivity of sensors plays a critical role in evaluating micro-seismic activity resulting from ongoing development failure. Sensors with low sensitivity, characterized by high detection thresholds, only initiate co-detection near catastrophic rupture, indicating destabilization. On the other hand, a network consisting of highly sensitive sensors would quickly become saturated by internal seismic activity triggered by the onset of destabilization. Hence, it is essential to have the capability to automatically adjust the detection threshold to allow the system to adapt to different study sites, background noise levels, and meteorological conditions.
The co-detection method measures and characterizes, by definition, micro-seismic activity that originates from the internal destabilization of a natural slope. Rain and hail falling on the network will increase background noise and produce multiple diffuse random detections that will be naturally filtered out by the method. The co-detection method appears to be a powerful tool suitable for characterizing the internal development of damage, specifically the micro-seismic activity originating from the instability.
Finally, besides focusing on co-detections, the utilization of a sensor network could offer significant benefits for monitoring micro-seismic activity originating from potentially unstable slopes in relation to external meteorological conditions. By identifying the sensors with the highest detection rates, specific areas prone to instability could be defined. The temporal evolution of seismic activity could be analyzed in relation to meteorological conditions (i.e., external forcing), enabling the mapping of seismic activity patterns and enhancing our understanding of slope behavior. Furthermore, examining the statistical structure of waiting times, such as calculating the average waiting time, assessing the shape of the distribution (e.g., exponential, power law), or investigating temporal correlations, could provide valuable insights into the mechanisms leading to instability and, consequently, the potential for catastrophic rupture [46–50]. Such analyses would contribute to a better understanding of the imminent risks associated with unstable slopes and aid in developing strategies for hazard assessment and risk management.
5 Conclusion
We used Fiber Bundle Models (FBM) as a framework to study the progression of seismic activity before catastrophic failure in heterogeneous materials and characterized possible precursory patterns for early warning purposes. We showed that the mode of load redistribution influenced the macroscopic type of rupture, ranging from ductile-like rupture without stress concentration (global load sharing) to brittle-like failure with local load sharing.
In general, classical studies on FBM primarily focus on analyzing the properties of avalanches prior to global failure. However, avalanches, representing simultaneous failures of fiber groups, primarily reflect the spatial extent of crack formation, which is difficult to measure directly. In contrast, the energy associated with seismic wave propagation can be effectively captured and measured using geophones or acoustic sensors in the field. Consequently, by considering the attenuation of seismic waves, we have focused on the study on attenuated amplitudes of seismic waves, which directly correspond to the metrics measured by these instruments.
We have demonstrated that avalanches and their associated radiated elastic energies are not strictly equivalent, particularly in cases characterized by local load sharing and brittle-like failure. Moreover, we have highlighted differences in the evolution of statistical characteristics prior to global catastrophic rupture between avalanches and attenuated amplitudes measured at a single location, across all types of ruptures. Additionally, we have observed disparities in their maximum values: While avalanche sizes display clear discrepancies between DFBM and LFBM4, with DFBM showing a significant increase in maximum size before rupture compared to LFBM4, attenuated amplitudes exhibit nearly equivalent maximum size in both cases.
By testing the co-detection method on a simple model with basic attenuation properties, we demonstrated its great potential for early warning purposes. The increase in co-detection number was more pronounced and occurred earlier than the increase in global radiated elastic energy before global bundle failure, suggesting enhanced sensitivity in detecting precursory seismic events. Even in brittle rupture cases, the method detected the onset of instability provided sufficiently high sensor sensitivity. This unexpected behavior was attributed to clustered avalanche patterns before global rupture. Additionally, through multi-threshold analysis of co-detection activity, a snapshot of seismic activity could be directly estimated, providing a means to instantaneously capture the statistical structure of seismic activity and assisting in slope stability estimation. Leveraging a network of seismic wave detectors, this method proved efficient in detecting clustered activity, even in cases of relatively weak seismic activity: Surprisingly, DFBM and LFBM4 exhibited only slight differences in co-detection behavior, despite significant variations in avalanche size distributions and distinct patterns in total radiated energy before catastrophic failure.
The co-detection method emerged as a promising approach for detecting and monitoring seismic activity associated with slope instability. It demonstrated a higher sensitivity in detecting precursory seismic events compared to traditional methods. The method’s generic nature suggests its applicability across various types of ruptures in different natural materials such as rock, soil, ice, and snow. This makes it a valuable tool for capturing and monitoring rupture events in real-world scenarios, as, for example, rockfall, landslides, moraine instability leading to glacial lake outburst floods or mountain collapse. Moreover, thanks to the small amount of data that needs to be transmitted (only time stamp of the detection, amplitude of the seismic wave and the ID of the sensor), this strategy makes real-time analysis feasible, and would offer a flexible, adaptive, and resilient alternative for classical early warning system.
To enhance our understanding of slope stability and potentially improve early warning capabilities, the next step would involve conducting experimental measurements on a potentially unstable slope, using a methodology similar to the one described in [51]. This would involve employing a seismic co-detection strategy to capture damage evolution (i.e., internal parameter), along with surface displacement measurements to capture geometry evolution (i.e., external parameter). By analyzing and comparing the temporal evolution of these two parameters in relationship with meteorological conditions, we expect to gain valuable insights into the progression of rupture. Furthermore, by comparing theoretical and numerical results with the experimental data, we hope to achieve a better understanding of slope stability and enhance our ability to provide early warning alerts for specific slopes.
Data availability statement
The raw data supporting the conclusion of this article will be made available by the authors, without undue reservation.
Author contributions
JF designed the model, analyzed the results, wrote the manuscript.
Funding
This work was partly supported by the Institut Carnot Clim’adapt.
Acknowledgments
The author thank Marie-Aurélie Chanut for her valuable comments.
Conflict of interest
The author declares that the research was conducted in the absence of any commercial or financial relationships that could be construed as a potential conflict of interest.
Publisher’s note
All claims expressed in this article are solely those of the authors and do not necessarily represent those of their affiliated organizations, or those of the publisher, the editors and the reviewers. Any product that may be evaluated in this article, or claim that may be made by its manufacturer, is not guaranteed or endorsed by the publisher.
References
1. Pescaroli G, Alexander D. A definition of cascading disasters and cascading effects: going beyond the “toppling dominos” metaphor. Planet Risk (2015) 3:58–67.
2. Gill JC, Malamud BD. Reviewing and visualizing the interactions of natural hazards. RG (2014) 52:680–722. doi:10.1002/2013rg000445
3. Froude MJ, Petley DN. Global fatal landslide occurrence from 2004 to 2016. Nat Hazards Earth Syst Sci (2018) 18:2161–81. doi:10.5194/nhess-18-2161-2018
4. Sim KB, Lee ML, Wong SY. A review of landslide acceptable risk and tolerable risk. Geoenvironmental Disasters (2022) 9:3. doi:10.1186/s40677-022-00205-6
5. Petley D. Global patterns of loss of life from landslides. Geology (2012) 40:927–30. doi:10.1130/G33217.1
6. Aristizábal E, Sánchez O. Spatial and temporal patterns and the socioeconomic impacts of landslides in the tropical and mountainous colombian andes. Disasters (2020) 44:596–618. doi:10.1111/disa.12391
7. Görüm T, Fidan S. Spatiotemporal variations of fatal landslides in Turkey. Landslides (2021) 18:1691–705. doi:10.1007/s10346-020-01580-7
8. Chae B-G, Park H-J, Catani F, Simoni A, Berti M. Landslide prediction, monitoring and early warning: a concise review of state-of-the-art. Geosciences J (2017) 21:1033–70. doi:10.1007/s12303-017-0034-4
9. Uhlemann S, Smith A, Chambers J, Dixon N, Dijkstra T, Haslam E, et al. Assessment of ground-based monitoring techniques applied to landslide investigations. Geomorphology (2016) 253:438–51. doi:10.1016/j.geomorph.2015.10.027
10. Pecoraro G, Calvello M, Piciullo L. Monitoring strategies for local landslide early warning systems. Landslides (2019) 16:213–31. doi:10.1007/s10346-018-1068-z
11. Stähli M, Sättele M, Huggel C, McArdell BW, Lehmann P, Van Herwijnen A, et al. Monitoring and prediction in early warning systems for rapid mass movements. Nat Hazards Earth Syst Sci (2015) 15:905–17. doi:10.5194/nhess-15-905-2015
12. Michlmayr G, Cohen D, Or D. Sources and characteristics of acoustic emissions from mechanically stressed geologic granular media — a review. Earth-Science Rev (2012) 112:97–114. doi:10.1016/j.earscirev.2012.02.009
13. Faillettaz J, Or D. Failure criterion for materials with spatially correlated mechanical properties. Phys Rev E (2015) 91:032134. doi:10.1103/PhysRevE.91.032134
14. Amitrano D, Grasso JR, Senfaute G. Seismic precursory patterns before a cliff collapse and critical point phenomena. Geophys Res Lett (2005) 32. doi:10.1029/2004GL022270
15. Dixon N, Hill R, Kavanagh J. Acoustic emission monitoring of slope instability: development of an active waveguide system. ICE - Geotechnical Eng (2003) 156:83–95. doi:10.1680/geng.2003.156.2.83
16. Kolesnikov YI, Nemirovich-Danchenko MM, Goldin SV, Seleznev VS. Slope stability monitoring from microseismic field using polarization methodology. Nat Hazards Earth Syst Sci (2003) 3:515–21. doi:10.5194/nhess-3-515-2003
17. Dixon N, Spriggs M. Quantification of slope displacement rates using acoustic emission monitoring. Can Geotechnical J (2007) 44:966–76.
18. Faillettaz J, Funk M, Sornette D. Icequakes coupled with surface displacements for predicting glacier break-off. J Glaciology (2011) 57:453–60. doi:10.3189/002214311796905668
19. Van Herwijnen A, Schweizer J. Seismic sensor array for monitoring an avalanche start zone: design, deployment and preliminary results. J. Glaciol. (2011) 57:267–76. doi:10.3189/002214311796405933
20. Reiweger I, Mayer K, Steiner K, Dual J, Schweizer J. Measuring and localizing acoustic emission events in snow prior to fracture. Cold Regions Sci Tech (2015) 110:160–9. doi:10.1016/j.coldregions.2014.12.002
21. Faillettaz J, Or D, Reiweger I. Codetection of acoustic emissions during failure of heterogeneous media: new perspectives for natural hazard early warning. New Perspectives Natural Hazard Early Warning (2016) 43:1075–83. doi:10.1002/2015gl067435
22. Roy S, Biswas S. Size distribution of emitted energies in local load sharing fiber bundles. Front Phys (2021) 9. doi:10.3389/fphy.2021.643602
23. Bodaballa NK, Biswas S, Roy S. Correlation between avalanches and emitted energies during fracture with a variable stress release range. Front Phys (2022) 10. doi:10.3389/fphy.2022.768853
24. Cartwright-Taylor A, Mangriotis M-D, Main IG, Butler IB, Fusseis F, Ling M, et al. Seismic events miss important kinematically governed grain scale mechanisms during shear failure of porous rock. Nat Commun (2022) 13:6169. doi:10.1038/s41467-022-33855-z
25. Sornette D. Critical phenomena in natural sciences: chaos, fractals, selforganization and disorder: concepts and tools. In: Springer series in synergetics. Springer (2006).
26. Alava MJ, Nukala PKVV, Zapperi S. Statistical models of fracture. Adv Phys (2006) 55:349–476. doi:10.1080/00018730300741518
27. Bonamy D, Bouchaud E. Failure of heterogeneous materials: a dynamic phase transition? Phys Rep (2011) 498:1–44. doi:10.1016/j.physrep.2010.07.006
28. Pierce F. 32—x.—tensile tests for cotton yarns v.—“the weakest link” theorems on the strength of long and of composite specimens. J Textile Inst Trans (1926) 17:T355–T368. doi:10.1080/19447027.1926.10599953
29. Daniels HE. The statistical theory of the strength of bundles of threads. i. Proc R Soc Lond A: Math Phys Eng Sci (1945) 183:405–35. doi:10.1098/rspa.1945.0011
30. Gómez JB, Iñiguez D, Pacheco AF. Solvable fracture model with local load transfer. Phys Rev Lett (1993) 71:380–3. doi:10.1103/PhysRevLett.71.380
31. Kloster M, Hansen A, Hemmer PC. Burst avalanches in solvable models of fibrous materials. Phys Rev E (1997) 56:2615–25. doi:10.1103/PhysRevE.56.2615
32. Pradhan S, Hansen A, Chakrabarti BK. Failure processes in elastic fiber bundles. Rev Mod Phys (2010) 82:499–555. doi:10.1103/RevModPhys.82.499
33. Capelli A, Reiweger I, Schweizer J. Studying snow failure with fiber bundle models. Front Phys (2020) 8. doi:10.3389/fphy.2020.00236
34. Harlow DG, Phoenix SL. The chain-of-bundles probability model for the strength of fibrous materials i: analysis and conjectures. J Compos Mater. (1978) 12:195–214. doi:10.1177/002199837801200207
35. Hidalgo RC, Moreno Y, Kun F, Herrmann HJ. Fracture model with variable range of interaction. Phys Rev E (2002) 65:046148. doi:10.1103/PhysRevE.65.046148
36. Kun F, Moreno Y, Hidalgo RC, Herrmann HJ. Creep rupture has two universality classes. Europhys Lett (2003) 63:347–53. doi:10.1209/epl/i2003-00469-9
37. Stormo A, Gjerden KS, Hansen A. Onset of localization in heterogeneous interfacial failure. Phys Rev E (2012) 86:025101. doi:10.1103/PhysRevE.86.025101
38. Kádár V, Pál G, Kun F. Record statistics of bursts signals the onset of acceleration towards failure. Scientific Rep (2020) 10:2508. doi:10.1038/s41598-020-59333-4
39. Kádár V, Danku Z, Pál G, Kun F. Approach to failure through record breaking avalanches in a heterogeneous stress field. Physica A: Stat Mech its Appl (2022) 594:127015. doi:10.1016/j.physa.2022.127015
40. Chakrabarti BK, Biswas S, Pradhan S. Cooperative dynamics in the fiber bundle model. Front Phys (2021) 8. doi:10.3389/fphy.2020.613392
41. Hemmer PC, Hansen A. The distribution of simultaneous fiber failures in fiber bundles. J Appl Mech (1992) 59:909–14. doi:10.1115/1.2894060
42. Pradhan S, Hansen A, Hemmer PC. Crossover behavior in burst avalanches: signature of imminent failure. Phys Rev Lett (2005) 95:125501. doi:10.1103/PhysRevLett.95.125501
43. Amitrano D. Variability in the power-law distributions of rupture events. Eur Phys J Spec Top (2012) 205:199–215. doi:10.1140/epjst/e2012-01571-9
44. Zhang S, Ding E. Burst-size distribution in fiber-bundles with local load-sharing. Phys Lett A (1994) 193:425–30. doi:10.1016/0375-9601(94)90534-7
45. Banerjee S, Kumar A. Determination of seismic wave attenuation: a review. Disaster Adv (2016) 9:10–27.
46. Davidsen J, Stanchits S, Dresen G. Scaling and universality in rock fracture. Phys Rev Lett (2007) 98:125502. doi:10.1103/PhysRevLett.98.125502
47. Faillettaz J, Sornette D, Funk M. Numerical modeling of a gravity-driven instability of a cold hanging glacier: reanalysis of the 1895 break-off of Altelsgletscher, Switzerland. Switzerland (2011) 57:817–31. doi:10.3189/002214311798043852
48. Kumar P, Korkolis E, Benzi R, Denisov D, Niemeijer A, Schall P, et al. On interevent time distributions of avalanche dynamics. Scientific Rep (2020) 10:626. doi:10.1038/s41598-019-56764-6
49. de Sousa IP, dos Santos Lima GZ, Correa MA, Sommer RL, Corso G, Bohn F. Waiting-time statistics in magnetic systems. Scientific Rep (2020) 10:9692. doi:10.1038/s41598-020-66727-x
50. Post RAJ, Michels MAJ, Ampuero J-P, Candela T, Fokker PA, van Wees J-D, et al. Interevent-time distribution and aftershock frequency in non-stationary induced seismicity. Scientific Rep (2021) 11:3540. doi:10.1038/s41598-021-82803-2
Keywords: fiber bundle model, emitted energy, seismic wave attenuation, rupture prediction, co-detection, natural slope stability, early warning
Citation: Faillettaz J (2023) Fiber bundle model applied to slope stability assessment: co-detection multi-threshold analysis for early warning. Front. Phys. 11:1244503. doi: 10.3389/fphy.2023.1244503
Received: 22 June 2023; Accepted: 16 October 2023;
Published: 20 November 2023.
Edited by:
Francisco Perez-Reche, University of Aberdeen, United KingdomReviewed by:
Jordi Baró Urbea, University of Barcelona, SpainSoumyajyoti Biswas, SRM University, India
Copyright © 2023 Faillettaz. This is an open-access article distributed under the terms of the Creative Commons Attribution License (CC BY). The use, distribution or reproduction in other forums is permitted, provided the original author(s) and the copyright owner(s) are credited and that the original publication in this journal is cited, in accordance with accepted academic practice. No use, distribution or reproduction is permitted which does not comply with these terms.
*Correspondence: Jerome Faillettaz, amVyb21lLmZhaWxsZXR0YXpAY2VyZW1hLmZy