- 1School of Air Traffic Management, Civil Aviation Flight University of China, Guanghan, China
- 2Chengdu GoldTel Industry Group Co., Ltd., Chengdu, China
- 3Operation Management Center of ATMB, Civil Aviation Administration of China, Beijing, China
The identification of key nodes in complex networks is a hot topic. Therefore, it attracts increasing attention from different fields, like airline networks and social networks. To identify the key nodes in complex network, we suggest an improved gravity model method that takes propagation features into account. Relevant experiments were carried out in four actual airline networks based on the Susceptible Infected Recovered (SIR) model. First, we analyze the correlation between the proposed method and other benchmark methods.Then, Kendall’s correlation coefficient and the imprecision function were used as evaluation metrics to analyze and validate the proposed method. Empirical results reveal that the suggested method outperforms previous benchmark methods in terms of precision and effectiveness for identifying key nodes, especially in the US air network, where Kendall’s tau achieves a 107% improvement compared to the gravity centrality method.
1 Introduction
Research on complex networks has gained significant traction in recent years [1, 2], and related work has been progressing in fields including airline networks [3, 4], social networks [5], and other networks [6]. Numerous scholars have devoted themselves to the study of identifying key nodes in networks in addition to analyzing and exploring some fundamental topologies of networks [7–9]. Theoretically and practically, it is critical to accurately identify key nodes in networks [10], because key nodes frequently play a more important role on the structure and function of the entire network than other nodes. The research of key nodes identification has a wide range of applications, including viral marketing, the identification of significant opinion leaders in social networks, the location of key node airports in airline networks, and so on.
Theoretically, a variety of methods have been proposed to effectively identify key nodes in complex networks, including Degree Centrality (DC) [11], k-shell decomposition (KS) [12], and its variants [13, 14]. However, it frequently appears that many nodes are in the same ranking when utilizing the aforementioned traditional ways to rank the importance of network nodes. Over the years, numerous innovative methods have been proposed in an effort to successfully address these issues and obtain accurate node identification [9, 15–19]. Ma et al. introduced a novel method called Gravity Centrality (GC) [20], which takes into account both the path information and the local attribute. Li et al. [21] suggested a ranking algorithm by treating node degree values as masses while taking neighboring nodes’ ranges into account. Li et al. [22] proposed an improved gravity model method that integrates the gravity model as well as the degree and k-shell values of nodes. In fact, in addition to local and global features and path-based information, the propagation feature is one of the variables that affects the propagation range of nodes in the network [23–25]. According to this idea, Zhong et al. [26] provide an enhanced information entropy [27] approach that takes into account the effects of both node neighbors and propagation features.
Inspired by the principles of GC and its modifications as well as node propagation features, this research proposed a unique method for identifying key nodes in complicated airline networks based on the gravity model and propagation feature (IGP). In four real airline networks, we evaluated the accuracy of our method, and IGP performed better on Kendall’s tau [28] and the imprecision function than six other benchmark methods. Our method can accurately identify key nodes, which not only contributes to enhancing the effectiveness and quality of the airline network but also offers theoretical support for network improvement.
The following sections make up the present paper. It begins with a description and justification of the proposed method. Second, a detailed analysis of the results of the experiment is provided. Finally, an overview of this research project is provided.
2 Model
Given a complex network G, which is undirected and unweighted, we make G = (N, E), which means that the graph G consists of N nodes and E edges. A = {aij} is the adjacency matrix of G; aij = 0 indicates that node i and j are not directly connected; aij = 1 indicates that they are. Airports represent nodes in an airline network, and routes between airports substitute edges, which are abstracted into an undirected airline network. Similar to this, aij = 1 if there are direct connections connecting two airports; otherwise, aij = 0. Besides, A can also be used to describe the basic topology of G.
To begin identifying the initial effect of nodes in the network, we first compute the gravity value—G based on the gravity centrality.
Where Gi refers to the importance of node i; j ∈ ψ(i) denotes that node j is a neighbor of node i. In this paper, we will consider the direct neighbors. The ki, ksi represent the degree value, k-shell value of node i, respectively. The dij denotes the shortest distance from node i to node j. And ki, kj are expressed using Eq. 2.
The influence of same-order neighbors is typically seen as being equal in networks that preserve a certain propagation rate. Using node propagation features, it is possible to further identify the degree of relevance of nodes with the same influence (nodes with the same centrality value) in the real propagation process, as well as to distinguish the degree of influence of a node on its neighbors. In order to further differentiate, we therefore successfully combine the propagation rate and node degree. We will use Cj to represent the influence effect of node j when the propagation rate is β.
Finally, the gravity model and the propagation feature are considered simultaneously to analyze the influence of the nodes in the network, as described by the following equation.
3 Results
3.1 Data description
The accuracy of the IGP method will be evaluated in this experiment using four real airline networks. The US air airline network is a network of American airlines [29]. The real airline networks of China’s three domestic carriers are denoted, respectively, by CA (the airline network of Air China), CZ (the airline network of China Southern), and MU (the airline network of China Eastern). Each node in the airline network represents a separate airport, and the edges indicate the routes that connect those airports. Table 1 displays some of the topological properties of the four airline networks.
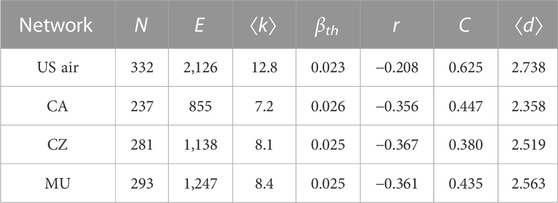
TABLE 1. Basic topology information of US air, CA, CZ, and MU networks. The names of the four networks are placed in the first column under network. The N and E denote the total number of nodes and edges, respectively. The ⟨k⟩ and βth represent the average degree and epidemic threshold. The r, C and ⟨d⟩ are assortative coefficient, clustering coefficient and the average distance, respectively.
According to Table 1, it is clear that the US air network covers the most airports and routes among the four airline networks. By comparing the average degree of each airline network, it is possible to compare network sparsity. The epidemic threshold identified for each airline network using the SIR model is indicated by the βth. The assortative coefficients for four airline networks are negative, and the values are near to each other, indicating that the clustering effect of each airline network is quite close. The US air network’s clustering coefficient has a maximum value of 0.625, the CZ has the lowest value. This shows that some nodes (airports) in four airline networks have a tendency to be connected with preferred large degree values. The average distance between all four airline networks is kept between 2 and 3.
3.2 Measurement
This study will use the node propagation range of the SIR model to describe the influence of each node [30]. The nodes in the SIR model have three discrete states: susceptible, infected and recovered, respectively. A certain infection step, propagation rate, and recovery rate are first determined prior to the experiment. The susceptible neighbors of every infected node will, at random and with a predetermined probability β, get infected at each time step of the SIR model. At the same time, at a certain recovery rate μ, certain infected nodes will return to their pre-infection state and not become infected again. When there are no infected nodes left in the overall network, the propagation process comes to an end. To quantify the SIR propagation process, we recorded the average number of infected nodes for each node in this experiment after 5,000 experimental propagation processes. According to the SIR model, a node is more significant and plays a more critical function when there are more nodes infected by it.
To evaluate whether there is a correlation between two sequences, one uses Kendall’s tau coefficient [28]. The value of Kendall’s coefficient ranges from 0 to 1. The closer the calculated Kendall’s tau correlation coefficient is to 1, the stronger the correlation between the two sequences. The correlation coefficient can be defined as Eq. 5.
Given two sequences with the same length, name the two sequences as V and W, their ith values are denoted by vi and wi, respectively. There are three relationships between (vi, wi) and (vj, wj): vi
The imprecision function ɛ(p) calculates the mean propagation capacity of the top-M nodes in the ranking list generated by various key node detection methods, it can assess the performance of the ranking method. The imprecision function ɛ(p) is defined as Eq. 6.
Here p denotes the ratio of selected nodes M to the total number of nodes N (p = M/N), which ranges from 0 to 1. The M(p) and Meff(p), respectively, represent the average spreading influence of the top pN nodes in the ranked list produced by different methods and the SIR model. The better it is for identifying key nodes in networks, the smaller the difference between M(p) and Meff(p), the smaller the ɛ(p), and the more accurate the ranking of the network nodes computed by a particular method.
3.3 Simulation results
To evaluate the effectiveness of our proposed method (IGP), we compare it with six ranking methods, including BC (Betweenness Centrality) [31], CC (Closeness Centrality) [32], DC (Degree Centrality) [11], KS (k-shell decomposition) [12], GC (Gravity Centrality) [20], and KSGC (the k-shell based on gravity centrality) [33]. Besides, we set propagation rate β in the SIR model for different networks.
We organized and evaluated the data from the four airline networks to produce the structure map of the network. After that, we plot the combined routes of the four airline networks to get Figure 1, from which we may roughly infer the distribution of each network’s nodes (the total number of airports) and connections (the total number of routes connecting those airports). As can be observed in Figure 1, the nodes in the four airline networks have highly similar topologies, and each of the four networks exhibits the characteristics of high core node connectivity density and low edge node connectivity.
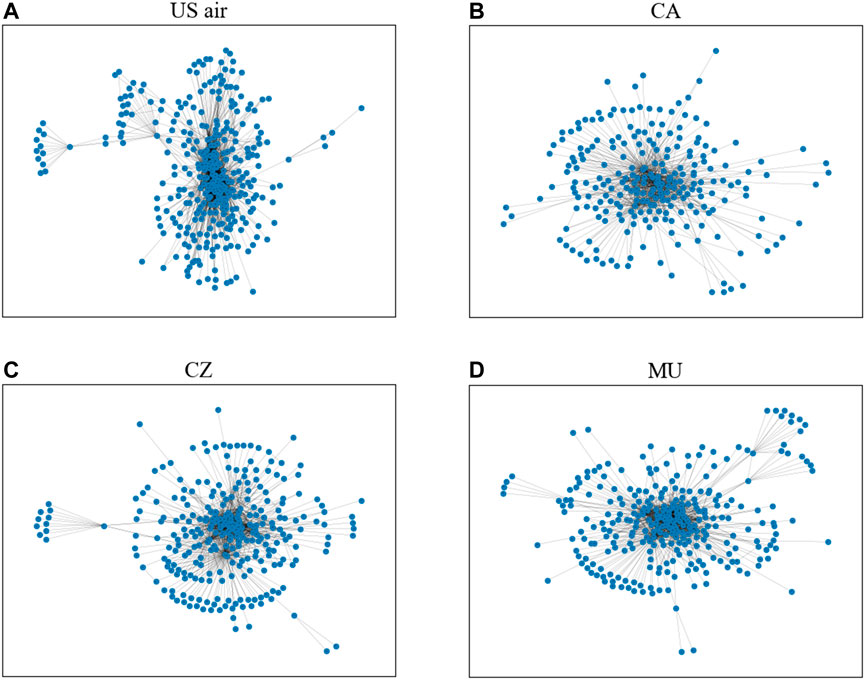
FIGURE 1. It is a topology depiction of the four airline network diagrams for US air, CA, CZ, and MU, respectively.
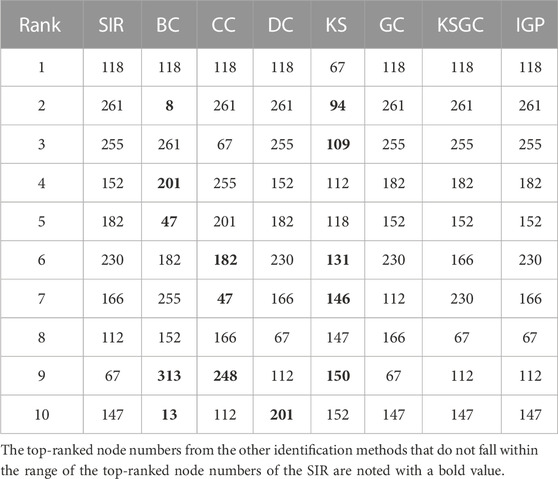
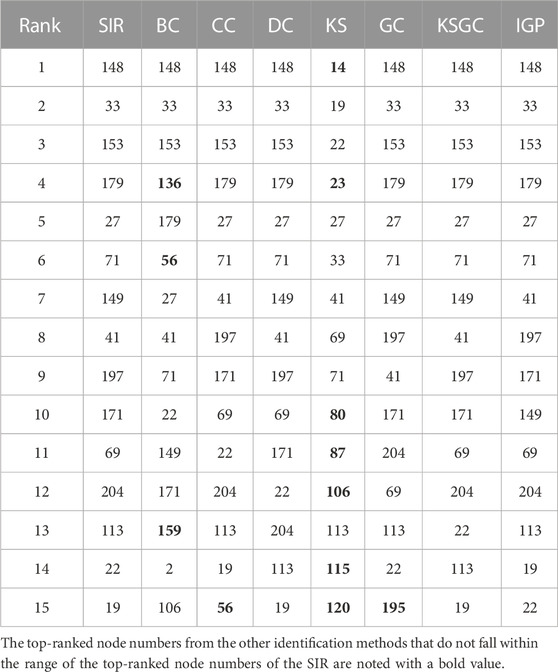
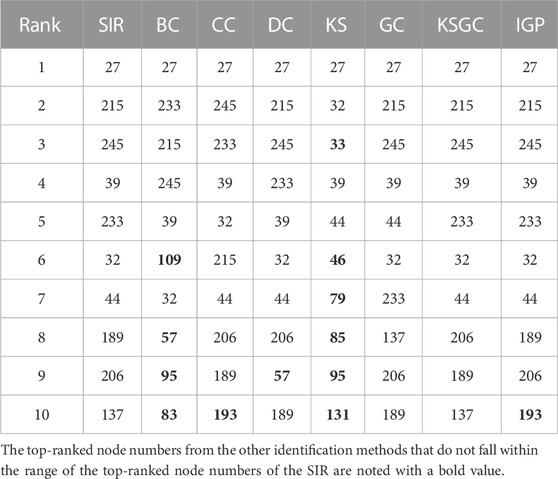
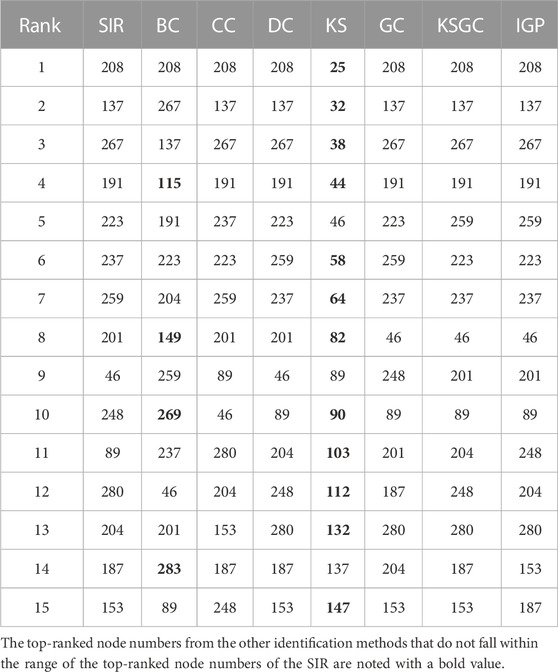
We compared the top 10 or 15 key nodes obtained by the IGP approach to those found by other benchmark methods. In our experiments, we ranked the nodes in each of the four airline networks using the IGP method before choosing the top-10 or top-15 of the ranked nodes. These nodes were then ranked for selection using the other six benchmark methods in the same way. Tables 2–5 displays the results of node ranking.
When using different methods to identify key nodes for the same network, the results are frequently not exactly the same. We consider that it is related to the accuracy of each method and also has a certain relationship with the network’s structure. For each method in the table, the more the number of bolded numbers, the less accurate the method is. The SIR model here is with β = βth for different networks. As is shown in the US air network, the IGP, GC, KSGC and SIR all have the same node numbers. Comparable circumstances are represented in the MU network as well. Besides, the DC and CC are method that perform better in the CA and MU networks, the poorest effective method is KS since there are multiple nodes scattered across the same shell. The BC method also showed poor performance in the four networks. After that, we’ll conduct more experiments to further evaluate these methods’ effectiveness.
We obtain Figure 2 to further examine the correlations between the IGP and other benchmark methods. The KS, DC and CC are picked as comparison methods. Each node in the network is represented by a point on the graph. In this experiment, we set propagation rate β = βth and the infection step F(t) = 10. Each point’s color indicates the spreading capacity determined by the SIR model. The closer a point’s color is to red represents its larger relevance, according to the color bar.
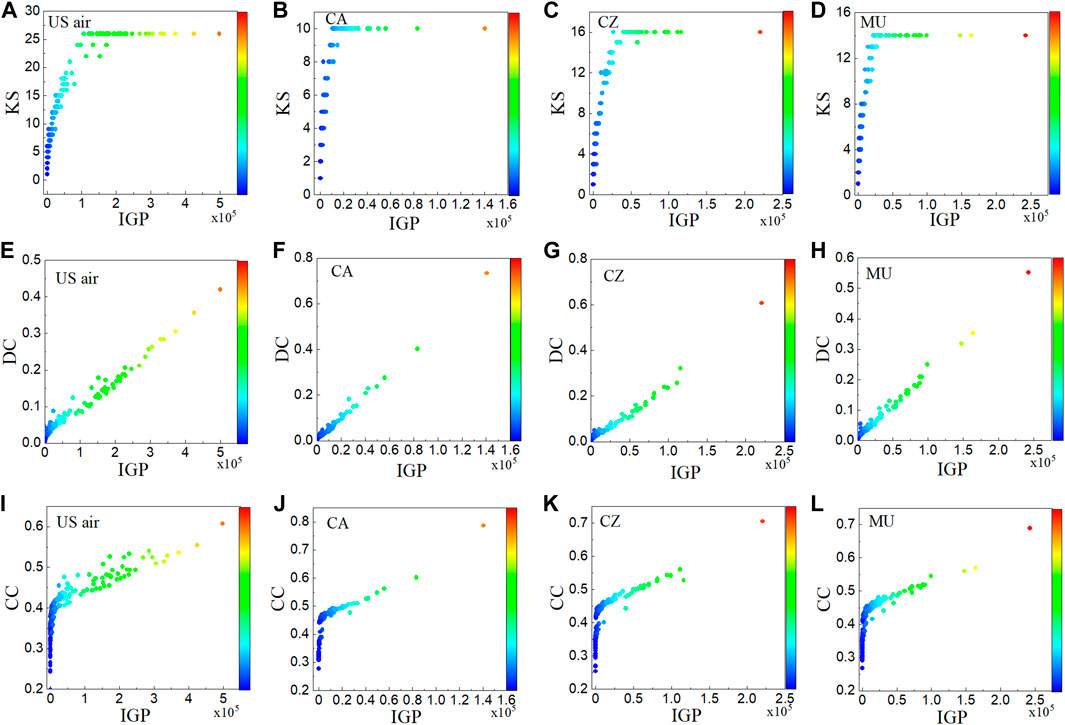
FIGURE 2. The relationship between the IGP and KS, DC, and CC in four airline networks is shown in this figure. The values of the horizontal and vertical axes denote the results of the IGP and KS, DC, and CC calculations, respectively. Each point’s color indicates the spreading capacity determined by the SIR model.
As shown in Figure 2, we can see that IGP and KS have a positive correlation from Figures 2A–D. The CC and IGP also have a positive correlation from Figures 2I–L, but neither of the two methods mentioned above has as strong of a correlation as the one between DC and IGP. From Figures 2E–H, we recognize that DC and IGP have a strong positive correlation, meaning that nodes with larger DC values will also have larger IGP values. For this reason, we believe that the DC has a stronger correlation with the IGP compared to both the CC and KS methods, likely because the degree value of the node is taken into account when considering the influence of the propagation feature on the node. In conclusion, the IGP method has varying degrees of positive correlation with several previous centrality methods, and the infectivity of the nodes with higher IGP values is larger.
By calculating Kendall’s tau coefficient, we are able to compare the efficacy of various methods. We adjusted the propagation rate range in the SIR model, and the propagation rate varies from 0.6βth to 1.4βth for each network in order to further examine the impact of propagation rate on the IGP method. Figure 3 shows Kendall’s tau, which was calculated using various methods in the four airline networks.
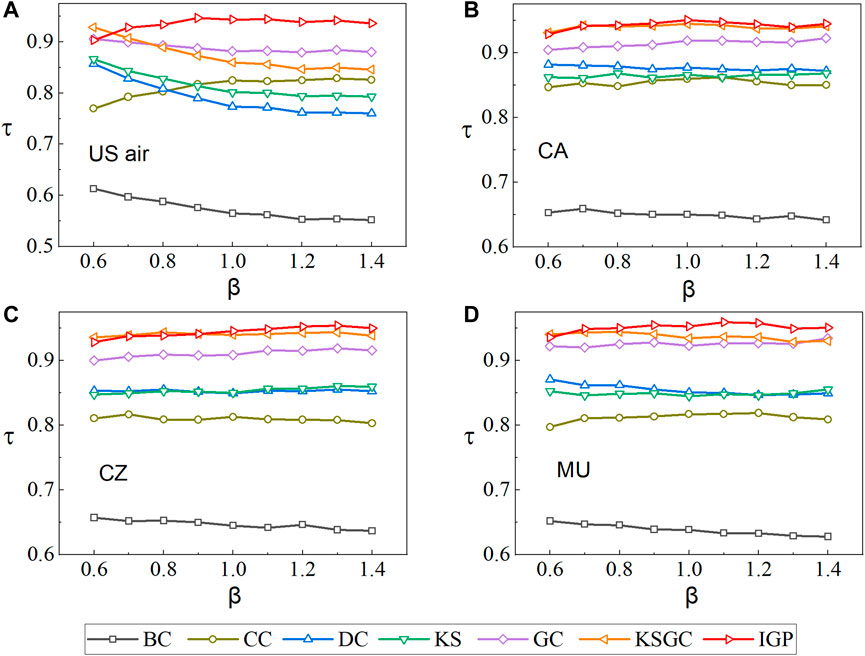
FIGURE 3. In the four airline networks, the Kendall’s tau τ is obtained using seven methods. The range of β is from 0.6βth to 1.4βth. The results are the average of more than 100 independent experiments conducted at different propagation rates.
As shown in Figure 3, the IGP method performs well in the US air network and also performs better in the MU and CA networks, with the corresponding value almost always coming in first. The superiority of our proposed method is visible in the US air network, where IGP has a more stable largest Kendall’s tau coefficient and has an advantage of up to 107% over the GC method. There is a similar phenomenon in MU network, with the exception of the propagation rate of 0.6βth, where the Kendall’s tau values obtained by the IGP method remain at their maximum values for all propagation rate cases.
In the MU network, the Kendall’s coefficients obtained by the IGP method increase as the propagation rate increases. We can find that our suggested method and the KSGC method are somewhat competitive in both CA and CZ networks. For both networks, the two methods are nearly equally effective when the propagation rate is from 0.6βth to 0.9βth. When the propagation rate exceeds 0.9βth, The IGP method obtains a larger value of Kendall’s tau, demonstrating the greater validity and accuracy of IGP.
After calculating Kendall’s tau coefficient, we learn that the IGP method outperforms other methods. To further back up this conclusion, we will then employ the imprecision function. The accuracy of the method increases as the value of the imprecision function decreases. We calculate the ɛ(p) achieved using the IGP method and the other six benchmark methods, respectively, in four airline networks. Figure 4 shows the experimental results. The p-value range was defined to be between 0.1 and 0.3. The figure shows that the ɛ(p) acquired by the IGP method is in a relatively low value range for each airline network, and the overall experimental findings are encouraging, demonstrating the accuracy and effectiveness of our method.
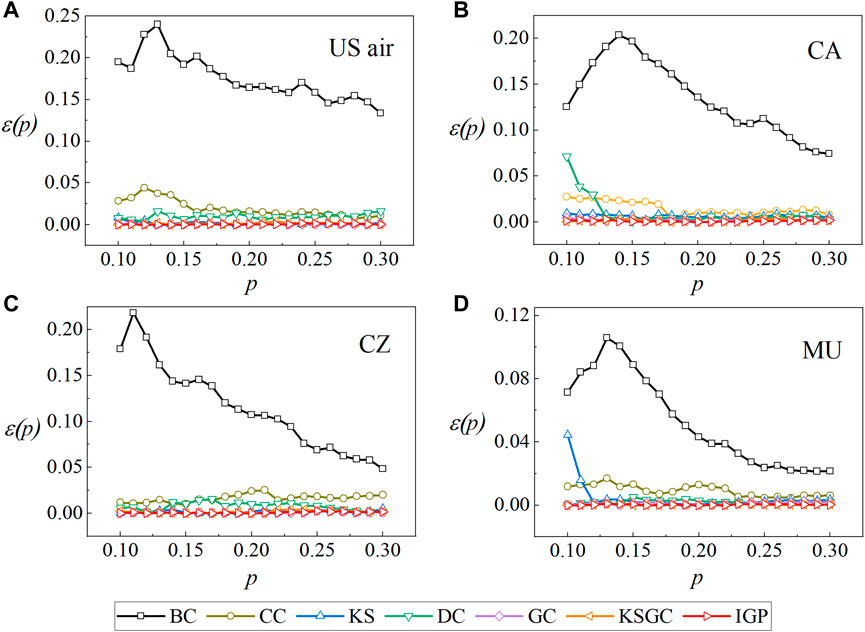
FIGURE 4. The imprecision function ɛ(p) is obtained by different methods in the four airline networks. The p ranges from 0.1 to 0.3. We set β = 0.05 and μ = 1.
4 Discussions and conclusion
In order to identify key nodes in complex networks, we present the IGP method, an improved gravity model based on propagation features. First, we compare the proposed method to the top node rankings obtained by other benchmark methods. Next, we analyze the correlation with the DC, CC, and KS methods. Finally, we evaluate the performance of the proposed method using Kendall’s correlation coefficient and imprecision function as evaluation criteria. Experimental simulations in four airline networks show that the proposed method outperforms other benchmark methods. The IGP method produces larger Kendall’s coefficient than other methods, particularly in the US air network, with a clear advantage. Additionally, each network has lower imprecision function values related to the IGP method, indicating that the IGP method can identify key nodes more accurately than benchmark methods. The results of our experiments demonstrate that our method has accuracy as well as practicality, and that the IGP method can theoretically assist in the accurate identification of key node airports in the airline network.
Accurately and effectively identifying key nodes in complex networks is increasingly important as network topologies become more complex in the real world. In addition to the complex airline networks, the approach we propose can be utilized to locate key nodes in other complicated networks. Furthermore, we will improve our method by applying it to multilayer network topologies or temporal networks, in conjunction with later practical advances and modifications, in order to achieve more precise identification of critical nodes.
Data availability statement
The original contributions presented in the study are included in the article/Supplementary material, further inquiries can be directed to the corresponding author.
Author contributions
LnZ and XG wrote the original draft of this opinion manuscript. LaZ, LiZ, LnZ, HY, WP, and JH provided feedback on the manuscript. LnZ and XG edited the final manuscript. All authors contributed to the article and approved the submitted version.
Funding
This research was supported by the National Natural Science Foundation of China (No. 72201268), Natural Science Foundation of Sichuan Province (No. 2022NSFSC1902), the Safety Foundation of CAAC (Nos AQ20200019, AQ20210091, AQ20210019), the Foundation of CAFUC (No. J2021-072).
Conflict of interest
LnZ was employed by Chengdu GoldTel Industry Group Co., Ltd.
The remaining authors declare that the research was conducted in the absence of any commercial or financial relationships that could be construed as a potential conflict of interest.
Publisher’s note
All claims expressed in this article are solely those of the authors and do not necessarily represent those of their affiliated organizations, or those of the publisher, the editors and the reviewers. Any product that may be evaluated in this article, or claim that may be made by its manufacturer, is not guaranteed or endorsed by the publisher.
References
1. Albert R, Barabási A-L. Statistical mechanics of complex networks. Rev Mod Phys (2002) 74:47–97. doi:10.1103/revmodphys.74.47
2. Li H-J, Bu Z, Li A, Liu Z, Shi Y. Fast and accurate mining the community structure: Integrating center locating and membership optimization. IEEE Trans Knowledge Data Eng (2016) 28:2349–62. doi:10.1109/tkde.2016.2563425
3. Cook A, Blom HA, Lillo F, Mantegna RN, Micciche S, Rivas D, et al. Applying complexity science to air traffic management. J Air Transport Manage (2015) 42:149–58. doi:10.1016/j.jairtraman.2014.09.011
4. Voltes-Dorta A, Rodríguez-Déniz H, Suau-Sanchez P. Vulnerability of the european air transport network to major airport closures from the perspective of passenger delays: Ranking the most critical airports. Transportation Res A: Pol Pract (2017) 96:119–45. doi:10.1016/j.tra.2016.12.009
5. Zhao D, Wang Z, Xiao G, Gao B, Wang L. The robustness of interdependent networks under the interplay between cascading failures and virus propagation. Europhysics Lett (2016) 115:58004. doi:10.1209/0295-5075/115/58004
6. Liu C, Zhang Z-K. Information spreading on dynamic social networks. Commun Nonlinear Sci Numer Simulation (2014) 19:896–904. doi:10.1016/j.cnsns.2013.08.028
7. Borgatti SP. Centrality and network flow. Social Networks (2005) 27:55–71. doi:10.1016/j.socnet.2004.11.008
8. Zhu J, Wang L. Identifying influential nodes in complex networks based on node itself and neighbor layer information. Symmetry (2021) 13:1570. doi:10.3390/sym13091570
9. Li C, Wang L, Sun S, Xia C. Identification of influential spreaders based on classified neighbors in real-world complex networks. Appl Math Comput (2018) 320:512–23. doi:10.1016/j.amc.2017.10.001
10. Chen X, Tan M, Zhao J, Yang T, Wu D, Zhao R. Identifying influential nodes in complex networks based on a spreading influence related centrality. Physica A: Stat Mech its Appl (2019) 536:122481. doi:10.1016/j.physa.2019.122481
11. Bonacich P. Factoring and weighting approaches to status scores and clique identification. J Math Sociol (1972) 2:113–20. doi:10.1080/0022250x.1972.9989806
12. Kitsak M, Gallos LK, Havlin S, Liljeros F, Muchnik L, Stanley HE, et al. Identification of influential spreaders in complex networks. Nat Phys (2010) 6:888–93. doi:10.1038/nphys1746
13. Liu Y, Tang M, Zhou T, Do Y. Improving the accuracy of the k-shell method by removing redundant links: From a perspective of spreading dynamics. Scientific Rep (2015) 5:13172–11. doi:10.1038/srep13172
14. Lin J-H, Guo Q, Dong W-Z, Tang L-Y, Liu J-G. Identifying the node spreading influence with largest k-core values. Phys Lett A (2014) 378:3279–84. doi:10.1016/j.physleta.2014.09.054
15. Bae J, Kim S. Identifying and ranking influential spreaders in complex networks by neighborhood coreness. Physica A: Stat Mech its Appl (2014) 395:549–59. doi:10.1016/j.physa.2013.10.047
16. Wang S, Du Y, Deng Y. A new measure of identifying influential nodes: Efficiency centrality. Commun Nonlinear Sci Numer Simulation (2017) 47:151–63. doi:10.1016/j.cnsns.2016.11.008
17. Zeng A, Zhang C-J. Ranking spreaders by decomposing complex networks. Phys Lett A (2013) 377:1031–5. doi:10.1016/j.physleta.2013.02.039
18. Zareie A, Sheikhahmadi A, Fatemi A. Influential nodes ranking in complex networks: An entropy-based approach. Chaos, Solitons & Fractals (2017) 104:485–94. doi:10.1016/j.chaos.2017.09.010
19. Zhang J, Xu X-K, Li P, Zhang K, Small M. Node importance for dynamical process on networks: A multiscale characterization. Chaos: Interdiscip J nonlinear Sci (2011) 21:016107. doi:10.1063/1.3553644
20. Ma L-l., Ma C, Zhang H-F, Wang B-H. Identifying influential spreaders in complex networks based on gravity formula. Physica A: Stat Mech its Appl (2016) 451:205–12. doi:10.1016/j.physa.2015.12.162
21. Li Z, Ren T, Ma X, Liu S, Zhang Y, Zhou T. Identifying influential spreaders by gravity model. Scientific Rep (2019) 9:8387. doi:10.1038/s41598-019-44930-9
22. Li Z, Huang X. Identifying influential spreaders in complex networks by an improved gravity model. Scientific Rep (2021) 11:22194–10. doi:10.1038/s41598-021-01218-1
23. Chen D-B, Sun H-L, Tang Q, Tian S-Z, Xie M. Identifying influential spreaders in complex networks by propagation probability dynamics. Chaos: Interdiscip J Nonlinear Sci (2019) 29:033120. doi:10.1063/1.5055069
24. Bao Z-K, Ma C, Xiang B-B, Zhang H-F. Identification of influential nodes in complex networks: Method from spreading probability viewpoint. Physica A: Stat Mech its Appl (2017) 468:391–7. doi:10.1016/j.physa.2016.10.086
25. Zhong L-F, Liu J-G, Shang M-S. Iterative resource allocation based on propagation feature of node for identifying the influential nodes. Phys Lett A (2015) 379:2272–6. doi:10.1016/j.physleta.2015.05.021
26. Zhong L, Bai Y, Tian Y, Luo C, Huang J, Pan W. Information entropy based on propagation feature of node for identifying the influential nodes. Complexity (2021) 2021:1–8. doi:10.1155/2021/5554322
27. Zhao N, Bao J, Chen N. Ranking influential nodes in complex networks with information entropy method. Complexity (2020) 2020:1–15. doi:10.1155/2020/5903798
28. Kendall MG. A new measure of rank correlation. Biometrika (1938) 30:81–93. doi:10.1093/biomet/30.1-2.81
30. Newman ME. Spread of epidemic disease on networks. Phys Rev E (2002) 66:016128. doi:10.1103/physreve.66.016128
31. Newman ME. A measure of betweenness centrality based on random walks. Soc networks (2005) 27:39–54. doi:10.1016/j.socnet.2004.11.009
32. Sabidussi G. The centrality index of a graph. Psychometrika (1966) 31:581–603. doi:10.1007/bf02289527
Keywords: complex network, key nodes, gravity model, propagation feature, SIR
Citation: Zhong L, Gao X, Zhao L, Zhang L, Chen P, Yang H, Huang J and Pan W (2023) Identifying key nodes in complex networks based on an improved gravity model. Front. Phys. 11:1239660. doi: 10.3389/fphy.2023.1239660
Received: 13 June 2023; Accepted: 25 July 2023;
Published: 03 August 2023.
Edited by:
Chengyi Xia, Tiangong University, ChinaReviewed by:
Hai-Feng Zhang, Anhui University, ChinaXiaoke Xu, Dalian Nationalities University, China
Copyright © 2023 Zhong, Gao, Zhao, Zhang, Chen, Yang, Huang and Pan. This is an open-access article distributed under the terms of the Creative Commons Attribution License (CC BY). The use, distribution or reproduction in other forums is permitted, provided the original author(s) and the copyright owner(s) are credited and that the original publication in this journal is cited, in accordance with accepted academic practice. No use, distribution or reproduction is permitted which does not comply with these terms.
*Correspondence: Linfeng Zhong, Z29vZ2xlemxmQDE2My5jb20=
 Linfeng Zhong
 Xiangying Gao1