- 1National and Local Joint Engineering Research Center of Space Optoelectronics Technology, Changchun University of Science and Technology, Changchun, China
- 2College of Opto-Electronic Engineering, Changchun University of Science and Technology, Changchun, China
- 3Tianjin Navigation Instruments Research Institute, Tianjin, China
- 4School of Microelectronics, Tianjin University, Tianjin, China
- 5Beijing Space Electromechanical Research Institute, Beijing, China
- 6State Key Laboratory of Applied Optics, Changchun Institute of Optics, Fine Mechanics and Physics, China Academy of Sciences, Changchun, China
Considering the advancement in marine research in recent years, studies on the identification of offshore scenery are becoming popular globally. In this study, multiband polarimetric imaging is presented to address the deficiencies of the previous single-band study. Polarization imaging experiments of sea fog and non-sea fog in an indoor simulated environment are carried out and compared and analyzed by establishing an artificial simulation system to characterize the sea fog concentration by optical thickness with different concentrations of sea fog environment as the medium. The polarization information of each waveband converted by Stokes parametric is then brought into the two-dimensional discrete wavelet algorithm for image fusion processing. The findings indicate that when the optical thickness of sea fog increases, the polarized light in the chaotic medium recedes and the effect of the image blurs. Finally, after the image fusion process, the contrast of the image is improved and the detail of the target contour is obvious, which proves that the method has good robustness under the low signal-to-noise ratio of the sea fog environment. This provides a solid platform for targeted surveys and civic operations under dense marine fog conditions.
1 Introduction
The scattering and absorption of light by the higher concentration of sea salt aerosol particles suspended above the sea surface during atmospheric transmission results in a faster light attenuation [1], which causes the scattered background light to be superimposed on the target single-channel light to form noise [2, 3]. Consequently, maritime scenes are more susceptible to chaotic environments compared with those of nonmaritime. Essentially, this causes the imaging to appear with a more complex target background, blurred effects, large coverage of detailed information, and a significant decrease in contrast, which directly impacts the accuracy of the analysis and evaluation of the imaging content [4]. Polarized light has a greater ability to “penetrate clouds and fog” [5]. Compared with conventional optical imaging methods, polarized imaging technology can obtain the target characteristics from a greater distance and highlight its features against a unique background [6]. In addition, the amount of energy absorbed by different wavelengths of light significantly varies; these polarization properties of light can be used to obtain multiwavelength polarization images in complex sea fog environments to subsequently provide critical data for imaging analysis and the remote sensing of sea fog scenes.
Researchers have examined the transmission qualities of polarized light in land fog environments; however, studies regarding the transmission characteristics of polarized light in sea fog environments remain limited. Zhang et al. [7] utilized the Mie theory to compute the attenuation, asymmetry factor, and absorption probability of radiation interacting with sea spray particles in each radius area, and monitored the scattering process in a polydisperse sea spray layer using a modified Monte Carlo model. Guan et al. [8] used an all-day image polarimetry system to constantly collect polarization patterns throughout the day and night and compared these findings with those generated by the libRadtran radiative transfer software. Their findings indicated that the distribution of sky light polarization over water is nearly identical to that over land. Under overcast skies, the polarization angles and degrees are substantially less precise. Van der Laan et al. [9] employed a polarization-tracking Monte Carlo approach to simulate polarized light propagation fog using four MODTRAN fog models (moderate and heavy radiation and moderate and heavy advection fog) and four observations of the actual fog particle distribution. He et al. [10] used the Stokes vector to characterize the polarization state of photons, calculated the Muller matrix based on the Mie scattering theory, used this matrix to reflect the scattering characteristics of sea fog particles, and used the Monte Carlo method to solve the vector radiative transfer problem in a sea fog environment to simulate the scattering of photons in sea fog particles.
Considering the aforementioned, in this study, sea fog characteristics were first analyzed and adopts the polarization imaging principle of liquid crystal phase retarder method; conducts the study of multi-band polarization imaging under sea fog environment indoors, acquires salt fog and water fog environment by controlling the simulation device to obtain the indoor simulation imaging experimental environment, and finally carries out image fusion processing of the obtained polarization information of each band. The study provides theoretical and technical support for high-precision imaging of marine targets.
2 Sea spray properties
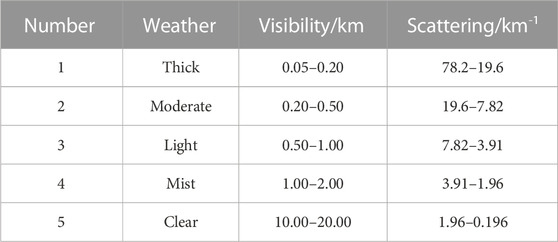
The development process of sea fog is affected by warm and humid air currents; essentially, the specific humidity of air, that is, wet air, mass of water vapor, and total mass of air (water vapor mass plus the mass of dry air) continue to increase. When the sea fog particle size is greater than 1 μm and owing to the increase in the number of coarse particles in the composition of sea fog, the visibility is affected. As the sea fog concentration is affected by the size of the sea fog particles, the amount of liquid water content, and several other factors, it is difficult to express with a simple relationship. Therefore, to elaborate on fog visibility, the size is often expressed in the form of fog concentration, as presented in Table 1 for various visibility levels [11].
Sea fog images, owing to their vast range, intense concentration, and extended maintenance time compared with land fog images, images feature unique properties, such as a greater depth of field, single hue, considerable variety in grayscale values, and lower relative number of objects [12]. Mie scattering occurs between the reflected light and suspended sea fog particles along the air propagation route if the target image is photographed in this environment. According to Koschmieder’s rule [13], as the scene depth increases, the decay law of the image brightness contrast exponentially diminishes, as expressed in the following equation.
Where
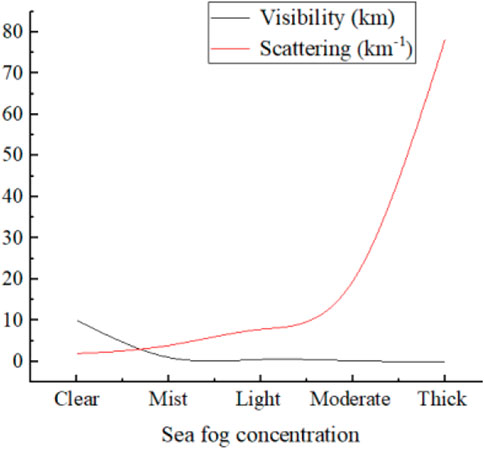
FIGURE 1. Relationship between the visibility and scattering coefficient at different sea fog concentrations.
In summary, in this study, a visible-range polarization camera was used to obtain polarized images of a scene in a sea fog environment at multiple wavelengths. Compared with imaging using a conventional intensity camera, polarized images of sea fog scenes have a purer background, contain less noise, are undistorted, and have more distinct edge contour characteristics.
3 Experimental principle
3.1 Adjustable phase-delay time-divisional polarization imaging system
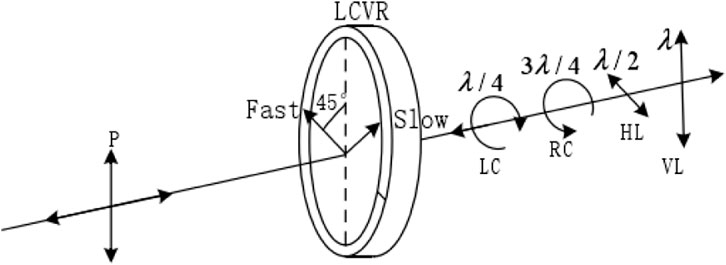
A liquid crystal variable retarder (LCVR) was used for polarization imaging, and the related imaging principle is shown in Figure 2. Two LCVRs were used; the transmission of the polarization prism was perpendicular to the optical axis of LCVR1, and the polarization prism was at an angle of 45° to the optical axis of LCVR2. The LCVR mainly changes the phase difference between the two orthogonal polarization components of the measured light wave, which is equivalent to the role of a waveplate in an optical device.
When a vertical beam of monochromatic line-polarized light is flashed through the LCVR, it is divided into two vibrational components, namely, slow and fast, with an equal phase and amplitude. Figure 3 illustrates the concept of the LCVR liquid crystal polarization modulation.
These two components can be expressed as follows.
Where
1) When a voltage is applied such that the phase delay of the LCVR is
A left-handed circularly polarized light is obtained when these two components are combined.
2) When the applied voltage causes the phase delay of LCVR to be 3λ/4, the component located in the slow axis propagates slightly faster, and a phase difference of 3π/2 is generated between the component propagating along the slow axis and component propagating along the fast axis. This can be expressed as follows.
A right-handed circularly polarized light is obtained when these two components are combined.
By analogy, when the driving voltage is applied such that the phase delay of the LCVR is
This imaging approach utilizes a voltage-controlled liquid crystal phase retarder to collect the Stokes parameters without the mechanical rotation of the polarization instrument. This imaging technique has a low reaction time and high precision.
3.2 Principle of two-dimensional discrete wavelet transform
From Figure 4A, it can be seen that the specific process of two-dimensional wavelet decomposition is as follows: first, one-dimensional wavelet decomposition is performed on the one-dimensional data constituting each row in the image, and then one-dimensional wavelet decomposition is done on the one-dimensional data in each column of the low and high frequency information formed by the decomposition, and finally four sub-band images are obtained:
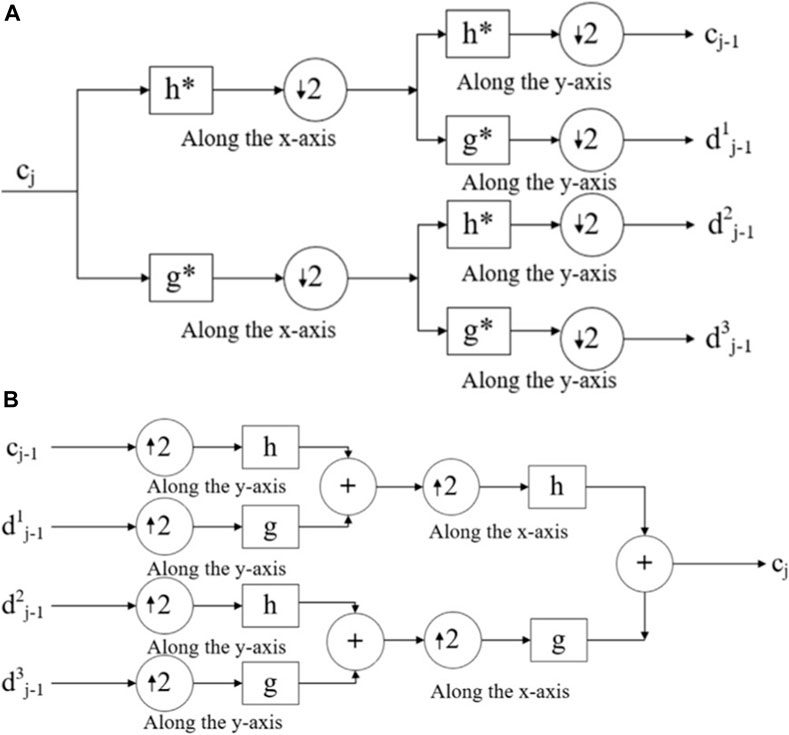
FIGURE 4. Filter bank representation of the two-dimensional Mallat fast algorithm. (A) Wavelet decomposition. (B) Wavelet reconstruction
3.3 Fusion rule based on the coefficient of maximum absolute value
After the image is wavelet transformed, the low-frequency sub-band coefficients still reflect the average energy of the image, and the high-frequency sub-band coefficients reflect the detail information of the image such as edges and textures in different directions. The fusion is performed by using the criterion of weighted average of low-frequency coefficients and the coefficients of high-frequency coefficients are selected to have the largest absolute value, which focuses on fusing the high-frequency parts containing significant details of the images and helps to improve the visual effect of the fused images and retain the significant detail information in the source images. Let the coefficients
The weighted average fusion criterion for the low frequency sub-bands is
where
4 Indoor multi-band polarization imaging experiment
Experimenting with external field polarization imaging in a genuine sea fog scenario is the most straightforward and conventional approach for studying polarization imaging. During external field imaging studies, imaging is susceptible to weather and other variables, thus rendering the experimental conditions complicated and varied. Therefore, indoor simulation experiments were conducted to compare multi-band imaging in simulated sea fog and non-sea fog environments. The accuracy of the polarization imaging results improved owing to the controllability of the indoor imaging environment and repeatability of the experiments.
Since the Stokes full polarization camera is based on the liquid crystal phase retarder method for imaging, this paper performs multi-band imaging by using the Stokes full polarization camera (SALSA polarization camera); then the polarization information of each band after conversion from the Stokes parametric [17–20] is brought into the two-dimensional discrete wavelet algorithm for image fusion processing by the Stokes parametric.
4.1 Experimental design of the simulated environment for polarization imaging
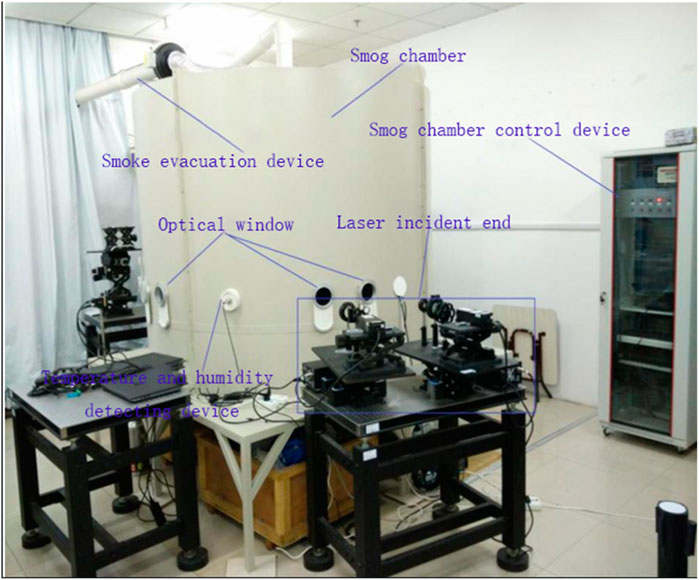
The indoor simulation system device was used to simulate sea fog and non-sea fog environments; an optical imaging experiment was performed in this environment, known as the sea fog box, as shown in Figure 5. The majority of the control section of the sea fog chamber consists of four main components: a sea fog generating device, stirring device, intake and exhaust device, and measuring and detecting equipment.
The detection window may be a concentration monitoring, aerosol particle size detection, visibility detection device, temperature and humidity detection device, power supply cable interface, or interface for other equipment cables. A water mist generator pipe intake, illumination device, and exhaust port were mounted on top of the box. The bottom of the box provides access to the smoke generator pipeline entrance, mixing fan mouth, and two spare detection windows.
Aerosols are also considered as sea fog arising from seawater through evaporation that forms marine aerosols in the atmosphere. Therefore, in this study, seawater was artificially sprayed through an ultrasonic atomizer device to the sea fog box as salt spray to simulate the sea fog environment. Considering the manufactured seawater, the ratio of water to sea salt was 1:2.99 at a temperature of 25°C. Therefore, artificial sea salt particles were purchased, and artificial seawater was rationed according to the aforementioned ratio. The imaging experimental steps are listed as follows.
1) Experimental imaging platform construction: The salt spray in the sea fog box was used as the medium, lighting in the sea fog box was turned on, and optical imaging platform was built outside the sea fog box, as shown in Figure 6.
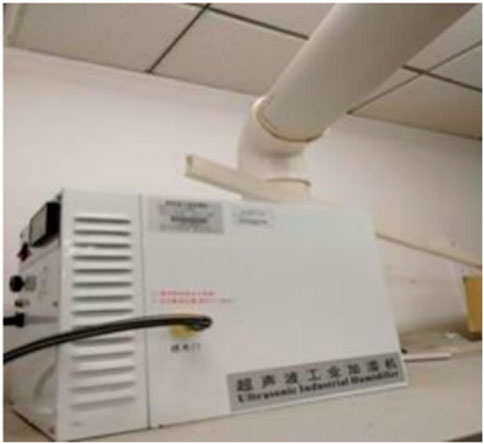
2) Salt fog environment preparation: An ultrasonic atomizer was used as the salt fog creation equipment, as shown in Figure 7. The sea fog machine was controlled to remove synthetic saltwater from the tank to fill the dry sea fog box with a salt spray. The salt mist medium was injected from top to bottom into the dry sea fog box. The salt mist was naturally dispersed in the sea fog box for 5–15 min to allow the salt mist particles to equally fill the box.
3) Experimental data recording: The filter was changed and the intensity images of the red (670 nm), green (530 nm), and blue (450 nm) bands were obtained.
4) If the experimental conditions are expected to change, the media evacuation mechanism must be opened and a box containing the salt spray particles is emptied. After a significant number of tests, the salt spray concentration in the sea fog box was lowered to zero, following 5 min after the medium was emptied. By changing the fog filling time to alter the salt spray concentration, the salt spray media in the sea fog box were at rest, followed by a series of multiband imaging tests in environments with varying salt spray concentrations.
5) Experimental data processing: For image processing, multiband intensity pictures of various amounts of salt spray were obtained, and the associated multiband polarization images were determined.
For comparison with salt spray media imaging, a water mist imaging comparison experiment is conducted here. This experiment simulates water mist under ideal conditions, and the main component of this aerosol is water. The artificial seawater in the water tank is emptied and cleaned, and the water tank is filled with an appropriate amount of pure water to spray water mist into the sea mist tank, and the above experimental steps 1) to 5) are repeated.
Since the indoor polarization imaging experiments were conducted with different concentrations of salt spray and water mist environment as the medium, it was seen that it was crucial to get equal concentration values of salt spray and water mist in a smooth situation. Due to the restricted experimental conditions, it is not possible to obtain information about the medium concentration directly through the instrument, so this experiment is conducted to measure the medium concentration by measuring the light intensity of the incident light and the light intensity of the outgoing light.
During the experiment, the medium concentration has instability, so the concentration of each medium obtained at different fog filling times can be characterized by the optical thickness. The Beer-Lambe law shows that when light is incident into a homogeneous medium, the relationship between the incident light intensity and the outgoing light intensity is as follows.
Where
In the above equation,
In the case of constant particle size, the media thickness L value also remains constant, and the right side
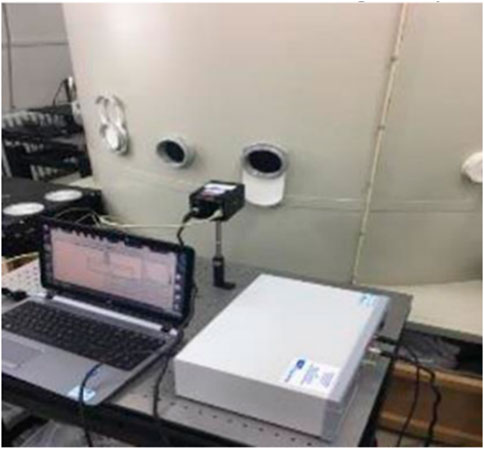
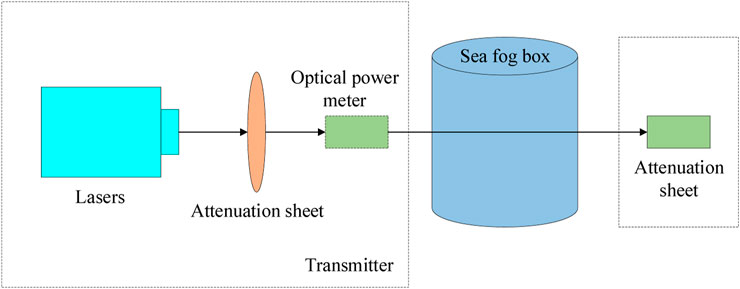
The above formula shows that only the incident light intensity and the outgoing light intensity can be obtained to calculate the optical thickness of each medium, the experimental process of light intensity measurement is shown in Figure 8. In the indoor experimental process, the fog filling time can be controlled to obtain to different concentrations of the medium environment. First, through the ultrasonic atomizer to the sea box body spray salt spray and wait for the medium to fill the sea fog box, in order to ensure that the received laser power range in the optical power meter range, a beam of laser through the attenuation piece for attenuation, by adjusting the attenuation piece to make the laser output power of 5 mW at the transmitting end, and record the incident light intensity, and then the laser through the sea fog box body and in the box under the action of the internal uniform medium Then the laser passes through the sea fog box and scattering phenomenon occurs under the action of uniform medium inside the box, and finally reaches the receiving end, and again uses the optical power meter at the receiving end to measure the outgoing light in order to get the value of the outgoing light intensity in the continuous stable environment.
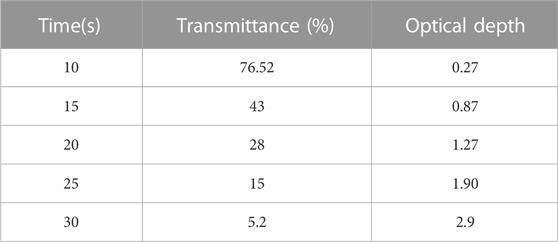
In the previous experiment, the medium entered a stable condition for approximately 5–10 min after being filled with salt spray. When the incident light intensity was the same, an optical power meter was used to measure the incident light intensity value through the medium under various fog-filling times. Five groups of salt fog were filled, and the corresponding outgoing light intensity values were recorded to calculate the light transmission rate and optical thickness. To minimize excessive errors, the average value was determined via five separate trials. Table 2 presents the relationship between the salt-spray filling time, light transmission rate, and optical thickness.
4.2 Experimental results and analysis
To characterize the low and high concentrations of the medium in the sea fog box, indoor tests were chosen when the optical thickness was 0.27 and 2.9. Controlling the water mist filling time to achieve the same optical thickness as the salt mist produced in a water–mist environment. The model of a tank was chosen as the subject of the multiband polarization imaging study. Figure 9 depicts multiband pictures of the salt mist environment, where (a)–(c) represent the medium environment with a low concentration, and (d)–(f) represent the medium environment with a high concentration.
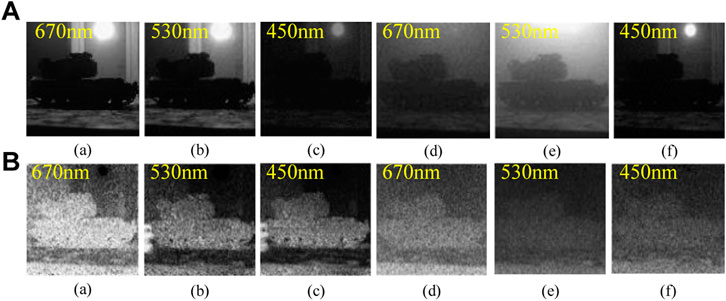
FIGURE 9. Multi-band image of the salt spray environment. (A) intensity image; (B) polarization image. (a–c): pdlow- concentration medium environment; (d–f) high- concentration medium environment.
Figure 10 presents the multi-band images of the water mist environment, where (a)–(c) indicate low-concentration media and (d)–(f) indicate high-concentration media environments.
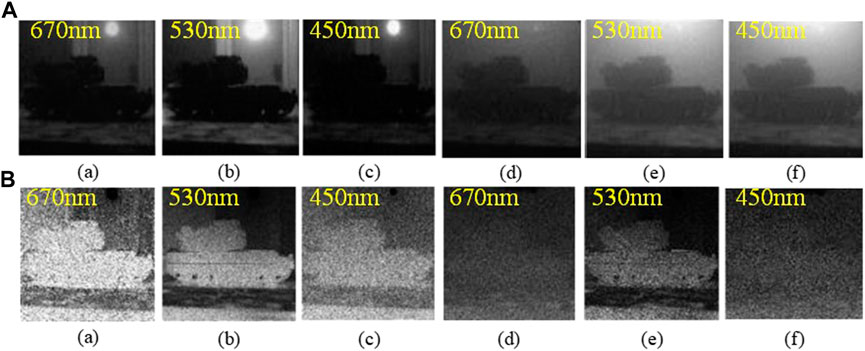
FIGURE 10. Multi-band images of the water mist environment. (A) intensity image; (B) polarization image. (a)–(c): low concentration medium environment; (d)–(f): high concentration medium environment.
For this experiment, five polarization imaging sessions were performed, the degree of polarization (DOP) data of the corresponding intensity and polarization images were obtained, and the results were averaged for data analysis. The experimental results are shown in Figure 11.
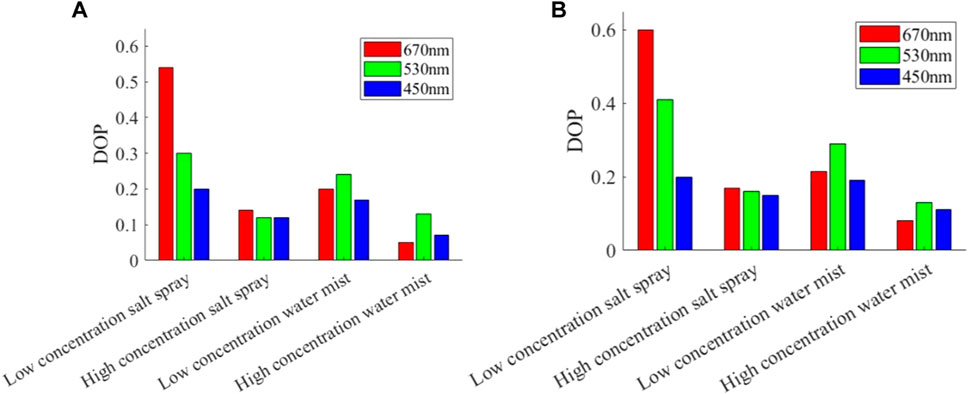
FIGURE 11. Comparison of the multi-band imaging polarization parameters DOP for the indoor simulated environment. (A) Intensity (B) polarimetric image.
As indicated by the histogram, the DOP of the polarization image decreased when the concentration of the medium was high. This is because the DOP of the polarization image decreases as the concentration increases as the polarized light appears to be significantly depolarized owing to multiple scattering. The largest DOP of the polarimetric image occurred at a wavelength of 670 nm, thus indicating that the image includes a considerable quantity of polarization information, and the observational effect was enhanced. This is because at various concentrations, the absorption and scattering of light waves by water mist particles in the 530 nm band have a greater impact, thereby resulting in a higher penetration rate of water mist particles in this band, which improves the imaging effect and clarifies the edge contour.
Figure 12 shows the polarization fusion image based on two-dimensional discrete wavelet transform; where a) is the multi-band polarization fusion image in low concentration salt mist medium environment, b) is the multi-band polarization fusion image in high concentration salt mist environment, c) is the multi-band polarization fusion image in low concentration water mist medium environment, and d) is the multi-band polarization fusion image in high concentration water mist environment.
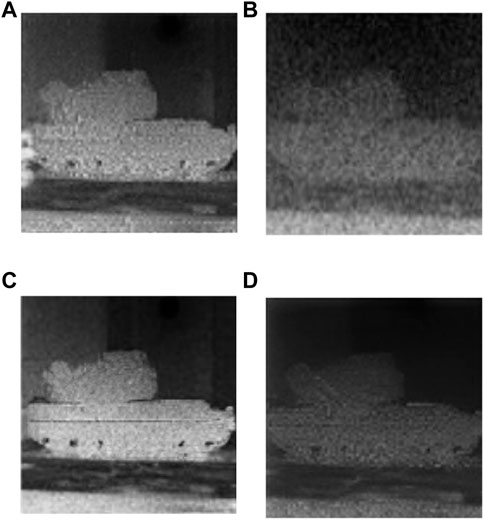
FIGURE 12. shows the polarization fusion image based on 2D discrete wavelet transform. (A) the multi-band polarization fusion image in low concentration salt mist medium environment, (B) the multi-band polarization fusion image in high concentration salt mist environment, (C) the multi-band polarization fusion image in low concentration water mist medium environment, (D) the multi-band polarization fusion image in high concentration water mist environment.
The analysis in Table 3 shows that the polarization image fusion method based on the two-dimensional discrete wavelet transform can make the image eliminate noise to a large extent, improve image contrast, and retain some high-frequency details and texture information in the image while recovering the image. The practice shows that the method has good robustness to low signal-to-noise ratio.
5 Conclusion
In this study, we firstly conducted a study on the characteristics of sea fog, and carried out an indoor comparison experiment of multi-band polarization imaging in sea fog environment by using the principle of multi-band polarization imaging to address the shortcomings of the existing research on a single waveband. The experiments revealed that as the sea fog density increased, the polarization light appeared depolarized and the quality of the polarization picture degraded, with the greatest image effect occurring in the 670 nm band in the sea fog environment. When conducting imaging in the same concentrations of salt fog and water fog, the imaging effect of the salt fog environment in the 670 nm band was superior to that of other bands; however, the imaging effect in the water fog environment was superior in the 530 nm band and fused the obtained polarization images of each waveband with the two-dimensional discrete wavelet transform. And the two-dimensional discrete wavelet transform was used to fuse the obtained polarization images of each waveband. It was found that the image fusion technique of wavelet transform can improve the contrast effect of the image and enhance the detail features of the image.
Data availability statement
The raw data supporting the conclusion of this article will be made available by the authors, without undue reservation.
Author contributions
Data curation, QF and NL; Investigation, HG and LW; Methodology, YL; Project administration, ZL and QF; Resources, SZ; Software, JZ; Supervision, HS; Visualization, YT and JL; Writing—review and editing, NL All authors contributed to the article and approved the submitted version.
Funding
Natural Science Foundation of China (Nos. 61890963, 61890960, 62127813). Open Fund of State Key Laboratory of Applied Optics (No. SKLAO2021001A08).
Acknowledgments
Thanks the Natural Science Foundation of China for help identifying collaborators for this work.
Conflict of interest
The authors declare that the research was conducted in the absence of any commercial or financial relationships that could be construed as a potential conflict of interest.
Publisher’s note
All claims expressed in this article are solely those of the authors and do not necessarily represent those of their affiliated organizations, or those of the publisher, the editors and the reviewers. Any product that may be evaluated in this article, or claim that may be made by its manufacturer, is not guaranteed or endorsed by the publisher.
References
1. Gultepe I, Tardif R, Michaelides SC, Cermak J, Bott A, Bendix J, et al. Fog research: A review of past achievements and future perspectives. Pure Appl Geophys (2007) 164(6):1121–59. doi:10.1007/s00024-007-0211-x
2. Ryu HS, Hong S. Sea fog detection based on Normalized Difference Snow Index using advanced Himawari imager observations. Remote Sensing (2020) 12(9):1521. doi:10.3390/rs12091521
3. Guo X, Wan J, Liu S, Xu M, Sheng H, Yasir M. A scSE-LinkNet deep learning model for daytime Sea Fog detection. Remote Sensing (2021) 13(24):5163. doi:10.3390/rs13245163
4. Wang P, Li D, Wang X, Guo K, Sun Y, Gao J, et al. Analyzing polarization transmission characteristics in foggy environments based on the indices of polarimetric purity. IEEE Access (2020) 8:227703–9. doi:10.1109/access.2020.3045993
5. Juntong Z, Shicheng B, Su Z, Qiang F, Yingchao L, Jin D, et al. The research of long-optical-path visible laser polarization characteristics in smoke environment. Front Phys (2022) 277. doi:10.3389/fphy.2022.874956
6. Jeon HK, Kim S, Edwin J, Yang CS. Sea fog identification from GOCI images using CNN transfer learning models. Electronics (2020) 9(2):311. doi:10.3390/electronics9020311
7. Zhang C, Zhang J, Wu X, Huang M. Numerical analysis of light reflection and transmission in poly-disperse sea fog. Opt Express (2020) 28(17):25410–30. doi:10.1364/oe.400002
8. Guan L, Li S, Zhai L, Liu S, Liu H, Lin W, et al. Study on skylight polarization patterns over the ocean for polarized light navigation application. Appl Opt (2018) 57(21):6243–51. doi:10.1364/ao.57.006243
9. van der Laan JD, Wright JB, Kemme SA, Scrymgeour DA. Superior signal persistence of circularly polarized light in polydisperse, real-world fog environments. Appl Opt (2018) 57(19):5464–73. doi:10.1364/ao.57.005464
10. He L, Duan J, Zhang S, He J, Zhan J, Fu Q. Simulation study of laser polarization transmission characteristics in sea fog environment. Adv Lasers Optoelectronics (2021) 58(3):0329001. doi:10.3788/LOP202158.0329001
11. Yang B, Yan CX. Multi-spectral polarized properties of ocean aerosol. GuangpuxueyuGuangpu fen xi= Guangpu (2016) 36(9):2736–41.
12. Song Y. Study of polarization transmission characteristics in sea fog environment. Changchun City, Jilin Province, China: Changchun University of Science and Technology (2020). doi:10.26977/d.cnki.gccgc.2020.000907
13. Huang J, Wang B, Wang X, Huang F, Lü W, Jing T. The spring yellow Sea fog: Synoptic and air–sea characteristics associated with different airflow paths. Acta OceanologicaSinica (2018) 37(1):20–9. doi:10.1007/s13131-018-1155-y
14. Wang Y, Su Y, Sun X, Hao X, Liu Y, Zhao X, et al. Principle and implementation of Stokes vector polarization imaging technology. Appl Sci (2022) 12(13):6613. doi:10.3390/app12136613
15. Ni G, Xiao M, Qin Q, Huang G. Development of near-natural color image fusion algorithm and its real-time processing system. J Opt (2007)(12) 2101–9.
16. Zhang C, Cheng H, Chen C, Zheng W, Cao Y. Optical and infrared polarization imaging of camouflage barriers. Infrared Laser Eng (2009) 38(03):424–7.
17. Xia P, Tahara T, Kakue T, Awatsuji Y, Nishio K, Ura S, et al. Performance comparison of bilinear interpolation, bicubic interpolation, and B-spline interpolation in parallel phase-shifting digital holography. Opt Rev (2013) 20:193–7. doi:10.1007/s10043-013-0033-2
18. Gao S, Gruev V. Bilinear and bicubic interpolation methods for division of focal plane polarimeters. Opt express (2011) 19(27):26161–73. doi:10.1364/oe.19.026161
19. Xu X. Design and experimental study of partial amplitude measurement system for polarized Stokes parameters. Zhejiang Province, China: Zhejiang University (2011).
20. Chen W, Wang X, Jin W, Li F, Cao Y. An experiment of target detection using middle wave infrared polarization imaging. Infrared Laser Eng (2011) 40(01):7–11.
Keywords: sea fog environment, multi-band polarization imaging, optical thickness, polarization images, image processing
Citation: Liu N, Fu Q, Guo H, Wang L, Tai Y, Liu Y, Liu Z, Shi H, Zhan J, Zhang S and Liu J (2023) Multi-band polarization imaging and image processing in sea fog environment. Front. Phys. 11:1221472. doi: 10.3389/fphy.2023.1221472
Received: 12 May 2023; Accepted: 13 June 2023;
Published: 21 June 2023.
Edited by:
Ben-Xin Wang, Jiangnan University, ChinaReviewed by:
Yi Ma, First Institute of Oceanography, Ministry of Natural Resources, ChinaYao Hu, Beijing Institute of Technology, China
Copyright © 2023 Liu, Fu, Guo, Wang, Tai, Liu, Liu, Shi, Zhan, Zhang and Liu. This is an open-access article distributed under the terms of the Creative Commons Attribution License (CC BY). The use, distribution or reproduction in other forums is permitted, provided the original author(s) and the copyright owner(s) are credited and that the original publication in this journal is cited, in accordance with accepted academic practice. No use, distribution or reproduction is permitted which does not comply with these terms.
*Correspondence: Qiang Fu, Y3VzdF9mdXFpYW5nQDE2My5jb20=; Zhuang Liu, Wmh1YW5nemhpbGluZ3l1bjIwMDdAYWxpeXVuLmNvbQ==
 Nan Liu1
 Qiang Fu
 Juntong Zhan