 Zhiguo An1,2
 Yongqi He
 Xilin Wang
95% of researchers rate our articles as excellent or good
Learn more about the work of our research integrity team to safeguard the quality of each article we publish.
Find out more
ORIGINAL RESEARCH article
Front. Phys. , 25 September 2023
Sec. Optics and Photonics
Volume 11 - 2023 | https://doi.org/10.3389/fphy.2023.1219465
Silicone rubber in power transmission and transformation equipment is subjected to considerable temperature changes under different application environment conditions and in different operational states. In tropical areas and the Turpan region of China, surface temperatures of silicone rubber insulators may reach or exceed 70°C. During in situ testing of silicone rubber, the spectral signal may fluctuate or even be distorted when the temperature changes, and consequently, the accuracy of the analysis may be affected. Therefore, we performed a LIBS-based investigation into the dependence of the spectral signal of rubber silicone on the sample temperature. Using high-temperature vulcanized silicone rubber as the experimental material, we determined the trends in spectral line intensity for different elements, plasma temperature, and electron density with temperature when the sample temperature was increased from 25°C to 310°C. The results indicated that the intensities of the Al I 394.40 nm, Al I 396.15 nm, and Si I 390.55 nm lines in the LIBS spectra underwent a gradual decrease as the temperature was increased, whereas the intensity of the Al I 309.27 nm spectral line was essentially stable. However, the spectral line intensity, plasma temperature, and electron density all exhibited a spike at approximately 260°C, which occurred because of the decomposition of aluminum hydroxide. The results of the present study should prove to be of significance in further increasing the accuracy of LIBS analysis as applied to silicone rubber surface monitoring in high-temperature environments.
Laser-induced breakdown spectroscopy (LIBS) is a modern analytical technique based on emission spectroscopy. In LIBS, a laser pulse is focused on the surface of a substance, which causes ablation and the formation of a plasma. This enables qualitative and quantitative elemental analysis of the substance through measurement of the plasma spectrum. LIBS has received widespread attention due to its advantages of simple operation, rapid analysis, high sensitivity, and remote-measurement capability. It has broad applicability across a vast array of different fields, including pollution monitoring [1, 2], industrial analysis [3], space exploration [4, 5], artifact identification [6, 7], and geological exploration [8, 9].
Silicone rubber composite materials are widely used in high-voltage external insulation for power transmission cables due to their excellent hydrophobicity and hydrophobic migration characteristics. However, the inevitable effects of high temperature, ultraviolet radiation exposure, and discharges degrade silicone rubber, leading to material loss, in insulator sheds; this results in decreased hydrophobicity, fading, crumbling, and increased hardness. Researchers have utilized LIBS to monitor the state of silicone rubber by characterizing its hardness, roughness, and state of aging [10–12]. However, the temperature of silicone rubber is often poorly controlled due to the complexity of the operating environment. Sample temperatures generally vary considerably in power transmission and transformation equipment located in various hot climates. For instance, temperatures may reach 70°C in the Turpan region of China, which has the hot and dry Gobi Desert climate. The spectral signal may therefore fluctuate or become distorted at high temperatures, which will affect the accuracy of the analysis. To ascertain the times of day and types of application environments suitable for LIBS testing, the dependence on the sample temperature of the LIBS signal of silicone rubber must be studied.
There is currently limited research on the effects of sample temperature on LIBS signals. In 2009, Tavassoli and Gragossian [13] investigated the effect of the initial temperature of the target material on the spectral intensity of the laser-induced plasma on the surface of an aluminum alloy. Their results indicated that higher sample temperatures produced increased spectral line intensities, which enabled the authors to demonstrate improved limits of detection. A 2012 study by Sanginés et al. [14] explored the effects of heating the target material on the laser-induced plasma and found that increasing the target/material temperature resulted in enhancement of the LIBS radiation intensity, with the signal-to-noise ratio being increased by an order of magnitude. In the same year, Sanginés et al. [15] also investigated the mechanisms by which the radiation intensity was increased by increasing the target material temperature in orthogonal double-pulse LIBS. A study by Eschlböck-Fuchs et al. [16] in 2013 measured the plume expansion dynamics and optical emission spectra of laser-induced plasma using samples of a bulk aluminum alloy, silicon wafer, and metallurgical slag at different temperatures. It was observed that higher sample temperatures were correlated with plasmas with greater plume sizes and stronger emission signals. In 2014, Darbani et al. [17] investigated the effect of sample heating on the laser-induced emission spectra of alloys, reporting that the LIBS signal intensity and spectral width increased when the samples were heated to 200°C. In the same year, Hanson et al. [18] reported their observation of the effects of temperature and phase on LIBS spectra and found that Ce and Mn spectral line intensities varied as the temperature of salt samples was changed. The signal intensity was highest at the phase transition temperature, and the next-highest signal was obtained from solid samples. A study by Liu et al. in 2016 [19] reported the acquisition of laser-induced semiconductor plasma spectra at different temperatures, and the results indicated that higher target temperatures produced greater spectral line intensities. In 2017, Liu et al. [20] investigated the dependence of the plasma plume on the target temperature; they found that the size of the plasma plume increased significantly with temperature. This result demonstrates that increasing the sample temperature enhances the coupling between the laser and target material, thereby altering the plume expansion kinetics of the laser-induced plasma. In the same year, Wang et al. [21] studied the effect of sample temperature on the femtosecond laser-induced plasmas of glass, and observed that the intensity of the emission lines of the plasma increased significantly with temperature. A study by Lednev et al. in 2019 [22] investigated the effect of the sample temperature on LIBS. Their results showed that the spectral signal remained virtually unchanged up to a temperature of 1,000 °C, but the sample remained in the solid state. When the sample temperature was increased to 1,500°C, the samples were in the molten state and the corresponding LIBS signal intensity and electron number densities were significantly increased, while the plasma temperature was almost unchanged. The above studies demonstrate that raising the temperature of a sample effectively enhances the laser–matter interactions. However, all of these studies only involved the use of metal samples, and there is a lack of relevant research on the effects of temperature variation on the LIBS signals of non-metals.
In the present study, LIBS was performed on samples of high-temperature vulcanized silicone rubber at different temperatures to explore the ways in which the sample temperature affected the LIBS signal of silicone rubber. Variations in spectral line intensity, plasma temperature, and electron density with sample temperature were characterized based on analysis of the spectral data. The origin of the spike in the spectral signal at approximately 260°C was determined based on thermogravimetric analysis (TGA) and an analysis of the temperature dependence of the spectral signals of aluminum hydroxide samples.
Figure 1 shows a schematic of the LIBS experiment setup. A nanosecond pulse laser (Model: Nimma-900; Beamtech Optronics, Beijing, China) was used (output wavelength: 1,064 m; pulse width: 8 ns; pulse repetition frequency: 1 Hz) to generate the LIBS signal. Spectra were acquired using a 6-channel spectrometer (Avantes Beijing, Beijing, China) with a resolution of approximately 0.05 nm. Delays were generated by a digital delay generator (DG645, Stanford Research Systems, Inc., Sunnyvale, CA, USA), with gate delay and gate width times of 2.5 and 30 µs, respectively.
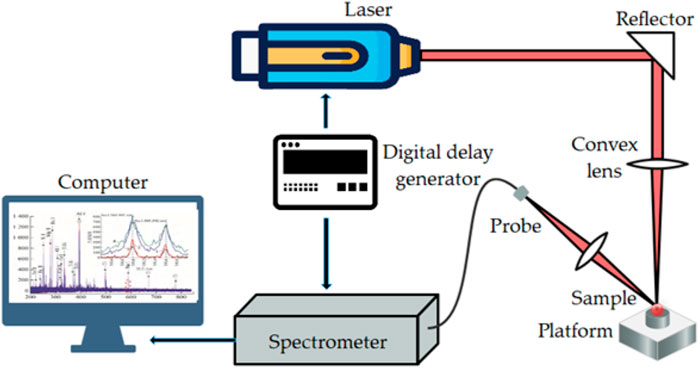
FIGURE 1. Schematic of LIBS setup.
The laser beam was focused vertically on the surface of the sample through a convex lens with a focal length of 10 cm, forming a spot of approximately 0.8 mm in diameter. During spectral acquisitions, the measured energy of the laser pulse at the sample surface was 35 mJ, which is sufficient to produce sample ablation and plasma formation. The spectrometer was controlled by the digital delay generator, which allowed the plasma signal to be acquired after a time delay. The plasma signal was converted by a charge-coupled device (CCD) into electrical signal and was transferred to a computer.
The samples used in the experiment were 5 cm × 5 cm × 1 mm squares of high-temperature vulcanized silicone rubber. The samples were heated and kept warm using a high-precision digital display laboratory heating platform (maximum temperature: 600°C). At high temperatures, a considerable temperature difference existed between the surfaces of the platform and sample, and consequently the temperature displayed by the heating platform did not reflect the actual temperature of the sample surface. Therefore, the temperature of the sample surface was monitored using a laboratory infrared thermal imager (Model: FLIR ONE Pro; Teledyne FLIR, Shanghai, China).
During the experiment, the temperature of the sample is raised by varying the target temperature of the heating platform, and the temperature of the sample was gradually increased from room temperature (25°C) to 310°C, and LIBS measurements were obtained at 25°C, 55°C, 75°C, 100°C, 125°C, 145°C, 170°C, 190°C, 210°C, 230°C, 250°C, 265°C, 275°C, 290°C, and 310°C. The experiment was repeated using different laser pulse energies (15, 25, 35, and 45 mJ). To minimize the effects of laser pulse energy fluctuation on the laser ablation, for each sample temperature and laser energy, ten different test points were selected for ten consecutive shots, and the average of the ten spectral datasets was used in the subsequent analysis.
The spectrum of the high-temperature vulcanized silicone rubber samples at room temperature are shown in Figure 2. It can be found that the stronger spectral lines in the spectrum are dominated by Al, Si and O. When using LIBS for characterization and analysis of silicone rubber adhesive content and hardness, the Al and Si spectral lines are often used as the characteristic spectral lines to establish the calibration model. To understand the effect of sample temperature on the accuracy of silicone rubber LIBS analysis, the Al I 309.27 nm, Al I 394.40 nm, Al I 396.15 nm, and Si I 390.55 nm spectral lines were analyzed to determine the dependence of their intensities on temperature.
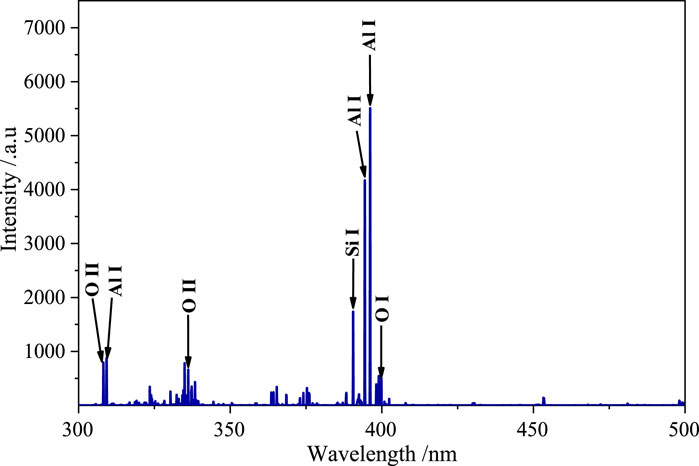
FIGURE 2. Spectrum of high temperature vulcanized silicone rubber.
Figure 3 shows the variations in intensity of the four spectral lines with sample temperature at a laser energy of 35 mJ. It can be observed that the intensities of the Al I 394.40 nm and Al I 396.15 nm spectral lines were relatively stable below 150°C. However, when the temperature was increased beyond 150°C, the spectral line intensities underwent a significant abrupt decrease, before stabilizing. Subsequently, an even more abrupt increase occurred at approximately 260°C. This was followed by a very sharp drop that was more significant than the decrease at 150°C. In contrast to the other three lines, the Al I 309.27 nm spectral line only exhibited one intensity increase, which occurred abruptly at approximately 260°C and was followed by a similarly abrupt decrease; very little temperature change was observed over the other temperatures in the observation range. The intensity of the Si I 390.55 nm spectral line also spiked at approximately 260°C, while exhibiting a gradual decline over the entire extent of the sample temperature observation window.
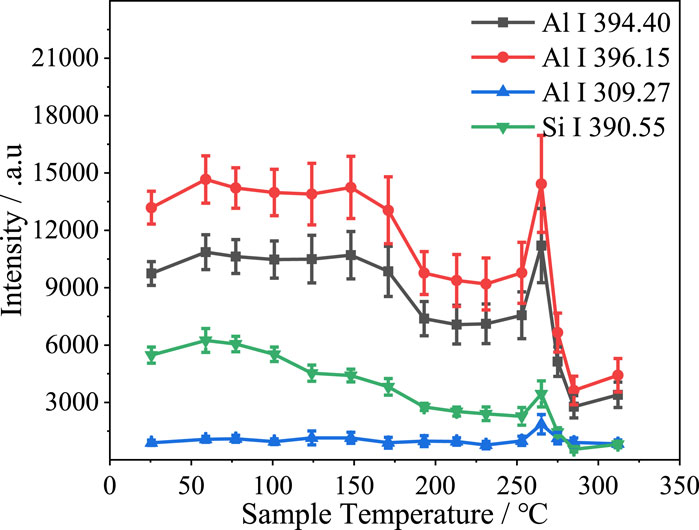
FIGURE 3. Variation in spectral line intensity with sample temperature at a laser energy of 35 mJ.
Figure 4 shows the variations in the intensity of the Al I 309.27 nm, Al I 394.40 nm, Al I 396.15 nm, and Si I 390.55 nm spectral lines with sample temperature at different laser pulse energies. The intensity of the spectral lines increased with laser energy. However, the spectral line intensities were very similar at laser pulse energies of 35 and 45 mJ. This indicates that the maximum possible number of particles within the focal region of the laser was excited by the laser when the pulse energy was 35 mJ.
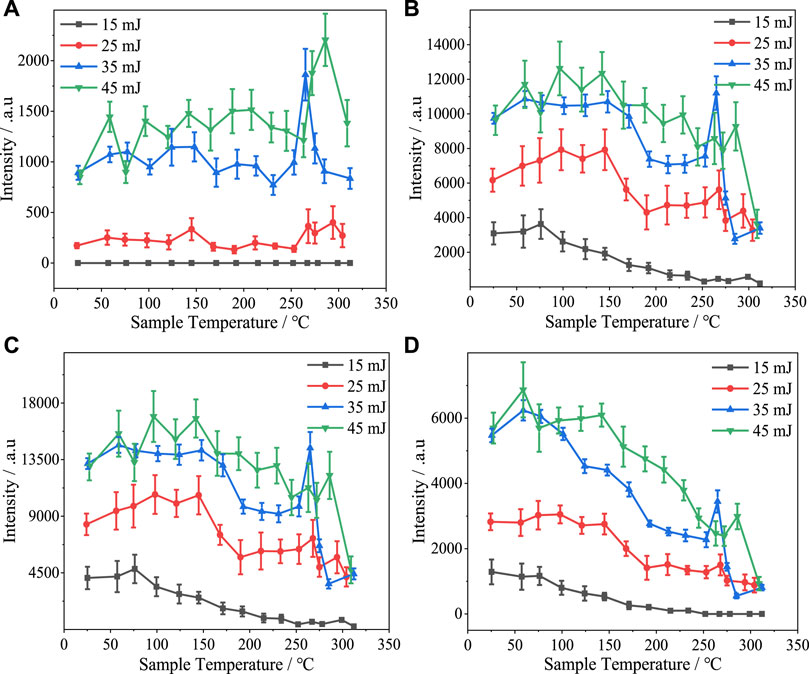
FIGURE 4. Variation in intensity with sample temperature of (A) Al I 309.27 nm, (B) Al I 394.40 nm, (C) Al I 396.15 nm, and (D) Si I 390.55 nm spectral lines under various laser pulse energy conditions.
Comparing the trends in intensity variation with sample temperature of the three Al spectral lines at different laser energies, it is apparent that increased sample temperature is correlated with a slight decrease in the intensities of the Al I 394.40 nm and Al I 396.15 nm spectral lines, while the intensity of the Al I 309.27 spectral line remains essentially stable as a function of temperature. At laser pulse energies of 35 and 45 mJ, an intense spike in the spectral line intensity occurred at approximately 260°C. When the laser pulse energy was 25 mJ, the spectral line intensity also increased at approximately 260°C, but to a lesser extent. When a laser pulse energy of 15 mJ was used, a spike was not observed, and the Al I 309.27 nm spectral line was barely visible at 260°C and beyond, indicating that the magnitude of the spike was dependent on both the laser pulse energy and spectral line intensity.
The intensity of the Si I 390.55 nm spectral line exhibited an obvious overall decrease as the sample temperature was increased. When the silicone rubber surface temperature reached 260°C, the intensity of this spectral line increased—albeit to a lesser extent than the increase at this temperature for the Al lines—at laser pulse energies of 25, 35, and 45 mJ, and the spectral line intensity did not exceed the intensity at room temperature in the case of each of these laser pulse energy conditions. As was the case for the three Al spectral lines, a larger spike in spectral line intensity occurred at higher laser pulse energies. Indeed, when the laser pulse energy was lowest (15 mJ), the spike did not occur, and the Si I 390.55 nm spectral line vanished at sample temperatures beyond 250°C.
Both the Al and Si spectral lines exhibited an overall trend of decreasing intensity with increasing sample temperature, and sometimes there is a dip in the region of 200°C–250°C. When LIBS was performed on silicone rubber samples at high temperatures, it was observed during the process of moving and re-positioning the samples that they were obviously softened under the higher temperature conditions. It was hypothesized that an increase in the temperature of the sample led to a decrease in its hardness and the velocity of the shock wave front. Consequently, the plasma gas was not effectively compressed, and hence the plasma intensity was decreased. To test this hypothesis, we studied a high-temperature vulcanized silicone rubber sample using dynamic mechanical analysis (DMA). The experiment was conducted in tension mode with a frequency of 1 Hz, temperature range of 25°C–350°C, temperature ramp rate of 5°C/min, and amplitude of 30 μm.
Figure 5 shows a DMA thermogram of the silicone rubber sample. The storage modulus E′ and loss modulus E″ are plotted versus temperature; E′ is often used to characterize the stiffness (i.e., hardness) of a material, whereas E″ to characterizes its viscosity. It can be observed that both E′ and E″ gradually decreased as the sample temperature increased, i.e., the stiffness and viscosity of the silicone rubber sample continuously decreased. This finding lends some support to our aforementioned hypothesis. And the hardness of the silicone rubber decreases slowly in the region of 150°C–250°C. Considering that the heating rate and the uniformity of heating are not perfect, the results are reflected in the emission intensity with a certain randomness, which can be seen from the variation of the spectral intensity with sample temperature at different laser energies in Figure 4.
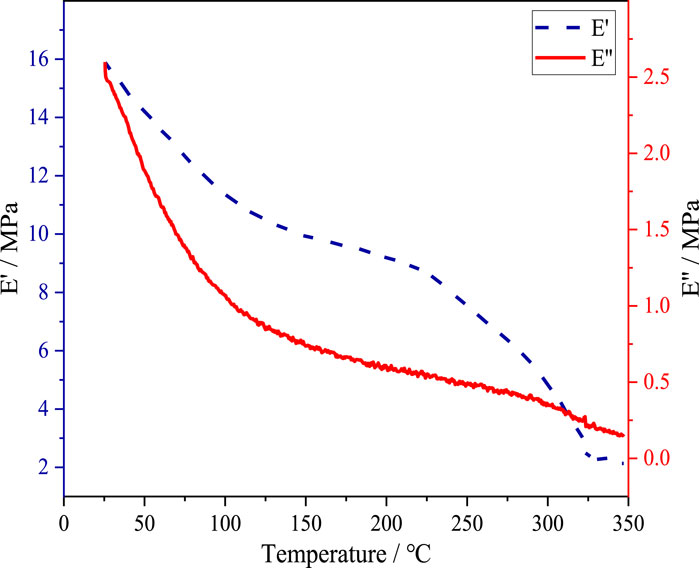
FIGURE 5. DMA thermogram of the high-temperature vulcanized silicone rubber sample.
To investigate the origin of the spike in spectral line intensity at approximately 260°C, TGA was performed on a high-temperature vulcanized silicone rubber sample. Figure 6 shows the TGA thermogram of the sample, with sample mass plotted versus sample temperature, where it is apparent that the sample underwent two weight loss stages. The first stage occurred at 250°C–350°C and can be attributed to the decomposition of the aluminum hydroxide filler; the second stage, corresponding to siloxane decomposition, occurred at 400°C–500°C.
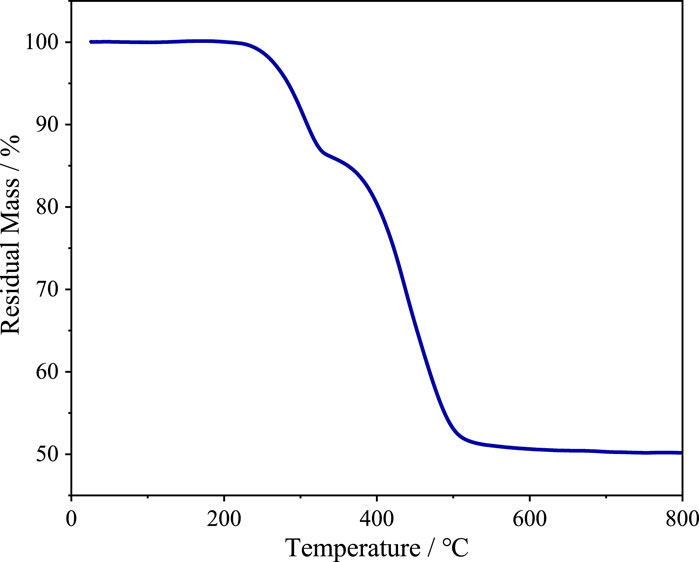
FIGURE 6. TGA thermogram of the high-temperature vulcanized silicone rubber sample.
Based on the TGA thermogram, we hypothesized that the spike in spectral line intensity at approximately 260°C was caused by the decomposition of aluminum hydroxide. To verify this, ratios between the intensities of various spectral lines were calculated to eliminate the influence of sample temperature changes, and these ratios were plotted versus sample temperature. In Figure 4D, it can be seen that the spike in intensity of the Si I 390.55 nm spectral line was relatively small, which indicates that this signal was less affected by the decomposition of the aluminum hydroxide in the sample. Therefore, the ratios between the intensities of various Al spectral lines and the Si I 390.55 nm spectral line were calculated and analyzed.
Figure 7 shows the ratios between the intensities of the three Al spectral lines and the Si I 390.55 nm spectral line intensity plotted versus the sample temperature at a laser pulse energy of 35 mJ. As the sample temperature was increased to 260°C, the ratios between the three Al spectral line intensities and the Si I 390.55 nm spectral line intensity slowly increased. This may have been because the ionization potential of Si I 390.55 nm (5.08 eV) is greater than that of Al I 394.40 nm (3.14 eV), Al I 396.15 nm (3.14 eV), and Al I 309.27 nm (4.02 eV). Therefore, relative to the Si I 390.55 nm spectral line intensity, the intensity decreases of the three Al spectral lines, caused by changes in hardness with increasing sample temperature, were relatively small. Thus, the ratios between the intensities of the three Al spectral lines and the Si I 390.55 nm spectral line increased with the sample temperature. A sudden spike was also exhibited at approximately 260°C in the plots of these three ratios versus temperature, which indicates that the aluminum hydroxide decomposition reaction contributed to a certain extent to the increase in Al spectral line intensity.
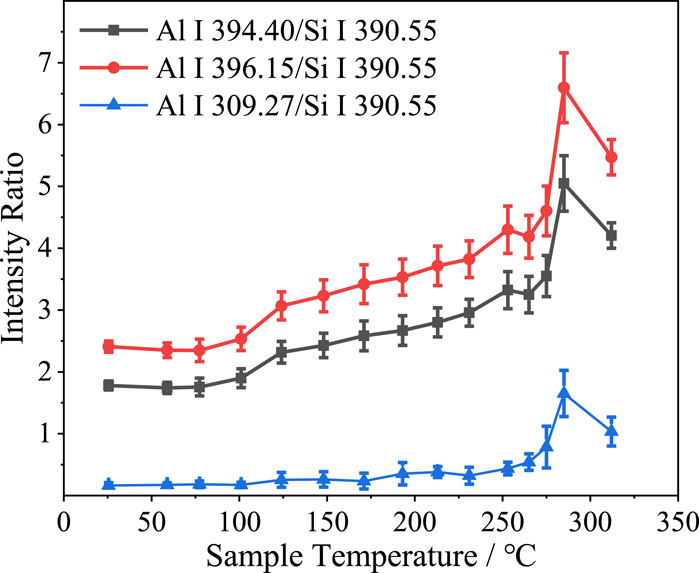
FIGURE 7. Spectral line intensity ratios versus sample temperature at a laser pulse energy of 35 mJ.
Figure 8 shows the variation with sample temperature of the ratios between the intensities of the Al I 309.27 nm, Al I 394.40 nm, and Al I 396.15 nm spectral lines and the Si I 390.55 nm spectral line under different laser pulse energy conditions. At a laser pulse energy of 15 mJ and temperatures above 250°C, the intensity of the Si I 390.55 nm spectral line was zero. Therefore, the intensities of the three Al spectral lines relative to that of the Si I 390.55 nm spectral line are plotted only up to 250°C at this laser pulse energy level. When the temperature was increased to 260°C, the intensities of the three Al lines relative to the Si I 390.55 nm line intensity tended to increase at each laser pulse energy. The spike feature was also observed in these plots at approximately 260°C. As the laser pulse energy increased, the ratios between the intensities of Al I 394.40 nm, Al I 396.15 nm spectral lines and the Si I 390.55 nm spectral line gradually decreased. Conversely, the Al I 309.27 nm to Si I 390.55 nm line intensity ratio increased with the laser pulse intensity. Since the ionization energy of the Al 309.27 nm is higher compared to the Al 394.40 nm and Al 396.15 nm, it has a lower spectral intensity than Si 390.55 nm and changes more when the laser energy is increased, while the Al 394.40 nm and Al 396.15 nm have a much higher intensity than Si 390.55 nm and change less when the laser energy is increased. The degree of variation is smaller when the laser energy is increased.
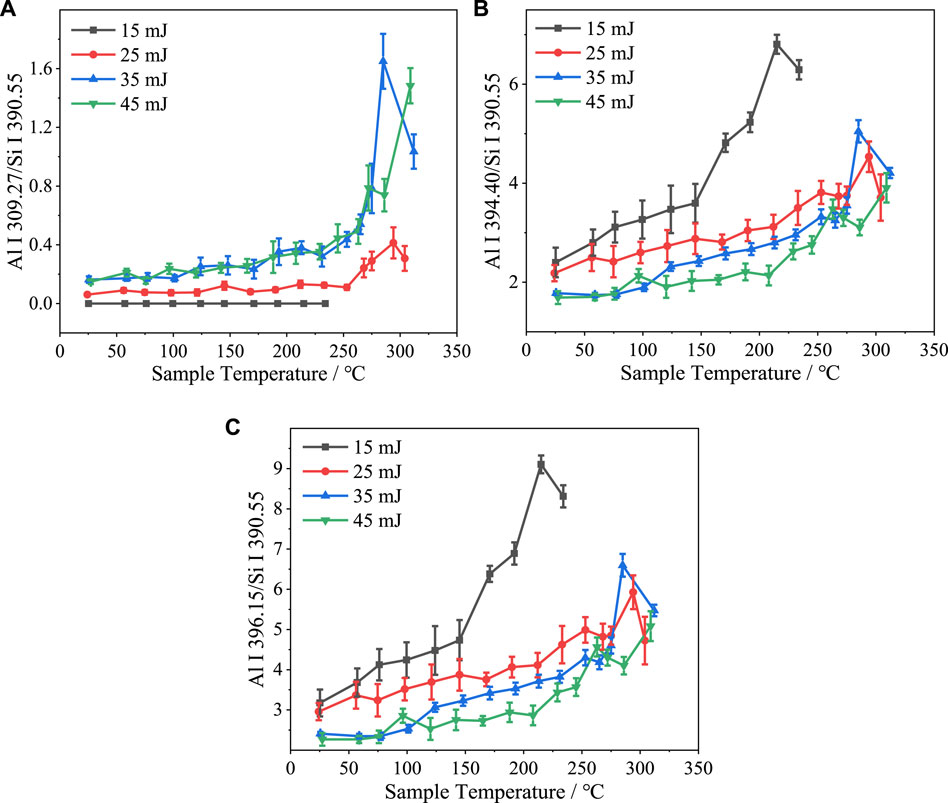
FIGURE 8. Sample temperature dependence under various laser pulse energy conditions of (A) Al I 309.27 nm, (B) Al I 394.40 nm, and (C) Al I 396.15 nm spectral line intensities normalized with respect to the Si I 390.55 nm spectral line intensity.
To further test our hypothesis that the spike in spectral line intensity at approximately 260°C was caused by the aluminum hydroxide decomposition reaction, LIBS was performed at different sample temperatures on pure aluminum hydroxide powder pressed into tablet form. The laser pulse energy was set to 35 mJ, and all other experimental conditions were identical to those described in Section 2.2. Figure 9 shows the resultant spectrum of the aluminum hydroxide sample. It is apparent that there are few highly intense spectral lines. All of the intense spectral lines were assigned to Al; specifically, the same three lines (Al I 309.27 nm, Al I 394.40 nm, and Al I 396.15 nm) mentioned in the analysis detailed above were observed to be intense.
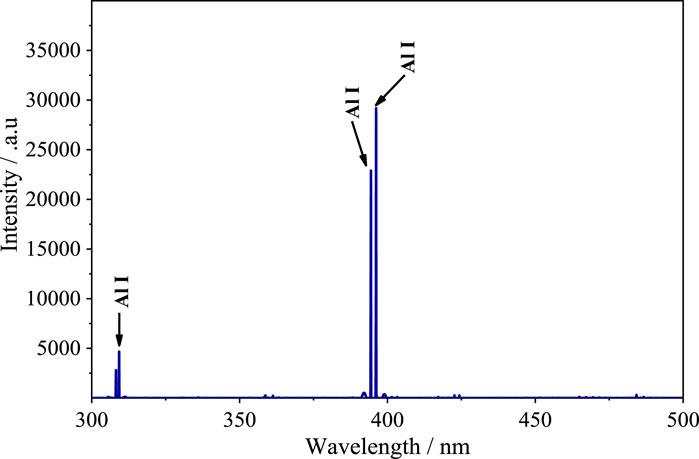
FIGURE 9. Emission spectrum of pure aluminum hydroxide sample in the 300–500 nm range acquired using the LIBS technique.
Figure 10 shows how the intensities of the three Al lines in the spectrum of pure aluminum hydroxide vary with sample temperature at a laser pulse energy of 35 mJ. A gradual decrease was observed for each line as the sample temperature was increased to 250°C. The decrease in intensity was greater for the Al I 394.40 nm and Al I 396.15 nm spectral lines than for the Al I 309.27 nm spectral line. This may be because of the higher ionization energy of Al I 309.27 nm. Again, spikes in spectral line intensity were observed at approximately 260°C, further confirming that the decomposition of aluminum hydroxide resulted in an increase in the Al line intensity, i.e., aluminum hydroxide decomposition was a direct cause of the spectral line intensity spike.
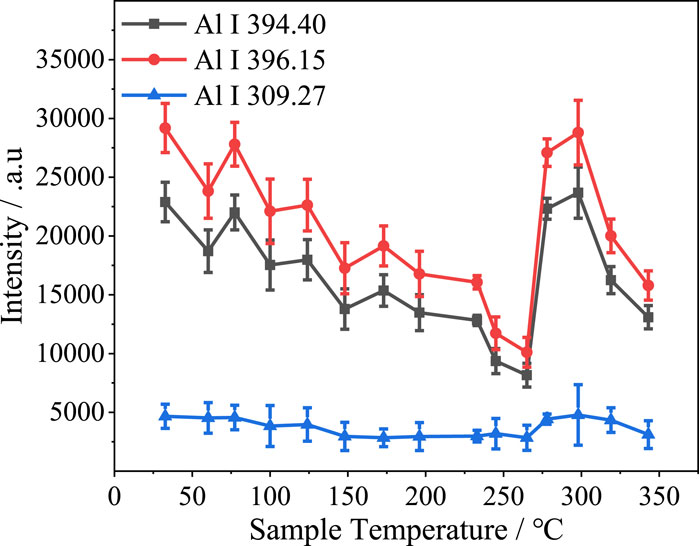
FIGURE 10. Intensities of various lines from the spectrum of pure aluminum hydroxide versus sample temperature at a laser energy of 35 mJ.
The results described above verify that the decomposition of aluminum hydroxide affected the plasma spectra, but they do not indicate whether the decomposition process itself or the aluminum oxide produced by the decomposition produced the change in the plasma spectra and altered the spectral intensities. Although the intensity of the Al I 394.40 nm and Al I 396.15 nm lines were further decreased when the sample temperature exceeded 300°C, demonstrating that the spectral line intensity spike was unlikely to have been produced by the aluminum oxide generated by aluminum hydroxide decomposition, the overall trend for the spectral line intensity was one of decreasing with increasing sample temperature. Therefore, whether the subsequent decrease in spectral line intensity was caused by the completion of the decomposition reaction or by the rise in sample temperature remains to be ascertained.
To investigate the cause of the spectral intensity spike, an aluminum hydroxide sample was first heated to approximately 260°C and subjected to LIBS. The sample was then allowed to cool naturally to room temperature and subsequently subjected to LIBS again for further analysis. Figure 11 shows the spectra in the region of the Al I 394.40 nm and Al I 396.15 nm lines before and after cooling. The Al I 394.40 nm and Al I 396.15 nm line intensities were slightly lower after the aluminum hydroxide sample had been cooled to room temperature compared to the corresponding intensities when the sample was still at approximately 260°C. This result allows us to rule out the possibility that the spectral intensity spike was caused by the aluminum oxide decomposition product. Therefore, it is evident that the aluminum hydroxide decomposition process affected the plasma spectra.
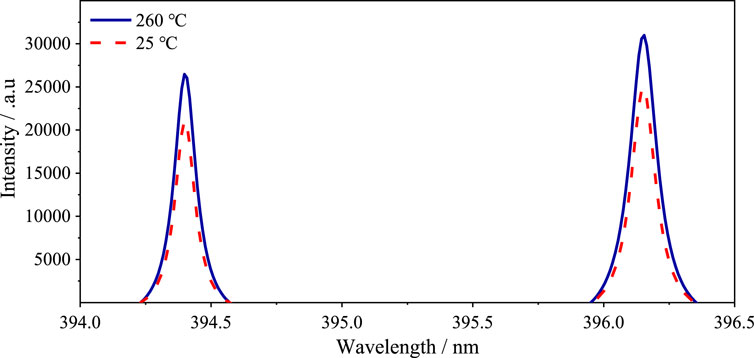
FIGURE 11. Spectral peaks of Al I 394.40 nm and Al I 396.15 nm before and after cooling.
The analysis of plasma parameters is an important means of achieving detailed understanding of the plasma mechanism on the micro- and nano-scale. In particular, plasma temperature and electron density are two important parameters of laser-induced plasmas that are often used to perform characterization of the degree of aging of silicone rubber. To understand the effect of sample temperature on the accuracy of LIBS analysis of silicone rubber, the variation of plasma temperature and electron density was investigated for different sample temperatures. The temperature of a high electron density plasma under atmosphere pressure can in general be calculated using the Boltzmann plane method, with the assumption that the plasma is in local thermodynamic equilibrium (LTE).
In the Boltzmann plane method, multiple spectral lines corresponding to the same element and excited state can be used to calculated the plasma temperature, based on the following expression [23]:
where
Three Al atomic lines were selected for the calculation of the plasma temperature. Table 1 shows the atomic spectral data for the three spectral lines obtained from the National Institute of Standards and Technology (NIST) database [24].
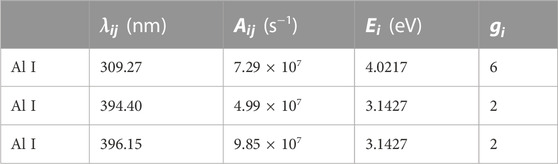
TABLE 1. Al atomic spectral data used to calculate plasma temperature.
Figure 12 shows a Boltzmann plot at a laser pulse energy of 35 mJ and sample temperature of 210°C. Plasma temperature was derived from the slope of the fitted line.
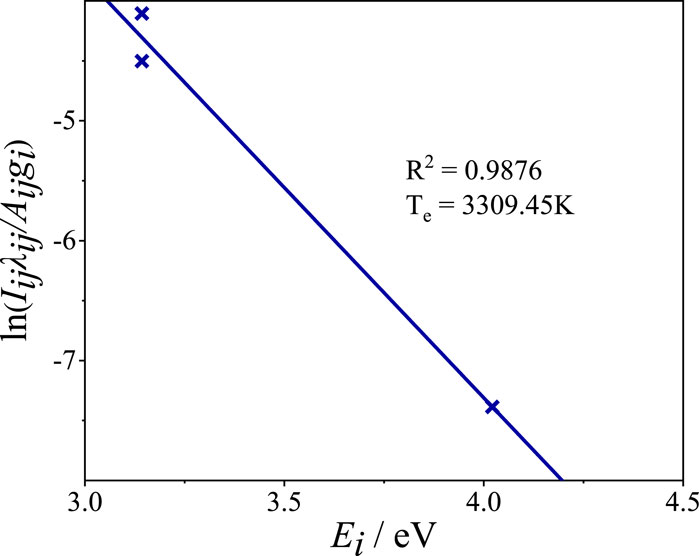
FIGURE 12. Boltzmann plot of silicone rubber sample constructed based on data acquired at a laser pulse energy of 35 mJ and sample temperature of 210°C.
The electron density can be calculated using the Stark broadening formula:
where
Given the fact that plasma temperature was calculated based on the LTE assumption, it was necessary to determine whether the plasma was close to being at LTE. Such a calculation is usually performed using the McWhirter criterion [26]:
where
At a laser pulse energy of 35 mJ and sample temperature of 210°C, the lower limit for the electron density at 3309 K, according to Eq. 3, was approximately 2.94 × 1015 cm−3. However, the actual electron density calculated using Eq. 2 was approximately 1.05 × 1016 cm−3, which was far greater than the calculated lower limit. This indicates that the plasma was at LTE in the present experiment.
Figure 13 shows the plasma temperature and electron density plotted versus sample temperature under various laser pulse energy conditions. It was not possible to be sure of the accuracy of the calculated plasma temperature and electron density at a laser energy of 15 mJ because of the limited number of spectral lines that were obtained. Therefore, only the data for laser energies of 25, 35, and 45 mJ are shown in Figure 13. It can be observed that plasma temperature increased with the laser pulse energy, but the plasma temperatures at 35 and 45 mJ were essentially identical. This is consistent with the spectral line intensity results presented in Section 3.1. However, there was no obvious correlation between electron density and laser energy. Both the plasma temperature and electron density versus sample temperature plots include sharp increases at approximately 260°C, consistent with the spectral line intensity results presented in Section 3.1. And the plasma temperature and electron density peak at around 300°C, which is the same as the case of Al spectral line intensity in Figure 10.
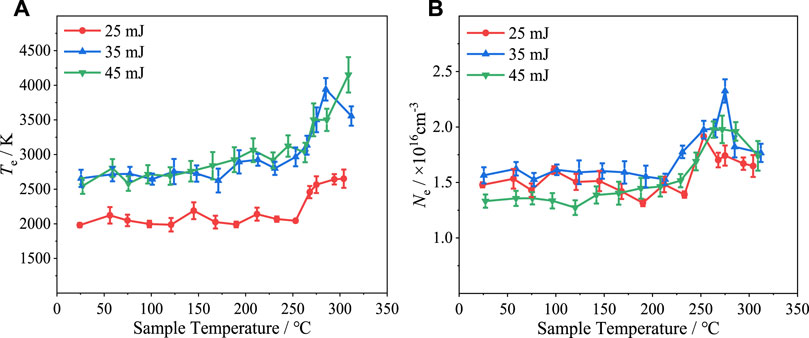
FIGURE 13. (A) Plasma temperature and (B) electron density versus temperature under various laser pulse energy conditions.
To understand the effects of temperature on the emission spectrum of silicone rubber, we performed LIBS on silicone rubber samples at high temperatures and investigated the trends in the spectral line intensities as a function of sample temperature. Precise control of the sample temperature was achieved through the use of a high-precision digital display heating platform. Our conclusions are as follows:
(1) As the sample temperature was increased from 25°C to 310°C, the intensities of the Al I 394.40 nm and Al I 396.15 nm spectral lines gradually decreased, while the intensity of the Al I 309.27 spectral line remained essentially stable.
(2) At approximately 260°C, the Al and Si spectral line intensities, plasma temperature, and electron density underwent a sudden increase, followed by a decrease. The magnitude of this intensity spike was also dependent on the laser pulse energy, with more significant increases occurring when the laser pulse energy was higher.
(3) The spike in the spectral line intensity at approximately 260°C was related to the decomposition of aluminum hydroxide, which generated an increase in the Al line intensities.
The raw data supporting the conclusion of this article will be made available by the authors, without undue reservation.
ZA: Conceptualization, Project administration, Resources, Writing–original draft, Software. YH: Data curation, Writing–review & editing. QC: Formal analysis, Funding acquisition. GD: Investigation, Methodology. XW: Supervision.
This work was supported by National Natural Science Foundation of China “Quantitative online inspection method for composite materials based on laser-induced breakdown spectroscopy” (51607101) and in part by the Cross Research Fund of Shenzhen International Graduate School, Tsinghua University, under Grant JC2021005.
ZA and GD were employed by Guangzhou Power Supply Bureau of Guangdong Power Grid Co., Ltd. YH was employed by the State Grid Tianjin Electric Power Company Chengnan Power Supply Branch, State Grid Tianjin Electric Power Company.
The remaining authors declare that the research was conducted in the absence of any commercial or financial relationships that could be construed as a potential conflict of interest.
All claims expressed in this article are solely those of the authors and do not necessarily represent those of their affiliated organizations, or those of the publisher, the editors and the reviewers. Any product that may be evaluated in this article, or claim that may be made by its manufacturer, is not guaranteed or endorsed by the publisher.
1. Liu Y, Zhou B, Wang W, Shen J, Kou W, Li Z, et al. Insertable, scabbarded, and nanoetched silver needle sensor for hazardous element depth profiling by laser-induced breakdown spectroscopy. ACRSens (2022) 7(5):1381–9. doi:10.1021/acssensors.2c00017
2. Li M, Fu H, Du Y, Huang X, Zhang T, Tang H, et al. Laser induced breakdown spectroscopy combined with hybrid variable selection for the prediction of the environmental risk Nemerow index of heavy metals in oily sludge. J Anal Spectrom (2022) 37(5):1099–108. doi:10.1039/d2ja00048b
3. Zeng Q, Guo L, Li X, Shen M, Xhu Y, Li J, et al. Quantitative analyses of Mn, V, and Si elements in steels using a portable laser-induced breakdown spectroscopy system based on a fiber laser. J Anal Spectrom (2016) 31(3):767–72. doi:10.1039/c5ja00453e
4. Lanza NL, Wiens RC, Clegg SM, Ollila AM, Humphries SD, Newsom HE, et al. Calibrating the ChemCam laser-induced breakdown spectroscopy instrument for carbonate minerals on Mars. Appl Opt (2010) 49(13):C211–C217. doi:10.1364/ao.49.00c211
5. Wiens RC, Maurice S, Lasue J, Forni O, Anderson RB, Clegg S, et al. Pre-flight calibration and initial data processing for the ChemCam laser-induced breakdown spectroscopy instrument on the Mars Science Laboratory rover. Spectrochim Acta B Spectrosc (2013) 82:1–27. doi:10.1016/j.sab.2013.02.003
6. Vítková G, Novotný K, Prokeš L, Hrdlička A, Kaiser J, Novotný J, et al. Fast identification of biominerals by means of stand-off laser-induced breakdown spectroscopy using linear discriminant analysis and artificial neural networks. Spectrochim Acta Part B Spectrosc (2012) 73:1–6. doi:10.1016/j.sab.2012.05.010
7. Oujja M, Agua F, Sanz M, Morales-Martin D, García-Heras M, Villegas MA, et al. Multiphoton excitation fluorescence microscopy and spectroscopic multianalytical approach for characterization of historical glass grisailles. Talanta (2021) 230:122314. doi:10.1016/j.talanta.2021.122314
8. Wallis FJ, Chadwick BL, Morrison RJS. Analysis of lignite using laser-induced breakdown spectroscopy. Appl Spectrosc (2000) 54(8):1231–5. doi:10.1366/0003702001950814
9. Rakovský J, Musset O, Buoncristiani JF, Bichet V, Monna F, Neige P, et al. Testing a portable laser-induced breakdown spectroscopy system on geological samples. Spectrochim Acta Part B Spectrosc (2012) 74:57–65. doi:10.1016/j.sab.2012.07.018
10. Wang X, Wang H, Chen C, Jia Z. Ablation properties and elemental analysis of silicone rubber using laser-induced breakdown spectroscopy. IEEE Trans Plasma Sci IEEE Nucl Plasma Sci Soc (2016) 44(11):2766–71. doi:10.1109/tps.2016.2586185
11. Wang X, Hong X, Chen P, Zhao C, Jia Z, Wang L. In-situ and quantitative analysis of aged silicone rubber materials with laser-induced breakdown spectroscopy. High Voltage (2018) 3(2):140–6. doi:10.1049/hve.2017.0130
12. Wang X, Hong X, Chen P, Zhao C, Jia Z, Wang L, et al. Surface hardness analysis of aged composite insulators via laser-induced plasma spectra characterization. IEEE Trans Plasma Sci IEEE Nucl Plasma Sci Soc (2019) 47(1):387–94. doi:10.1109/tps.2018.2870302
13. Tavassoli SH, Gragossian A. Effect of sample temperature on laser-induced breakdown spectroscopy. Opt Laser Technol (2009) 41(4):481–5. doi:10.1016/j.optlastec.2008.07.010
14. Sanginés R, Sobral H, Alvarez-Zauco E. Emission enhancement in laser-produced plasmas on preheated targets. Appl Phys B (2012) 108:867–73. doi:10.1007/s00340-012-5130-6
15. Sanginés R, Sobral H, Alvarez-Zauco E. The effect of sample temperature on the emission line intensification mechanisms in orthogonal double-pulse Laser Induced Breakdown Spectroscopy. Spectrochim Acta Part B Spectrosc (2012) 68:40–5. doi:10.1016/j.sab.2012.01.011
16. Eschlböck-Fuchs S, Haslinger MJ, Hinterreiter A, Kolmhofer P, Huber N, Rössler R, et al. Influence of sample temperature on the expansion dynamics and the optical emission of laser-induced plasma. Spectrochim Acta Part B Spectrosc (2013) 87:36–42. doi:10.1016/j.sab.2013.05.023
17. Darbani SMR, Ghezelbash M, Majd AE, Soltanolkotabi M, Saghafifar H. Temperature effect on the optical emission intensity in laser induced breakdown spectroscopy of super alloys. J Eur Opt Soc Rapid Publ (2014) 9:14058. doi:10.2971/jeos.2014.14058
18. Hanson C, Phongikaroon S, Scott JR. Temperature effect on laser-induced breakdown spectroscopy spectra of molten and solid salts. Spectrochim Acta Part B Spectrosc (2014) 97:79–85. doi:10.1016/j.sab.2014.04.012
19. Liu Y, Tong Y, Li S, Wang Y, Chen A, Jin M. Effect of sample temperature on laser-induced semiconductor plasma spectroscopy. Chin Opt Lett (2016) 14:123001–5. doi:10.3788/col201614.123001
20. Liu Y, Tong Y, Wang Y, Zhang D, Li S, Jiang Y, et al. Influence of sample temperature on the expansion dynamics of laser-induced germanium plasma. Plasma Sci Technol (2017) 19:125501. doi:10.1088/2058-6272/aa8acc
21. Wang Y, Chen A, Jiang Y, Sui L, Wang X, Zhang D, et al. Temperature effect on femtosecond laser-induced breakdown spectroscopy of glass sample. Phys Plasmas (2017) 24:013301. doi:10.1063/1.4973658
22. Lednev VN, Grishin MY, Sdvizhenskii PA, Asyutin RD, Tretyakov RS, Stavertiy AY, et al. Sample temperature effect on laser ablation and analytical capabilities of laser induced breakdown spectroscopy. J Anal Spectrom (2019) 34(3):607–15. doi:10.1039/c8ja00348c
23. Yahiaoui K, Messaoud Aberkane S, Naitbouda A. Correlation between surface hardness of α-alumina samples and their spectroscopic parameters. Mater Chem Phys (2021) 259:124045. doi:10.1016/j.matchemphys.2020.124045
25. Konjević N, Lesage A, Fuhr JR, Wiese WL. Experimental Stark widths and shifts for spectral lines of neutral and ionized atoms. J Phys Chem Ref Data (1990) 19(6):1307–85. doi:10.1063/1.555847
Keywords: temperature, high-temperature vulcanized silicone rubber, laser-induced breakdown spectroscopy, aluminum hydroxide, plasma temperature
Citation: An Z, He Y, Chen Q, Du G and Wang X (2023) Effect of sample temperature on laser-induced plasma of silicone rubber. Front. Phys. 11:1219465. doi: 10.3389/fphy.2023.1219465
Received: 09 May 2023; Accepted: 23 August 2023;
Published: 25 September 2023.
Edited by:
Venugopal Rao Soma, University of Hyderabad, IndiaReviewed by:
Virendra Rai, Raja Ramanna Centre for Advanced Technology, IndiaCopyright © 2023 An, He, Chen, Du and Wang. This is an open-access article distributed under the terms of the Creative Commons Attribution License (CC BY). The use, distribution or reproduction in other forums is permitted, provided the original author(s) and the copyright owner(s) are credited and that the original publication in this journal is cited, in accordance with accepted academic practice. No use, distribution or reproduction is permitted which does not comply with these terms.
*Correspondence: Qijuan Chen, cWpjaGVuQHdodS5lZHUuY24=
Disclaimer: All claims expressed in this article are solely those of the authors and do not necessarily represent those of their affiliated organizations, or those of the publisher, the editors and the reviewers. Any product that may be evaluated in this article or claim that may be made by its manufacturer is not guaranteed or endorsed by the publisher.
Research integrity at Frontiers
Learn more about the work of our research integrity team to safeguard the quality of each article we publish.