 Yiyang Shen
 Jin Bu2†
 Xiaoyan Feng
 Jun Lin
 Peng Li
95% of researchers rate our articles as excellent or good
Learn more about the work of our research integrity team to safeguard the quality of each article we publish.
Find out more
ORIGINAL RESEARCH article
Front. Phys. , 23 August 2023
Sec. Optics and Photonics
Volume 11 - 2023 | https://doi.org/10.3389/fphy.2023.1218179
This article is part of the Research Topic Advances in Bio-Optical Imaging View all 7 articles
Purpose: This study aims to evaluate the capability of optical coherence tomography angiography (OCTA) for imaging the microvasculature within a critical bone defect, to longitudinally observe vascular alterations, and quantify the microvascular density and morphology in a model of a critical-sized defect.
Methods: An OCTA system was used to longitudinally monitor angiogenesis in four rat models presenting critical-sized defects with observations recorded on days 7, 14, and 28 post-defect creation. Simultaneously, angiogenesis in three additional rat models was evaluated through a conventional histological analysis involving hematoxylin and eosin staining.
Results: OCTA was successful in acquiring in vivo 3D vascular perfusion mapping within the critical-sized defect, and it allowed for quantitative analysis of the microvasculature’s density and morphology. The OCTA imagery of the blood microvasculature revealed a noticeable augmentation in the number and size of vessels, with more extensive vessel convergence observed on day 14 compared to both days 7 and 28. Complementing these observations, quantitative analysis demonstrated that the vessel area density (VAD) and maximum vascular diameter index (MVDI) were significantly larger on day 14 in comparison to measurements taken on days 7 and 28.
Conclusion: Leveraging its ability to capture high-resolution images, OCTA facilitated longitudinal monitoring of angiogenesis in models of critical-sized defects. Therefore, it potentially serves as a non-invasive experimental tool beneficial for bone regeneration research.
On a global scale, countless individuals grapple with alveolar bone deficiencies due to trauma, periodontal disease, and oral tumors [1, 2].The restoration of alveolar bone defects holds immense clinical significance [3, 4]. The bone, a highly vascularized tissue, demonstrates an exceptional ability for incessant healing and remodeling [5, 6]. Angiogenesis, which refers to the emergence of new microvessels from pre-existing capillary networks, is commonly recognized as a critical factor in osteogenesis, particularly when considering successful bone restoration [7, 8]. An ample early-stage blood supply often heralds a favorable prognosis for bone restoration [7, 9, 10]. Therefore, acquiring real-time data on the formation of blood vessels in a deficient bone milieu is paramount.
The critical-sized defect model is widely utilized to gauge the efficacy of alveolar bone regeneration, following various surgical interventions; it is defined as the smallest defect size that precludes self-restoration [11, 12]. However, in this framework, angiogenesis—the essential precursor to osteogenesis in critical-sized defects—proves challenging to assess [13]. Micro-CT and H&E staining are typically employed to evaluate the vascularity of the defect area [7, 11]. However, micro-CT necessitates invasive equipment, highly skilled personnel, and toxic contrast agents. In contrast, histological analysis requires animal sacrifice and is a time-intensive method due to the need for serial sectioning.
Optical coherence tomography angiography (OCTA) is an evolving optical imaging technique that facilitates the in vivo visualization of functional blood vessels by detecting OCT signal changes triggered by moving particles (such as red blood cells) [14–16]. With its non-invasive characteristics and high-resolution capabilities [17, 18], OCTA has swiftly found applications in scientific research and various clinical fields, including ophthalmology [19–21], dermatology [22, 23], and stomatology [24–27]. Recently, OCTA’s potential has been harnessed to visualize cerebral microcirculation in animal models [14, 28, 29]. For instance, Li et al. deployed OCTA to longitudinally image cortical blood perfusion and tissue destruction in PT stroke models [30]. Recent investigations have evidenced OCTA’s capacity to longitudinally monitor blood perfusion dynamics in the cerebral cortex of conscious mice, following ischemia [13]. In a chronic rat photothrombotic stroke model, Yang et al. effectively developed a chronic optical window and produced OCTA images to monitor blood supply [31]. However, to the best of our knowledge, no existing studies have documented the use of angiogenic OCTA imaging for regenerating skull bones.
In this study, we first performed a longitudinal examination of angiogenesis during bone healing in a critical-sized calvarial defect rat model by OCTA. Additionally, we quantified the angiogenic condition of the skull bone in terms of both density and morphology. The formulation of this method could provide a non-invasive experimental tool for the visualization and quantitative screening of angiogenesis in bone regeneration, especially in the early stages. Furthermore, it may also assist in investigating angiogenesis and osteogenesis mechanisms in critical-sized defect models.
The imaging system used in this study is rooted in a swept-source OCT configuration, featuring a line scan rate of 100 kHz. The swept source (SL131090, Thorlabs, Inc.) operated at a central wavelength of 1,300 nm with a spectral bandwidth of 100 nm, thereby delivering a measured axial resolution of 16 µm in air. As shown in Figure 1, the light source was bifurcated into two beams via Coupler1, subsequently traversing the sample and reference arms separately, which converged and interfered in Coupler2. Ultimately, a balanced detector was utilized to register interference signals and mitigate common-mode noise. Within the sample arm, an x–y galvanometer was incorporated for 3D volume scanning, and a telecentric scan lens (f = 36 mm) was used to concentrate the probing light beam onto the area of interest. This configuration achieved a lateral resolution of approximately 23.4 µm and a depth of focus of approximately 108 µm.
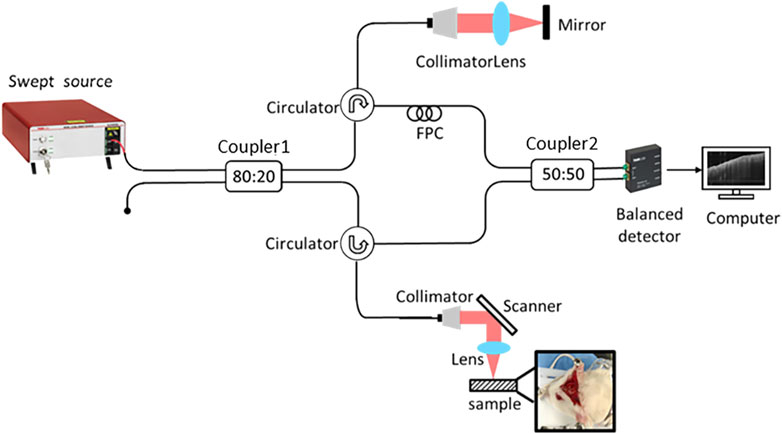
FIGURE 1. Schematic representation of the system setup.
For volumetric imaging, a stepwise raster scanning protocol (z-x-y) was implemented, consisting of 2,048 pixels in each A-scan, 350 A-lines per B-scan (fast-scan, x direction), and 1,750 B-scans per volume (slow-scan, y direction). At 350 tomographic positions, five successive B-frames were obtained to compute dynamic flow signals and reduce the decorrelation noise in blood flow imaging. Each volume dataset required an acquisition time of 13.4 s and spanned a 7*7 mm2 spatial region in the x–y plane.
We procured male Sprague–Dawley rats, aged 7 weeks and weighing between 160 and 200 g, from Hangzhou Medical College (certificate no. SCXK2019-0002). All rats were accommodated in individually ventilated cages within an experimental animal room (22°C, 55% humidity, and 12/12-h light/dark cycle) and were provided with a standard laboratory diet and water. The Animal Experimentation Committee of The First Affiliated Hospital of Zhejiang University Medical College approved this study (no. 2022-1,125). After taking the measurements, the rats were humanely euthanized via excess anesthesia, effectively minimizing their discomfort.
Following the establishment of general anesthesia with chloral hydrate (5%, 8 mL/kg), the surgical area was shaved and the skin was cleansed with 70% ethanol. The dorsal region of the cranium was shaven and prepared aseptically for the surgical procedure. Skull bone exposure was achieved through a midline incision and spreading of the skin, fascial, and periosteal layers overlaying the calvarium’s sagittal suture [32]. In rats, 5-mm calvarial defects are classified as critical-sized bone defects [33]. Initially, a 5-mm circular bone defect was created on the calvarial bone using a dental surgical drilling unit, consistently cooled with sterile saline. Subsequently, the calvarial bone was gently elevated to prevent dura tears. Concurrently, the midsagittal suture was circumvented to eliminate its contribution to bone restoration and minimize the risk of superior sagittal sinus damage 11. After thoroughly cleaning the area with physiological saline to remove all bone debris, the periosteal layer was meticulously sutured with 4-0 silk sutures (Ethicon, Somerville, NJ, United States) and the skin was closed using 3-0 silk sutures (Ethicon, Somerville, NJ, United States). The surgery day was designated as day 0.
On days 7,14, and 28, rats were individually restrained in the stereotaxic instrument under chloral hydrate (5%, 8 mL/kg) anesthesia. The calvarial bone was exposed by reopening the midline incision and spreading the skin, fascia, and periosteal layers covering the sagittal line of the skull. Subsequently, the established OCT system was utilized to capture microvessel images at different time stages.
Upon acquiring the raw spectral interferogram data S (k, x, y, t), a series of preprocessing steps and motion contrast OCTA were implemented to extract dynamic blood signals from the critical-sized calvarial defect rat model. Here, k denotes the wave number, x signifies the fast scan direction, y represents the slow scan direction, and t stands for the temporal index of adjacent B-scans at the same location. In detail, by executing a Fourier transformation of the k-direction, we can obtain the depth-resolved complex signal A (z, x, y, t) and generate a structural cross-sectional image via the amplitude component of A. By applying cross-correlation registration between adjacent B-frames, we compensate for minor skull displacement due to respiration [34]. Subsequently, we calculate the inter-frame complex decorrelation using a local kernel to achieve the OCTA motion contrast. Additionally, by merging the features of the inverse signal-to-noise ratio (SNR) and decorrelation (ID), we apply a vascular morphological mask with the adaptive signal-to-noise ratio to decorrelation mapping, thereby procuring angiography (ID-OCTA) [18].
To scrutinize the microvascular circulation during the longitudinal growth of the critical skull defect, the acquired angiography was bifurcated into two layers: the surface layer (from the surface to a depth of 483 µm) and the deep layer (from a depth of 483–967 μm). For the surface layer, after employing Gaussian filters to minimize noise, angiography was binarized with a global threshold. Subsequently, the parameters of the vessel area density (VAD) and maximum vascular diameter index (MVDI) of the projection view image were calculated to quantify the vascular structure alterations.
In this equation, A(x,y) symbolizes the white vessel pixels in the binary image,
Defect sites, along with surrounding bone and soft tissue, were dissected and preserved in 4% PFA. The specimens were then decalcified through immersion in an EDTA solution for 2 weeks and embedded in paraffin. Transverse sections were created through the center of the calvarial defect and subjected to hematoxylin and eosin (H&E) staining. Histological examination was conducted under a microscope, complemented using a morphometric system connected to a personal computer. Measurements of five random 1-mm2 fields from 10 slices in each group were used to calculate the microvessel density, with each count performed three times by the same individual, and the mean value was determined.
Statistical analyses were carried out using SPSS 26 software (IBM Corp., Armonk, NY, USA). All variables were measurement data and presented as mean ± standard deviation. The Kolmogorov–Smirnov test was utilized to examine whether the data were normally distributed. For the variables of vessels with a normal distribution, the repeated measures ANOVA was performed, while the Friedman test was conducted for variables with a non-normal distribution. The bilateral test level was established at α = 0.05, and p-values less than 0.05 were deemed statistically significant.
Histological assessment of the specimens, conducted using H&E staining, revealed that, on day 7, nascent vessels had emerged from the periphery of the skull defect, accompanied by a small amount of connective tissue (Figures 2A, D) By day 14, the bone had begun to form in the defects, extending from the external bone surface toward the central region of the defect, coupled with a noticeable increase in the number of blood vessels (Figures 2B, E, G). At the 28-day mark, a heightened degree of irregular ossification was observed, with a thicker layer of connective tissue encompassing the critical-sized defects, particularly at the margins (Figures 2C, F). The microvessel density on day 28 showed a marked increase compared to day 7 (Figure 2G). However, there was no significant difference in the number of blood vessels on day 28 compared to day 14 (Figure 2G).
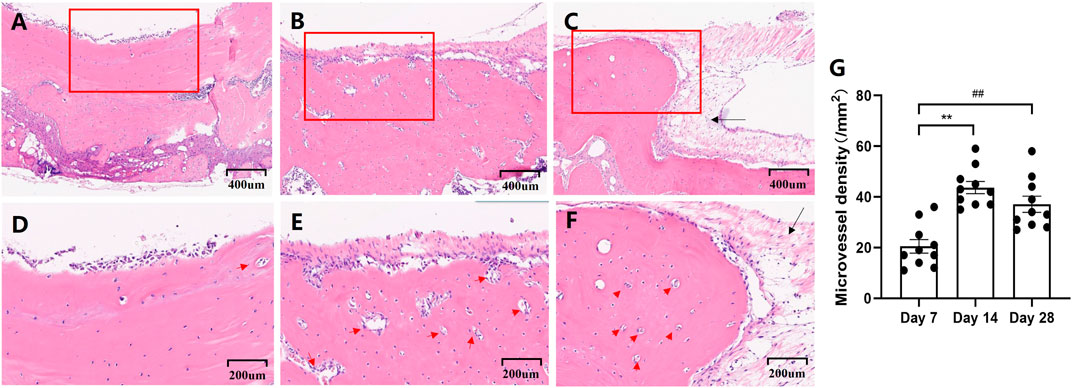
FIGURE 2. Representative photographs that demonstrate the histological appearance of the calvarial defect with H&E staining on days 7 (A,D), 14 (B,E), and 28(C,F). Scale bars for Figures (A–C) are set at 400 μm. Figures (D–F) provide a high magnification view of the framed area of the preceding Figures (A–C), with scale bars set at 200 μm. Newborn vessels are denoted by a red arrow, and the connective tissue is indicated by a black arrow. Microvessel density calculated from measurements of 1-mm2 fields (Figure (G)).
Initially, Figure 3A presents the schematic diagram of the areas imaged. As shown in the structure cross section in Figure 3B, which aligns with the green dotted line cross section in 3D OCTA (Figure 3E), the region between the yellow dotted lines marks the area of the critical-sized defect model. Due to the removal of the skull from the defect area in this model, the OCT probe light within the defect area was not attenuated by fibrous bone, thereby making deeper-layer structural information observable. An OCTA cross section was subsequently generated by analyzing the temporal dynamics of OCT scattering signals, resulting in the visualization of the enriched blood vessels in the deep layer. Figures 3C, D showcase the projection view of the surface and deep layers in the depth direction, representing, respectively, the surface (from the surface to a depth of 483 μm) and deep (from 483 μm to a depth of 967 μm) layers. As is evident, the vessel network in the surface tissue primarily consists of capillaries and neovascularization, while the vessel network at the deeper level comprises diving arterioles and ascending venules. A 3D perfusion map (Figure 3E) was further accomplished by stacking a series of sequential cross-sectional angiograms. Figure 3F shows the projection view of the 3D perfusion map in the depth direction, where the surface layer is represented by the pale yellow channel and the deep layer by the red-orange channel. Therefore, given its micron-scale vessel resolution and depth information, OCTA imaging merges as a robust technical method for monitoring 3D dynamic changes in the vascular structure within the critical-sized calvarial defect.
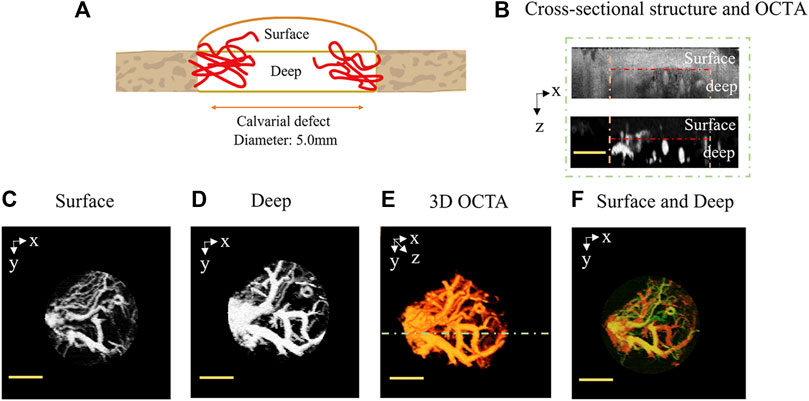
FIGURE 3. Motion-contrast OCTA-enabled in vivo 3D perfusion mapping in the critical-sized calvarial defect. (A) Schematic diagram of the imaged areas. (B) Cross-sectional structure and OCTA, with the cross-sectional angiogram corresponding to the green dotted line cross-section in 3D OCTA (E). The region between the yellow dotted lines delineates the area of the critical-sized defect. The surface and deep layers are, respectively, located on either side of the red dotted line. (C) Surface layer (from surface to a depth of 483 μm) and (D) deep layer (from 483 μm to a depth of 967 μm), which are projections of a sequence of cross-sectional OCTA in the depth direction. (E) OCTA 3D perfusion map generated by stacking a series of cross-sectional angiograms. (F) Projection view of the 3D perfusion map in the depth direction (surface: pale yellow channel and deep: red orange channel). The scale bar is set at 2 mm.
We monitored the process of angiogenesis in areas exhibiting critical-sized defects on days 7, 14, and 28 post-surgery, utilizing OCTA scanning (Figure 4). On day 7, diminutive blood vessels radiated from the lateral boundaries of the circular defect; however, the capillaries on one side barely connected with those on the opposite side (Figure 4A). By day 14, a conspicuous increase was observed in both the number and size of vessels, which demonstrated extensive convergence within the circular skull defect (Figure 4B). Conversely, the vascular images on day 28 did not reflect a continuous growth in the number and dimensions of vessels (Figure 4C).
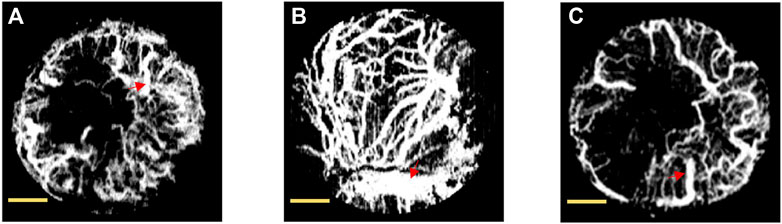
FIGURE 4. Projection view of blood microvasculature by OCTA in rat’s calvarial defect on days 7 (A), 14 (B), and 28 (C). The maximum vessel identified was outlined with a red arrow. The scale bar is set at 1 mm.
Additionally, vascular changes were quantified objectively by OCTA in critical-sized models at distinct time stages. Microvascular density was assessed using the VAD metric, while vessel morphology was quantified using the MVDI (Figure 5). The calculated blood vessel density significantly increased to 0.509 on day 14 from 0.368 on day 7. However, the blood vessel density in the OCTA image significantly decreased to 0.374 on day 28 from that on day 14. Likewise, the indicators of the vessel diameter showed a significant increase to 771.50 µm on day 14 from 284.55 µm on day 7. The vessel diameter on day 28 (313.20 µm) significantly decreased compared to day 14.
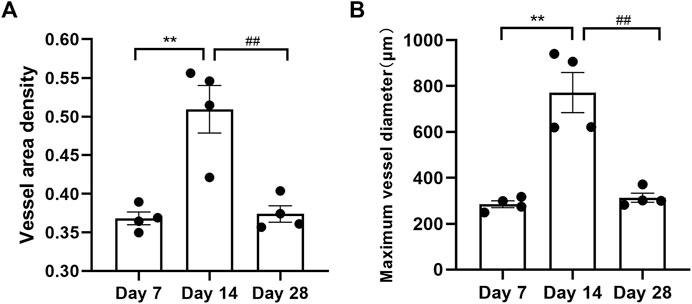
FIGURE 5. Calculated blood vessel density (A) and maximum vessel diameter (B) from the OCTA images on days 7, 14, and 28. “**” represents day 7 versus day 14 with p < 0.01, and '##' denotes day 14 versus day 28 with p < 0.01.
The present study highlights that three-dimensional imaging of angiogenesis in critical-sized bone lesions is feasible using OCTA methodologies. Additionally, the density and morphology of the microvasculature in rat calvarial bone defects were quantified in vivo using OCTA. The detailed and accurate information obtained from OCTA imaging offers a superior perspective in comparison to traditional histological analyses.
The conventional understanding dictates that a 5-mm calvarial bone defect can be classified as a critical-sized defect, suggesting that it represents the smallest defect size that may not spontaneously close without supplemental surgical intervention [12, 35]. The critical-sized defect model is a commonly utilized framework in autologous bone grafting and tissue engineering research studies [5, 12]. This model has the unique advantage of studying healing processes in orthotopic bone sites, making the results more physiologically relevant than those derived from ectopic bone production [4, 36, 37]. It is crucial to note that the microvascular network nourishes surrounding tissues with essential nutrients and oxygen, playing an indispensable role in bone tissue repair [38]. Clinically, bone regeneration in large defects can only occur gradually, emanating from highly vascularized tissue [39]. Existing methodologies in bone tissue engineering are often hampered by delayed angiogenesis in the central area of the experimental scaffold, thereby contributing to the failure of defect healing [39, 40].
Historical experimental techniques for monitoring angiogenesis, such as microscopic analysis of histological sections or micro-CT angiography following perfusion, could only offer limited information [41, 42]. Moreover, these traditional methodologies were not viable for use in living animals and were only applicable post-euthanasia, thereby complicating both animal experimentation and clinical applications. OCTA, an emergent optical imaging technique rooted in OCT, facilitates dynamic vessel visualization with non-invasive attributes and micron-level resolution [43, 44]. Consequently, to illustrate its utility in determining the early prognosis of bone defects, we performed OCTA to capture the healing trajectory of significant bone defects and quantify the acquired vascular information. In the pursuit of more precise and dependable outcomes, we have implemented a series of methodological enhancements in this study. Initially, the central wavelength of 1,300 nm was used to augment the penetration depth. The skull bone is highly scattering biological tissue, and the scattering of light in the 1,300-nm band is relatively weak. Selecting a light source with this wavelength can reduce the scattering of light by biological tissue and help obtain reliable OCTA images. Subsequently, the technique of swept-source was adopted in our study. Compared with conventional OCTA technology, its signal-to-noise ratio can be substantially improved. Additionally, a step-by-step raster scanning protocol is also used to enhance the image quality of OCTA.
In this research, OCTA was used to procure microvascular data on critical-sized defects on days 7, 14, and 28. Neovascularization was observed to commence from the margin of the defect area on day 7, subsequently growing denser and more numerous on day 14 with extensive interweaving. These OCTA-derived findings corroborated our histological analyses and prior research insights [11]. Unexpectedly, a general decrease in vessel quantity and diameter in the skull defect location was recorded on day 28. The current literature posits that fibrous and early angiogenic cells infiltrate the defect area 3 days following bone defect creation [45]. Approximately a week post-injury, blood vessels radiate from the peripheral areas of the periosteum [46]. Connective tissue then starts to envelop the critical-sized defect over roughly 14 days [11]. Following this, initial and secondary bone formation occur from the outer surface of the bone toward the parietal dural surface near the defect approximately 14 and 21 days post-fracture, respectively[46]. Given these established timelines, we hypothesize that, on day 28, the overlying connective tissue and the newly formed bone tissue at the edge impede the optical imaging equipment’s light, leading to decreased vascular parameters. Our histological images corroborated this conjecture.
Notwithstanding, our study presents certain limitations. Foremost, our longitudinal studies incorporated few time points. Acquiring multiple blood vessel images heightens the risk of infection in experimental animals as OCTA data collection is time-consuming. Hence, we opted for critical vascularization time points to undertake imaging. In the next phase of research, we are working toward identifying an optimal optical window to enhance our imaging efficiency. This refinement will make the protocol more amenable to studies requiring frequent tracking. Second, as previously elucidated, the OCTA image on day 28 may be obfuscated by the gradual expansion of fibrous connective tissue and bone tissue, consequently affecting angiographic quality. Optical clearing is recognized as a potential technique to enhance bone penetration. However, we did not use this method in the current study due to concerns regarding its potential interference with the bone healing process. In our forthcoming research endeavors, we plan to explore strategies to circumvent this challenge.
Optical coherence tomography angiography has successfully demonstrated its efficacy in enabling longitudinal tracking of angiogenesis during the bone healing process. When compared to traditional histological methodologies, OCTA delivers higher resolution and more accurate microvascular imaging. The parameters derived from VAD and MVDI show potential to function as objective markers in future vascular observations. Despite certain limitations related to long-term imaging, OCTA represents a promising, non-invasive tool that can substantially contribute to research in the field of bone regeneration.
The original contributions presented in the study are included in the article/Supplementary Material; further inquiries can be directed to the corresponding authors.
The animal study was approved by the Animal Experimentation Committee of The First Affiliated Hospital of Zhejiang University Medical College. The study was conducted in accordance with the local legislation and institutional requirements.
JL and PL initiated the study design. YS and JB improved the OCTA system, performed the experiment, and wrote the original manuscript. LaY assisted in performing the experiment and editing the original manuscript. LiY and XF assisted in editing the original manuscript. JL and PL provided the essential suggestions. All authors contributed to the article and approved the submitted version.
This research was funded by the National Natural Science Foundation of China (no. 81970978) and the National Natural Science Foundation of China (no. 62075189).
The authors declare that the research was conducted in the absence of any commercial or financial relationships that could be construed as a potential conflict of interest.
All claims expressed in this article are solely those of the authors and do not necessarily represent those of their affiliated organizations, or those of the publisher, the editors, and the reviewers. Any product that may be evaluated in this article, or claim that may be made by its manufacturer, is not guaranteed or endorsed by the publisher.
1. Hollý D, Klein M, Mazreku M, Zamborský R, Polák Š, Danišovič Ľ, et al. Stem cells and their derivatives-implications for alveolar bone regeneration: A comprehensive review. Int J Mol Sci (2021) 22(21):11746. doi:10.3390/ijms222111746
2. Kubasiewicz-Ross P, Hadzik J, Seeliger J, Kozak K, Jurczyszyn K, Gerber H, et al. New nano-hydroxyapatite in bone defect regeneration: A histological study in rats. Ann Anat (2017) 213:83–90. doi:10.1016/j.aanat.2017.05.010
3. Boda SK, Almoshari Y, Wang H, Wang X, Reinhardt RA, Duan B, et al. Mineralized nanofiber segments coupled with calcium-binding BMP-2 peptides for alveolar bone regeneration. Acta Biomater (2019) 85:282–93. doi:10.1016/j.actbio.2018.12.051
4. Collignon AM, Lesieur J, Anizan N, Azzouna RB, Poliard A, Gorin C, et al. Early angiogenesis detected by PET imaging with (64)Cu-NODAGA-RGD is predictive of bone critical defect repair. Acta Biomater (2018) 82:111–21. doi:10.1016/j.actbio.2018.10.008
5. Yonamine Y, Matsuyama T, Sonomura T, Takeuchi H, Furuichi Y, Uemura M, et al. Effectable application of vascular endothelial growth factor to critical sized rat calvaria defects. Oral Surg Oral Med Oral Pathol Oral Radiol Endod (2010) 109(2):225–31. doi:10.1016/j.tripleo.2009.09.010
6. Kneser U, Schaefer DJ, Polykandriotis E, Horch RE. Tissue engineering of bone: The reconstructive surgeon's point of view. J Cel Mol Med (2006) 10(1):7–19. doi:10.1111/j.1582-4934.2006.tb00287.x
7. Katagiri W, Kawai T, Osugi M, Sugimura-Wakayama Y, Sakaguchi K, Kojima T, et al. Angiogenesis in newly regenerated bone by secretomes of human mesenchymal stem cells. Maxillofac Plast Reconstr Surg (2017) 39(1):8. doi:10.1186/s40902-017-0106-4
8. Rindone AN, Liu X, Farhat S, Perdomo-Pantoja A, Witham TF, Coutu DL, et al. Quantitative 3D imaging of the cranial microvascular environment at single-cell resolution. Nat Commun (2021) 12(1):6219. doi:10.1038/s41467-021-26455-w
9. Pattillo CB, Fang K, Terracciano J, Kevil CG. Reperfusion of chronic tissue ischemia: Nitrite and dipyridamole regulation of innate immune responses. Ann N Y Acad Sci (2010) 1207:83–8. doi:10.1111/j.1749-6632.2010.05737.x
10. Young S, Patel ZS, Kretlow JD, Murphy MB, Mountziaris PM, Baggett LS, et al. Dose effect of dual delivery of vascular endothelial growth factor and bone morphogenetic protein-2 on bone regeneration in a rat critical-size defect model. Tissue Eng A (2009) 15(9):2347–62. doi:10.1089/ten.tea.2008.0510
11. Udagawa A, Sato S, Hasuike A, Kishida M, Arai Y, Ito K, et al. Micro-CT observation of angiogenesis in bone regeneration. Clin Oral Implan Res (2013) 24(7):787–92. doi:10.1111/j.1600-0501.2012.02458.x
12. Vajgel A, Mardas N, Farias BC, Petrie A, Cimões R, Donos N. A systematic review on the critical size defect model. Clin Oral Implants Res (2014) 25(8):879–93. doi:10.1111/clr.12194
13. Zhang C, Liu CJ, Feng W. A long-term clearing cranial window for longitudinal imaging of cortical and calvarial ischemic injury through the intact skull. Skull (2022) 9(17):e2105893. doi:10.1002/advs.202105893
14. Fan F, Zhang J, Zhu L, Ma Z, Zhu J. Improving cerebral microvascular image quality of optical coherence tomography angiography with deep learning-based segmentation. J Biophotonics (2021) 14(11):e202100171. doi:10.1002/jbio.202100171
15. Li HK, Liu KY, Yao L, Deng XF, Zhang ZY, LiID-Octa P. ID-OCTA: OCT angiography based on inverse SNR and decorrelation features. J Innov Opt Heal Sci (2021) 14(01):2130001. doi:10.1142/S1793545821300019
16. Li P, Huang Z, Yang S, Liu X, Ren Q, Li P. Adaptive classifier allows enhanced flow contrast in OCT angiography using a histogram-based motion threshold and 3D Hessian analysis-based shape filtering. Opt Lett (2017) 42(23):4816–9. doi:10.1364/OL.42.004816
17. Cheng Y, Guo L, Pan C, Lu T, Hong T, Ding Z, et al. Statistical analysis of motion contrast in optical coherence tomography angiography. J Biomed Opt (2015) 20(11):116004. doi:10.1117/1.JBO.20.11.116004
18. Huang L, Fu Y, Chen R, Yang S, Qiu H, Wu X, et al. SNR-adaptive OCT angiography enabled by statistical characterization of intensity and decorrelation with multi-variate time series model. IEEE Trans Med Imaging (2019) 38(11):2695–704. doi:10.1109/TMI.2019.2910871
19. Chu Z, Lin J, Gao C, Xin C, Zhang Q, Chen CL, et al. Quantitative assessment of the retinal microvasculature using optical coherence tomography angiography. J Biomed Opt (2016) 21(6):066008. doi:10.1117/1.JBO.21.6.066008
20. Chalam KV, Sambhav K. Optical coherence tomography angiography in retinal diseases. J Ophthalmic Vis Res (2016) 11(1):84–92. doi:10.4103/2008-322X.180709
21. Roisman L, Zhang Q, Wang RK, Gregori G, Zhang A, Chen CL, et al. Optical coherence tomography angiography of asymptomatic neovascularization in intermediate age-related macular degeneration. Ophthalmology (2016) 123(6):1309–19. doi:10.1016/j.ophtha.2016.01.044
22. Baran U, Choi WJ, Wang RK. Potential use of OCT-based microangiography in clinical dermatology. Skin Res Technol (2016) 22(2):238–46. doi:10.1111/srt.12255
23. Ulrich M, Themstrup L, de Carvalho N, Manfredi M, Grana C, Ciardo S, et al. Dynamic optical coherence tomography in dermatology. Dermatology (2016) 232(3):298–311. doi:10.1159/000444706
24. Wei W, Choi WJ, Wang RK. Microvascular imaging and monitoring of human oral cavity lesions in vivo by swept-source OCT-based angiography. Lasers Med Sci (2018) 33(1):123–34. doi:10.1007/s10103-017-2350-3
25. Wilder-Smith P, Hammer-Wilson MJ, Zhang J, Wang Q, Osann K, Chen Z, et al. In vivo imaging of oral mucositis in an animal model using optical coherence tomography and optical Doppler tomography. Clin Cancer Res (2007) 13(8):2449–54. doi:10.1158/1078-0432.CCR-06-2234
26. Davoudi B, Lindenmaier A, Standish BA, Allo G, Bizheva K, Vitkin A. Noninvasive in vivo structural and vascular imaging of human oral tissues with spectral domain optical coherence tomography. Biomed Opt Express (2012) 3(5):826–39. doi:10.1364/BOE.3.000826
27. Davoudi B, Morrison M, Bizheva K, Yang VX, Dinniwell R, Levin W, et al. Optical coherence tomography platform for microvascular imaging and quantification: Initial experience in late oral radiation toxicity patients. J Biomed Opt (2013) 18(7):076008. doi:10.1117/1.JBO.18.7.076008
28. Patterson J, Stayton PS, Li X. In situ characterization of the degradation of PLGA microspheres in hyaluronic acid hydrogels by optical coherence tomography. IEEE Trans Med Imaging (2009) 28(1):74–81. doi:10.1109/TMI.2008.927356
29. Chen R, Yao L, Liu K, Cao T, Li H, Li P. Improvement of decorrelation-based OCT angiography by an adaptive spatial-temporal kernel in monitoring stimulus-evoked hemodynamic responses. IEEE Trans Med Imaging (2020) 39(12):4286–96. doi:10.1109/TMI.2020.3016334
30. Li Y, Rakymzhan A, Tang P, Wang RK. Procedure and protocols for optical imaging of cerebral blood flow and hemodynamics in awake mice. Biomed Opt Express (2020) 11(6):3288–300. doi:10.1364/BOE.394649
31. Yang S, Liu K, Ding H, Gao H, Zheng X, Ding Z, et al. Longitudinal in vivo intrinsic optical imaging of cortical blood perfusion and tissue damage in focal photothrombosis stroke model. J Cereb Blood Flow Metab (2019) 39(7):1381–93. doi:10.1177/0271678X18762636
32. Spicer PP, Kretlow JD, Young S, Jansen JA, Kasper FK, Mikos AG. Evaluation of bone regeneration using the rat critical size calvarial defect. Nat Protoc (2012) 7(10):1918–29. doi:10.1038/nprot.2012.113
33. Bosch C, Melsen B, Vargervik K. Importance of the critical-size bone defect in testing bone-regenerating materials. J Craniofac Surg (1998) 9(4):310–6. doi:10.1097/00001665-199807000-00004
34. Guo L, Li P, Pan C, Liao RJ, Cheng YX, Hu WW, et al. Improved motion contrast and processing efficiency in OCT angiography using complex-correlation algorithm. J Opt (2016) 18(2):025301. doi:10.1088/2040-8978/18/2/025301
35. Verna C, Dalstra M, Wikesjö UM, Trombelli L, Carles B. Healing patterns in calvarial bone defects following guided bone regeneration in rats. A micro-CT scan analysis. J Clin Periodontol (2002) 29(9):865–70. doi:10.1034/j.1600-051x.2002.290912.x
36. Cooper GM, Mooney MP, Gosain AK, Campbell PG, Losee JE, Huard J. Testing the critical size in calvarial bone defects: Revisiting the concept of a critical-size defect. Plast Reconstr Surg (2010) 125(6):1685–92. doi:10.1097/PRS.0b013e3181cb63a3
37. Wang J, Glimcher MJ. Characterization of matrix-induced osteogenesis in rat calvarial bone defects: I. Differences in the cellular response to demineralized bone matrix implanted in calvarial defects and in subcutaneous sites. Calcif Tissue Int (1999) 65(2):156–65. doi:10.1007/s002239900676
38. Chen WH, Mao CQ, Zhuo LL, Ong JL. Beta-nerve growth factor promotes neurogenesis and angiogenesis during the repair of bone defects. Neural Regen Res (2015) 10(7):1159–65. doi:10.4103/1673-5374.160114
39. Wang S, Li M, Zhang W, Hua H, Wang N, Zhao J, et al. Growth differentiation factor 15 promotes blood vessel growth by stimulating cell cycle progression in repair of critical-sized calvarial defect. Sci Rep (2017) 7(1):9027. doi:10.1038/s41598-017-09210-4
40. Qiu P, Li M, Chen K, Fang B, Chen P, Tang Z, et al. Periosteal matrix-derived hydrogel promotes bone repair through an early immune regulation coupled with enhanced angio- and osteogenesis. Biomaterials (2020) 227:119552. doi:10.1016/j.biomaterials.2019.119552
41. Gao SS, Jia Y, Zhang M, Su JP, Liu G, Hwang TS, et al. Optical coherence tomography angiography. Invest Ophthalmol Vis Sci (2016) 57(9):OCT27–36. doi:10.1167/iovs.15-19043
42. Kashani AH, Chen CL, Gahm JK, Zheng F, Richter GM, Rosenfeld PJ, et al. Optical coherence tomography angiography: A comprehensive review of current methods and clinical applications. Prog Retin Eye Res (2017) 60:66–100. doi:10.1016/j.preteyeres.2017.07.002
43. Chen CL, Wang RK. Optical coherence tomography based angiography [Invited]. Biomed Opt Express (2017) 8(2):1056–82. doi:10.1364/BOE.8.001056
44. Li H, Liu K, Cao T, Yao L, Zhang Z, Deng X, et al. High performance OCTA enabled by combining features of shape, intensity, and complex decorrelation. Opt Lett (2021) 46(2):368–71. doi:10.1364/OL.405751
45. Einhorn TA, Gerstenfeld LC. Fracture healing: Mechanisms and interventions. Nat Rev Rheumatol (2015) 11(1):45–54. doi:10.1038/nrrheum.2014.164
Keywords: optical coherence tomography angiography, critical-sized defect, angiogenesis, skull bone, histological analysis
Citation: Shen Y, Bu J, Yu L, Yao L, Feng X, Lin J and Li P (2023) Optical coherence tomography angiography allows longitudinal monitoring of angiogenesis in the critical-sized defect model. Front. Phys. 11:1218179. doi: 10.3389/fphy.2023.1218179
Received: 06 May 2023; Accepted: 07 August 2023;
Published: 23 August 2023.
Edited by:
Chunhui Li, University of Dundee, United KingdomReviewed by:
Mehmet Burcin Unlu, Boğaziçi University, TürkiyeCopyright © 2023 Shen, Bu, Yu, Yao, Feng, Lin and Li. This is an open-access article distributed under the terms of the Creative Commons Attribution License (CC BY). The use, distribution or reproduction in other forums is permitted, provided the original author(s) and the copyright owner(s) are credited and that the original publication in this journal is cited, in accordance with accepted academic practice. No use, distribution or reproduction is permitted which does not comply with these terms.
*Correspondence: Jun Lin, bGluanVuMkB6anUuZWR1LmNu; Peng Li, cGVuZ19saUB6anUuZWR1LmNu
†These authors share first authorship
Disclaimer: All claims expressed in this article are solely those of the authors and do not necessarily represent those of their affiliated organizations, or those of the publisher, the editors and the reviewers. Any product that may be evaluated in this article or claim that may be made by its manufacturer is not guaranteed or endorsed by the publisher.
Research integrity at Frontiers
Learn more about the work of our research integrity team to safeguard the quality of each article we publish.