 Wenjian Wang
 Nauman Ali1,2,3
 Ying Ma
 Chao Zuo
 Peng Gao
95% of researchers rate our articles as excellent or good
Learn more about the work of our research integrity team to safeguard the quality of each article we publish.
Find out more
BRIEF RESEARCH REPORT article
Front. Phys. , 05 July 2023
Sec. Optics and Photonics
Volume 11 - 2023 | https://doi.org/10.3389/fphy.2023.1218147
This article is part of the Research Topic Optical Microscopy: Advances and Applications View all 5 articles
Quantitative phase microscopy (QPM) is a powerful tool for label-free and noninvasive imaging of transparent specimens. In this paper, we propose a novel QPM approach that utilizes deep learning to reconstruct accurately the phase image of transparent specimens from a defocus bright-field image. A U-net based model is used to learn the mapping relation from the defocus intensity image to the phase distribution of a sample. Both the off-axis hologram and defocused bright-field image are recorded in pair for thousands of virtual samples generated by using a spatial light modulator. After the network is trained with the above data set, the network can fast and accurately reconstruct the phase information through a defocus bright-field intensity image. We envisage that this method will be widely applied in life science and industrial detection.
Fluorescence microscopy (FM) is one of the approaches that image transparent samples with high contrast and high specificity. However, fluorescence labeling inevitably causes irreversible effects on samples, including phototoxicity and photobleaching, thereby preventing FM for long-time imaging of live samples [1]. Being a label-free and noninvasive imaging technique, quantitative phase microscopy (QPM) can visualize transparent samples with high contrast and in a quantitative manner by recovering the phase of the light after passing through a sample [2, 3]. In the past few decades, QPM has developed rapidly in both structure design and algorithm optimization. The QPM approaches can be classified into three types. The first type is wavefront-sensing, such as Shack-Hartmann sensor [4, 5]. This type of QPM techniques have a simple structure and fast wavefront measurement speed, while the spatial resolution is limited by the diameter of micro-lenses. The second type is interferometric microscopy, which records interference patterns between an object wave with a reference wave, has played an important role in many fields due to its precedent phase accuracy [6–8]. However, the interferometric microscopic approaches are susceptible to environmental disturbances. The third type is diffraction-based QPM, such as transport-of-intensity equation (TIE) [9], Fourier ptychographic microscopy (FPM) [10], and beam propagation based phase retrieval approach [11], featuring simple structure and low cost. The quantitative phase image can be obtained after recording multiple diffraction patterns under different constraints and processing the data with a physical model. These methods are non-interferometric and are hence immune to environmental disturbances. Often, a sophisticated algorithm is required to reconstruct the phase from the recorded diffraction patterns, and the phase reconstruction is time consuming, which takes from seconds to minutes.
In recent years, deep learning (DL) has been demonstrated as a powerful tool for solving various inverse problems through training a network with a large quantity of paired images. Once sufficient training data are collected in an environment that reproduces real experimental conditions, the trained model can not only solve the inverse problem, but also exceed physics-model-based approaches on some issues (e.g., computing speed, parameter adaptivity, algorithm complexity, the number of raw images required) [12]. The price for the above merits is the laborious capture of massive datasets comprised of thousands of raw-image/ground-truth pairs. Recently, Ulyanov et al. designed a Deep Image Prior (DIP) framework that uses an untrained network as a constraint to solve common inverse problems, considering a well-designed network framework has an implicit bias in images [13]. The DIP has a preponderant advantage: it does not need pre-training with a large amount of labeled data. DL has been applied in different fields, including scattering image restoration [14], wavefront sensing [15], super-resolution imaging [16–22], and image denoising [23]. Notably, deep learning has been introduced into DHM to address phase recovery and aberration compensation problems [24–28]. To cite a few, deep learning was used to retrieve complex-amplitude images (including amplitude- and phase-images) from the holograms of inline DHM [29] and off-axis DHM [30, 31], eliminating twin-image artifacts and other phase errors. Ren et al. [32] utilized an end-to-end network to refocus different types of samples from a defocused hologram. Li et al proposed a deep learning assisted variational Hilbert quantitative phase imaging approach, which can recover a high-accuracy artifacts-free phase image from a low carrier frequency hologram [33]. In addition, deep learning algorithms are well-suited for converting the images of different modalities, for instance, a U-net based DL approach was used to convert a DIC images to fluorescence images, with which the volume of a cell can be measured in a label free manner [34]. In general, DL can promote existing imaging approaches by extending their performance, transiting the image among different modalities, reducing experimental time and costs, etc.
In a bright-field microscopy, once a sample is imaged in a defocused manner, the phase information is encrypted in the intensity pattern via a diffraction process. The conventional physics-modeled based approaches require recording of three defocused intensity images at least to reconstruct the encrypted phase. In this paper, we propose a deep-learning-based QPM approach that predicts the phase image of a sample from a defocused bright-field intensity image. For this purpose, a U-net is trained with the phase-intensity image pairs, of which the phase images are obtained using an off-axis DHM configuration and a phase-type spatial light modulator (SLM) to generate a series of phase samples. The experimental results show that the proposed DL-based approach can accurately obtain the phase information from a single defocused bright-field intensity image by using the trained network.
The schematic diagram of the DLQPM system is shown in Figure 1A. A 633 nm He-Ne laser was used as a coherent illumination source for off-axis DHM and bright-field imaging (once the reference wave is blocked). For DHM imaging, the illumination beam is divided into two identical copies by a 1:1 beam splitter, where one is used for the coherent bright-field imaging (object wave), and the other one is used as the reference wave. In the object wave arm, a magnification unit composed of a microscopic objective (MO) and a tube lens (L2) is used to magnify a sample. A phase-type SLM (HRSLM84R, Shanghai, UPOLabs, China) is placed on the image plane of the sample to generate pure phase objects for the network training. The SLM is further imaged through a 4f system consisting of lens L3 and lens L4 to a CCD camera. The object wave and the reference wave are recombined by a beam splitter BS2, and the two interfere with each other on the CCD plane. The CCD camera records the generated off-axis hologram Iholo, from which both the amplitude and phase images of the sample can be reconstructed by using a standard reconstruction algorithm.
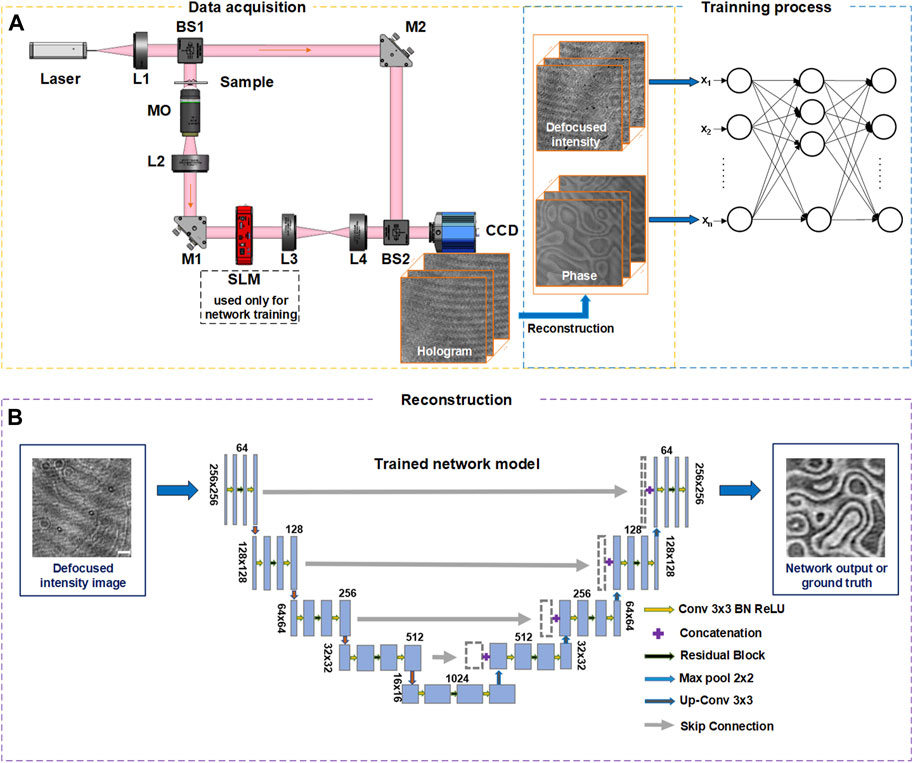
FIGURE 1. Work-flow of DLQPM network. (A) Network-training flow diagram. L, lens; M, mirror; MO, micro-objective; BS, beam splitter; SLM, spatial light modulator. The orange and blue blocks are the data acquisition network training units. (B) Phase reconstruction of DLQPM using the trained network. The scale bar in (B) represents 0.2 mm.
For DLQPM imaging, defocused bright-field intensity images of pure phase samples are recorded by the same CCD camera in the absence of the reference wave. The nonlinear relation between the defocus intensity and the phase information [35] can be simply expressed as
Here, (x, y) are the lateral coordinates on the sample plane, Id (x, y) is the defocus intensity image, φ (x, y) is the phase information of the sample,
The U-net can be trained with a set of Id-φ data pairs (see Figure 1A), for which φ can be obtained using off-axis DHM and a numerical focusing procedure, and Id (x, y) is recorded by blocking the reference wave. To generate the training data pairs, the images from the MNIST dataset (Modified National Institute of Standards and Technology database [38]) were loaded onto the SLM (1,280 × 1,024 pixels, pixel size: 18 × 18 μm) one by one. The defocus bright-field intensity images Id (x, y) and off-axis holograms Ih (x, y) were captured by a CCD (960 × 1,280 pixels, pixel size: 3.75 × 3.75 μm), respectively. The in-focus phase images φ (x, y) are calculated by the traditional DHM recovery algorithm [6] and digitally propagated to the image plane using an angular spectrum based algorithm [39]. Then the acquired Id (x, y) and φ (x, y) are cropped with a size of 256 × 256 pixels, where the phase images are used as the Ground truth input of the neural network. For implementing the network model, Pytorch framework based on Python 3.6.1 is used. The network training and testing are performed on a PC with Intel Core processor i7-9700CPU, using NVIDIA GeForce GTX2060 GPU.
At first, handwritten numerals were loaded to the SLM, as virtual samples, to test the DLQPM network, following a similar protocol depicted in Ref. [31]. A total of 3,656 images of numerals were utilized in the experiment, of which 3,500 images were used as the training set and 156 images as the test set. Both the off-axis holograms and defocused intensity images were recorded for each sample. Figure 2A shows the defocused bright-field intensity image of the numeral 6, from which the phase image can be reconstructed by using the trained network, as shown in Figure 2B. It can be seen that the reconstructed phase is similar to the ground-truth phase image reconstructed by the off-axis DHM (Figure 2C). To evaluate the accuracy of the network on phase imaging quantitively, we used the structural similarity index measure (SSIM) as an evaluation indicator. The SSIM value between the neural network output image and the Ground Truth is 0.965, further verifying the feasibility and accuracy of our method. Then, a series of random phase patterns generated by SLM were used to further test the DLQPM reconstruction. Figures 2D, E show the reconstructed phase images by DLQPM and the off-axis DHM. Further, the images in Figure 2F show the difference between the phase images reconstructed by the two approaches. The phase difference (error) features a standard deviation of 0.15 rad for the samples with a peak-to-valley (P-V) value around 1.5 rad, which means that the trained network can reconstruct a phase image with high phase accuracy. The error may be caused by the speckle noise of the coherent illumination and the phase fluctuation induced by environmental disturbances during DHM imaging. It can be concluded from the above experiments that our neural network can accurately recover the phase information of a sample from a bright-field defocus intensity image.
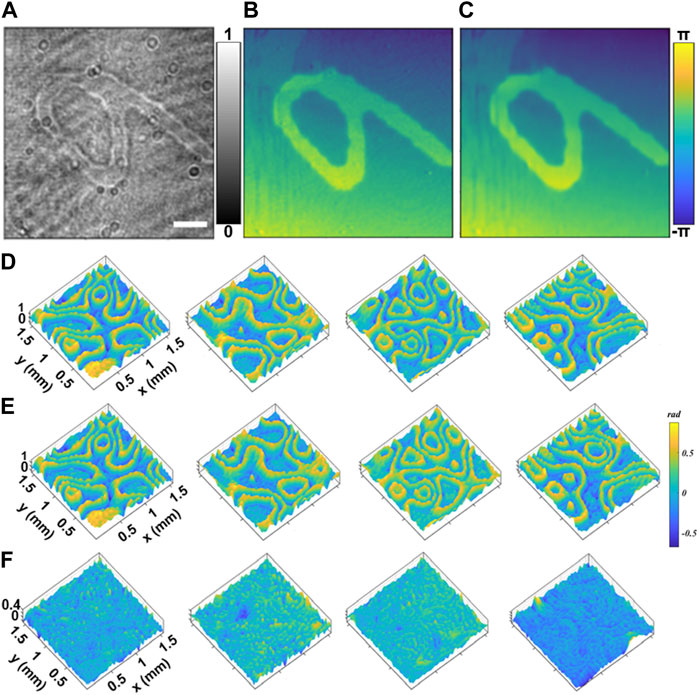
FIGURE 2. Verification of DLQPM for quantitative phase imaging. (A) The defocused bright-field intensity image of a numeral of 6. (B) Phase image reconstructed by the off-axis DHM (ground-truth). (C) Phase image obtained by DLQPM. For the rand-pattern samples, the phase images were reconstructed by DLQPM (D) and the off-axis DHM (E) when a series of random phase patterns were loaded to the SLM for testing. (F) Shows the difference between the phase images in (D,E). The scale bar in (A) represents 0.2 mm.
As mentioned before, the proposed neural network can predict a phase image from a defocused bright-field intensity image, considering the fact that the defocused image carries the phase information of the sample. It is important to investigate the effect of the defocusing distance on the phase prediction performance of the proposed neural network. We still used the SLM-generated random phase patterns as training-testing data, but we used a series of defocus distances varying from 0 cm–6 cm during Id-Ih recording. For each defocusing distance, we recorded 3,621 pairs of data, of which 3,500 used as the training data set and the rest as the testing data set. Each raw data pair were augmented to 6 pairs for neural network training through flipping and reversing operations. Figures 3A, B show the defocused intensity images and the recovered phase images at different defocus positions, respectively. Figure 3C shows the phase error maps between the phase image reconstructed by the network and the ground-true phase image (Figure 3D) obtained by the off-axis DHM. Further, Figure 3E implies the averaged phase error of the 121 tested data decrease with the defocusing distance. This is due to the fact that the influence of the phase information on the intensity image increases as the defocusing distance increases. Further, we randomly selected ten testing data and calculated the structural similarity index measure (SSIM) of the network outputs with respect to their ground-truth phase images. The circles in Figure 3F present the SSIMs calculated for the individual test data, and the red solid-boxes show the averaged SSIM at different defocusing distances. The results show that the quality of the network output increases with the defocusing distance before it becomes saturated at a defocusing distance of 3.5 cm, meaning that the proposed method can recover appropriate phase information once the defocusing distance is larger than 3.5 cm.
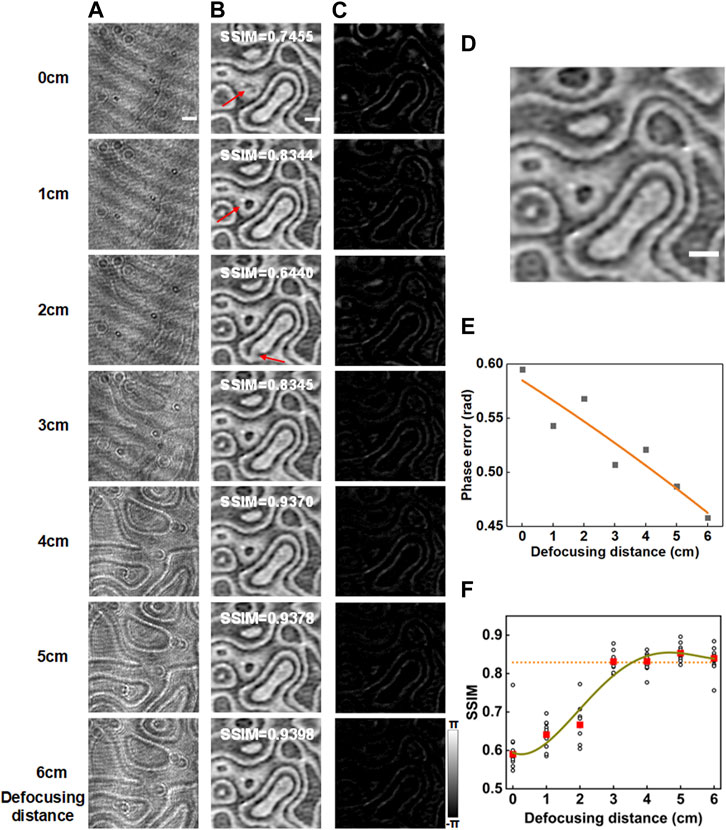
FIGURE 3. Effect of defocusing distance on the phase reconstruction of DLQPM. (A) Intensity images recorded at different defocusing distances varying from 0 to 6 cm. (B) The phase images recovered by the trained network model. (C) The error maps between the network output phase images and the phase images reconstructed by the off-axis DHM (D). (E) Phase error versus defocusing distance for the test image in (D). (F) SSIM curve versus the defocusing distance. In (F), the circles represent the SSIM values for ten randomly-selected testing data, while the solid rectangles represent the averaged SSIM of the ten testing data. The curves in (E,F) are four-order polynomial fits. The scale bar in (A) represents 0.2 mm.
To further verify the feasibility of the DLQPM for imaging biological sample, human red blood cells (RBCs) were used as the sample. 17,200 image pairs of the Id-Ih data pairs were taken, where 15,000 and 2,200 pairs were used for the training and the testing, respectively. Figure 4A shows the captured hologram Ih of the RBCs by the off-axis DHM. Figures 4B, C show the three-dimensional and two-dimensional distribution of the RBCs, reconstructed from the off-axis hologram. Figure 4D shows the captured defocus bright-filed intensity of RBCs, from which the three-dimensional and two-dimensional phase distribution of RBCs were reconstructed by using the proposed DLQPM, as shown in Figures 4E, F, respectively. The comparison between Figures 4C, F tells that the proposed method can accurately reconstruct the phase of the RBCs. It is worth noting that the DLQPM image has lower speckle noise and artifacts than that obtained by the off-axis DHM. This is due to the fact that the interference between the object wave and the reference wave is avoided, which will induce additional speckle noises and artifacts.
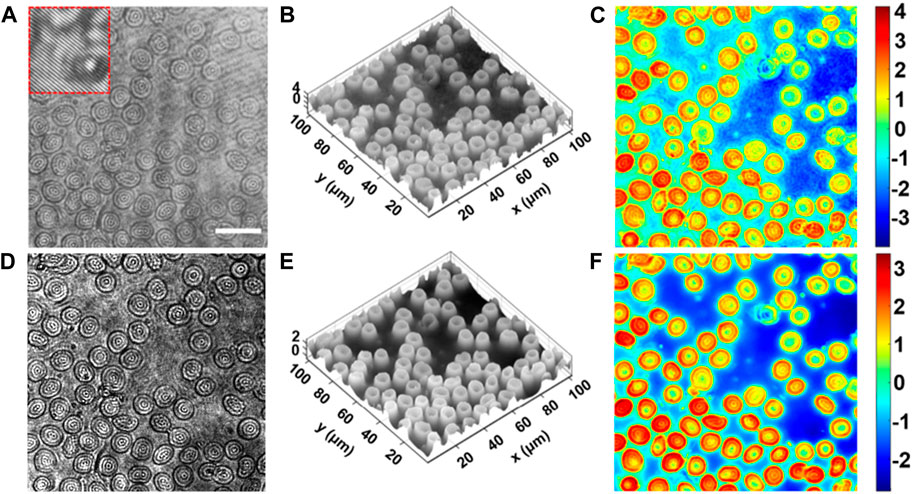
FIGURE 4. Quantitative phase imaging of blood cells by the proposed DLQPM. (A) Hologram of the human red blood cells by the off-axis DHM. (B,C) 3D and 2D displays of the phase distribution reconstructed by the off-axis DHM. (D) The defocused bright-field intensity image with a defocusing distance d = 120 μm. (E) 3D and (F) 2D Neural network output phase image. The scale bar in (A) represents 20 μm.
In this paper, we proposed a novel deep learning based QPM phase reconstruction approach (entitled DLQPM), which can reconstruct a phase image from a defocused bright-field intensity image (Id) using a U-net. In the implementation, the network should be trained beforehands, for which the data pairs were obtained by inserting a SLM into an off-axis DHM. Therefore, sufficient training data are collected in an environment that reproduces the actual experimental conditions. Compared to the conventional physics-modeled based approaches, which need to record at least three defocused intensity images to reconstruct the phase, the proposed DL-based approach can accurately obtain the phase information from a single defocused bright-field intensity image.
We quantitatively analyzed the effect of defocusing distance on the phase recovery performance of DLQPM, and the results show that the phase reconstruction quality increase with the defocusing distance and it become saturated after a defocusing distance of 3 cm. Notably, the proposed method can also be used for the bright-field microscope equipped with partially coherent illumination or incoherent illumination, and in this case the training data pairs can be obtained with single beam phase retrieval approaches. We envisage that this method will be useful for life science research and industrial detection.
Publicly available datasets were analyzed in this study. This data can be found here: http://yann.lecun.com/exdb/mnist/.
PG and YM conceived and supervised the project. WW performed experiments. All authors contributed to the article and approved the submitted version.
This work was supported by the National Natural Science Foundation of China (NSFC 62075177, 62105251); the Natural Science Foundation of Shaanxi Province, grant number 2023JCQN0731, 2023JCYB518; National Key Research and Development Program of China, grant number 2021YFF0700300, 2022YFE0100700; the Fundamental Research Funds for the Central Universities (QTZX23024, QTZX23013, and QTZX23008), Key Laboratory of Wuliangye-flavor Liquor Solid-state Fermentation, China National Light Industry, grant number 2019JJ012, and the Open Research Fund of State Key Laboratory of Transient Optics and Photonics.
The authors declare that the research was conducted in the absence of any commercial or financial relationships that could be construed as a potential conflict of interest.
All claims expressed in this article are solely those of the authors and do not necessarily represent those of their affiliated organizations, or those of the publisher, the editors and the reviewers. Any product that may be evaluated in this article, or claim that may be made by its manufacturer, is not guaranteed or endorsed by the publisher.
1. Rivenson Y, Wang H, Wei Z, de Haan K, Zhang Y, Wu Y, et al. Virtual histological staining of unlabelled tissue-autofluorescence images via deep learning. Nat Bio Eng (2019) 3:466–77. doi:10.1038/s41551-019-0362-y
2. Hsieh C-L, Grange R, Pu Y, Psaltis D. Three-dimensional harmonic holographic microcopy using nanoparticles as probes for cell imaging. Opt Express (2009) 17:2880–91. doi:10.1364/oe.17.002880
3. Robert HML, Holanova K, Bujak L, Vala M, Henrichs V, Lansky Z, et al. Fast photothermal spatial light modulation for quantitative phase imaging at the nanoscale. Nat Commun (2021) 12:2921. doi:10.1038/s41467-021-23252-3
4. Platt BC, Shack R. History and principles of Shack-Hartmann wavefront sensing. J Refractive Surg (2001) 17:S573–S577. doi:10.3928/1081-597x-20010901-13
5. Ko J, Davis CC. Comparison of the plenoptic sensor and the Shack-Hartmann sensor. Appl Opt (2017) 56:3689–98. doi:10.1364/ao.56.003689
6. Kemper B, Von Bally G. Digital holographic microscopy for live cell applications and technical inspection. Appl Opt (2008) 47:A52–A61. doi:10.1364/AO.47.000A52
7. Garcia-Sucerquia J, Xu W, Jericho SK, Klages P, Jericho MH, Kreuzer HJ. Digital in-line holographic microscopy. Appl Opt (2006) 45:836–50. doi:10.1364/AO.45.000836
8. Charrière F, Marian A, Montfort F, Kuehn J, Colomb T, Cuche E, et al. Cell refractive index tomography by digital holographic microscopy. Opt Lett (2006) 31:178–80. doi:10.1364/ol.31.000178
9. Zuo C, Chen Q, Qu W, Asundi A. Direct continuous phase demodulation in digital holography with use of the transport-of-intensity equation. Opt Com (2013) 309:221–6. doi:10.1016/j.optcom.2013.07.013
10. Zheng G, Horstmeyer R, Yang C. Wide-field, high-resolution Fourier ptychographic microscopy. Nat Pho (2013) 7:739–45. doi:10.1038/NPHOTON.2013.187
11. Gao P, Pedrini G, Zuo C, Osten W. Phase retrieval using spatially modulated illumination. Opt Lett (2014) 39:3615–8. doi:10.1364/OL.39.003615
12. Zuo C, Qian JM, Feng SJ, Yin W, Li YX, Fan PF, et al. Deep learning in optical metrology: A review. Light-sci Appl (2022) 11:39. doi:10.1038/s41377-022-00714-x
13. Ulyanov D, Vedaldi A, Lempitsky V, Deep image prior: Proceedings of the IEEE conference on computer vision and pattern recognition, 2018, pp. 9446–54.
14. Li Y, Xue Y, Tian L. Deep speckle correlation: A deep learning approach toward scalable imaging through scattering media. Optica (2018) 5:1181–90. doi:10.1364/optica.5.001181
15. Wang K, Zhang M, Tang J, Wang L, Hu L, Wu X, et al. Deep learning wavefront sensing and aberration correction in atmospheric turbulence. PhotoniX (2021) 2:8–11. doi:10.1186/s43074-021-00030-4
16. Dou J, Gao Z, Ma J, Yuan C, Yang Z, Claus D, et al. Phase retrieval based on pupil scanning modulation. Appl Phy B-las Opt (2017) 123:217–9. doi:10.1007/s00340-017-6791-y
17. Mann CJ, Yu L, Lo C-M, Kim MK. High-resolution quantitative phase-contrast microscopy by digital holography. Opt Express (2005) 13:8693–8. doi:10.1364/opex.13.008693
18. Gao P, Pedrini G, Osten W. Structured illumination for resolution enhancement and autofocusing in digital holographic microscopy. Opt Lett (2013) 38:1328–30. doi:10.1364/ol.38.001328
19. Rivenson Y, Göröcs Z, Günaydin H, Zhang Y, Wang H, Ozcan A, Deep learning microscopy. Optica 4 (2017) 4:1437–43. doi:10.1364/optica.4.001437
20. Fang L, Monroe F, Novak SW, Kirk L, Schiavon CR, Yu SB, et al. Deep learning-based point-scanning super-resolution imaging. Nat Met (2021) 18:406–16. doi:10.1038/s41592-021-01080-z
21. Wang H, Rivenson Y, Jin Y, Wei Z, Gao R, Günaydın H, et al. Deep learning enables cross-modality super-resolution in fluorescence microscopy. Nat Met (2019) 16:103–10. doi:10.1038/s41592-018-0239-0
22. Liao J, Qu J, Hao Y, Li J. Deep-learning-based methods for super-resolution fluorescence microscopy. Jour Inn Opt Hea Sci (2022) 16. doi:10.1142/s1793545822300166
23. Wu H, Wang R, Zhao G, Xiao H, Liang J, Wang D, et al. Deep-learning denoising computational ghost imaging. Opt Las Eng (2020) 134:106183. doi:10.1016/j.optlaseng.2020.106183
24. Rivenson Y, Wu Y, Ozcan A. Deep learning in holography and coherent imaging. Light: Sci Appl (2019) 8:85. doi:10.1038/s41377-019-0196-0
25. Nguyen T, Bui V, Lam V, Raub CB, Chang L-C, Nehmetallah G. Automatic phase aberration compensation for digital holographic microscopy based on deep learning background detection. Opt Express (2017) 25:15043–57. doi:10.1364/oe.25.015043
26. Situ G. Deep holography. Deep Holography Light: Adv Man (2022) 3:1–300. doi:10.37188/lam.2022.013
27. Ma S, Fang R, Luo Y, Liu Q, Wang S, Zhou X. Phase-aberration compensation via deep learning in digital holographic microscopy. Mea Sci Tech (2021) 32:105203. doi:10.1088/1361-6501/ac0216
28. Chen HL, Huang LZ, Liu TR, Ozcan A. Fourier imager network (FIN): A deep neural network for hologram reconstruction with superior external generalization. Light-sci Appl (2022) 11:254. doi:10.1038/s41377-022-00949-8
29. Rivenson Y, Zhang Y, Gnaydin H, Teng D, Ozcan A. Phase recovery and holographic image reconstruction using deep learning in neural networks. Light: Sci Appl (2018) 7:17141. doi:10.1038/lsa.2017.141
30. Wang K, Dou J, Kemao Q, Di J, Zhao J, Y-net: A one-to-two deep learning framework for digital holographic reconstruction. Opt Lett (2019) 44:4765–8. doi:10.1364/ol.44.004765
31. Wang K, Li Y, Kemao Q, Di J, Zhao J. One-step robust deep learning phase unwrapping. Opt Express (2019) 27:15100–15. doi:10.1364/oe.27.015100
32. Ren ZB, Xu ZM, Lam EY. End-to-end deep learning framework for digital holographic reconstruction. Adv Photon (2019) 1:1. doi:10.1117/1.Ap.1.1.016004
33. Li Z, Sun J, Fan Y, Jin Y, Shen Q, Trusiak M, et al. Deep learning assisted variational Hilbert quantitative phase imaging. Opto-Electronic Sci (2023) 2:220023–1. doi:10.29026/oes.2023.220023
34. Yao K, Rochman ND, Sun SX. Ctrl - a label-free artificial intelligence method for dynamic measurement of single-cell volume. J Cel Sci. (2020) 133:jcs245050. doi:10.1242/jcs.245050
35. Goodman JW, Cox ME. Introduction to fourier optics. McGraw-Hill (1968) 22:97–101. doi:10.1063/1.3035549
36. Alom MZ, Yakopcic C, Hasan M, Taha TM, Asari VK. Recurrent residual U-Net for medical image segmentation. Jour Med Ima (2019) 6:1. doi:10.1117/1.Jmi.6.1.014006
37. Li Y, Di JL, Ma CJ, Zhang JW, Zhong JZ, Wang KQ, et al. Quantitative phase microscopy for cellular dynamics based on transport of intensity equation. Opt Express (2018) 26:586–93. doi:10.1364/oe.26.000586
38. LeCun Y, Boser B, Denker JS, Henderson D, Howard RE, Hubbard W, et al. Backpropagation applied to handwritten zip code recognition. Neu Com (1989) 1:541–51. doi:10.1162/neco.1989.1.4.541
Keywords: deep learning, quantitative phase microscopy, label-free, defocused recording, holography
Citation: Wang W, Ali N, Ma Y, Dong Z, Zuo C and Gao P (2023) Deep learning-based quantitative phase microscopy. Front. Phys. 11:1218147. doi: 10.3389/fphy.2023.1218147
Received: 06 May 2023; Accepted: 27 June 2023;
Published: 05 July 2023.
Edited by:
Sushank Chaudhary, Chulalongkorn University, ThailandReviewed by:
Abhishek Sharma, Guru Nanak Dev University, IndiaCopyright © 2023 Wang, Ali, Ma, Dong, Zuo and Gao. This is an open-access article distributed under the terms of the Creative Commons Attribution License (CC BY). The use, distribution or reproduction in other forums is permitted, provided the original author(s) and the copyright owner(s) are credited and that the original publication in this journal is cited, in accordance with accepted academic practice. No use, distribution or reproduction is permitted which does not comply with these terms.
*Correspondence: Ying Ma, eWluZ21hQHhpZGlhbi5lZHUuY24=; Zhao Dong, ZG9uZ3poYW9AaGViZXUuZWR1LmNu; Chao Zuo, enVvY2hhb0BuanVzdC5lZHUuY24=; Peng Gao, cGVuZy5nYW9AeGlkaWFuLmVkdS5jbg==
Disclaimer: All claims expressed in this article are solely those of the authors and do not necessarily represent those of their affiliated organizations, or those of the publisher, the editors and the reviewers. Any product that may be evaluated in this article or claim that may be made by its manufacturer is not guaranteed or endorsed by the publisher.
Research integrity at Frontiers
Learn more about the work of our research integrity team to safeguard the quality of each article we publish.