 Qianxi Ni
 Jun Zhu2*
- 1School of Nuclear Science and Technology, University of South China, Hengyang, China
- 2Department of Radiation Oncology, Hunan Cancer Hospital, The Affiliated Cancer Hospital of Xiangya School of Medicine, Central South University, Changsha, China
Background and objectives: Implementation of patient-specific quality assurance (PSQA) is a crucial aspect of precise radiotherapy. Various machine learning-based models have showed potential as virtual quality assurance tools, being capable of accurately predicting the dose verification results of fixed-beam intensity-modulated radiation therapy (IMRT) or volumetric modulated arc therapy (VMAT) plans, thereby ensuring safe and efficient treatment for patients. However, there has been no research yet that simultaneously integrates different IMRT techniques to predict the gamma pass rate (GPR) and explain the model.
Methods: Retrospective analysis of the 3D dosimetric verification results based on measurements with gamma pass rate criteria of 3%/2 mm and 10% dose threshold of 409 pelvic IMRT and VMAT plans was carried out. Radiomics features were extracted from the dose files, from which the XGBoost algorithm based on SHapley Additive exPlanations (SHAP) values was used to select the optimal feature subset as the input for the prediction model. The study employed four different machine learning algorithms, namely, random forest (RF), adaptive boosting (AdaBoost), extreme gradient boosting (XGBoost), and light gradient boosting machine (LightGBM), to construct predictive models. Sensitivity, specificity, F1 score, and AUC value were calculated to evaluate the classification performance of these models. The SHAP values were utilized to perform a related interpretive analysis on the best performing model.
Results: The sensitivities and specificities of the RF, AdaBoost, XGBoost, and LightGBM models were 0.96, 0.82, 0.93, and 0.89, and 0.38, 0.54, 0.62, and 0.62, respectively. The F1 scores and area under the curve (AUC) values were 0.86, 0.81, 0.88, and 0.86, and 0.81, 0.77, 0.85, and 0.83, respectively. The explanation of the model output based on SHAP values can provide a reference basis for medical physicists when adjusting the plan, thereby improving the efficiency and quality of treatment plans.
Conclusion: It is feasible to use a machine learning method based on radiomics to establish a gamma pass rate classification prediction model for IMRT and VMAT plans in the pelvis. The XGBoost model performs better in classification than the other three tree-based ensemble models, and global explanations and single-sample explanations of the model output through SHAP values may offer reference for medical physicists to provide high-quality plans, promoting the clinical application and implementation of GPR prediction models, and providing safe and efficient personalized QA management for patients.
1 Introduction
Radiotherapy is a vital means of tumor treatment. With the rapid development and advancement of treatment techniques, multidisciplinary collaboration is becoming increasingly important [1]. Intensity-modulated radiation therapy (IMRT) allows the adjustment of the intensity distribution of radiation within the field, providing a highly conformal dose distribution to different shaped tumor target volumes while reducing the dose to surrounding normal tissues [2]. Due to the complexity of IMRT/VMAT treatment delivery, it is essential to implement patient-specific quality assurance (PSQA) in advance of treatment delivery to ensure that delivery is carried out safely [3]. To date, PSQA has been conducted using a measurement-based approach that compares the dose calculated by the treatment planning system (TPS) with the measured dose [4, 5]. The method used to evaluate the difference between calculated and measured doses is γ analysis, which enables the quantitative assessment of areas that pass versus fail criteria [6]. The specific QA based on the phantom measurement includes a series of processes such as dose recalculation, data transmission, phantom placement, beam transmission, and γ analysis on the phantom, which requires a lot of time and resources, and not only increases the burden of medical physicists but also delays the time of first treatment of patients [7]. To improve the efficiency and safety of IMRT/VMAT treatment plan implementation, utilizing treatment plan complexity indicators can reliably identify those QA plans that are not likely to pass the criteria before treatment [8].
In recent years, with the rapid development of artificial intelligence technology, machine learning and deep learning-based methods have been increasingly used in radiotherapy QA [9, 10]. [11] developed a method to predict the gamma pass rate (GPR) of IMRT plans, which used lasso-based Poisson regression to learn the relationship between features and GPR. [12] accurately predicted the GPR for portal dosimetry-based IMRT using plan complexity indicators and machine characteristics. Three tree-based learning models were used, where the maximum error was less than 4% and the average absolute error was less than 1%. [13] used a combination of plan complexity features as input to predict the GPR of VMAT plans, achieving an error of less than 3% for 94% of the plans when the random forest regression (RFR) and support vector regression (SVR) models were used. The use of machine learning-based models as virtual QA tools has shown significant potential. It can quickly and accurately predict the dose verification results of IMRT or VMAT plans, ensuring the patient with safe and efficient treatment [14–17]. However, there have been no studies on the prediction of GPR incorporating different intensity-modulated radiotherapy techniques simultaneously.
[18] in 2017 proposed the SHapley Additive exPlanations (SHAP) value as a method to solve the interpretability of the model, combined with the machine learning algorithm which can assign a specific predicted contribution value to each feature, and proposed the SHAP value as the unique measure of feature importance in the prediction model. Therefore, this paper aims to explore the feasibility of a classification prediction model of the GPR combining IMRT and VMAT plans using a radiomics-based machine learning method, and to try interpreting the output of the best performing model of the four integrated tree models using SHAP values.
2 Materials and methods
2.1 Data preparation
In this study, 409 pelvic patients (220 cervical cancer, 73 rectal cancer, 91 uterine cancer, and 25 others) who received IMRT or VMAT at the Radiotherapy Centre of Hunan Cancer Hospital from November 2020 to December 2022 were retrospectively collected. The QA plan was calculated with the Pinnacle3 treatment planning system (Version 9.2, Philips) for 196 cases of IMRT. The dose grid was 3 mm, and Delta4 device (ScandiDos, Sweden) was used to perform dose verification on the Varian linear accelerator. The QA plan was calculated with Eclipse (Version 13.6, Varian) and Monaco (Version 5.11.03, Elekta) treatment planning systems for 213 cases of VMAT. The dose grid was 3 mm, and the ArcCHECK device (Sun Nuclear, United States) was used to perform dose verification on the Varian and Elekta linear accelerators. The linear accelerators and the measuring devices were regularly calibrated during the measurement period to ensure that the equipment is in a good performance state.
As recommended by the American Association of Physicists in Medicine (AAPM) TG 218 report [19], the mean value of GPR was 96.2% ± 3.2% (the range was 78.8%–100%) based on the criterion of absolute dose, 3%/2 mm, global normalization, and a 10% dose threshold. For the classification model, the setting of the tolerance value of the treatment plan “pass” and “fail” affects the performance of the model [20]. In order to build a classification prediction model with better performance for the data of this institution, 99.5% of the average measured GPR, i.e. 95.7%, was used as the threshold of the GPR classification. When the GPR was greater than this threshold, the measured GPR was expressed as “pass” and recorded as “1”, otherwise, “fail” and recorded as “0”.
2.2 Feature extraction and selection
Radiomics features refer to the semi-quantitative and/or quantitative features extracted from radiography (medical images), which, combined with artificial intelligence technology, play important roles in radiotherapy [21]. The 10% isodose line of the maximum dose was included as the area where the radiomics features were extracted in this study. Batch extraction of the features was performed using the radiomics library in Python 3.7. The image types included the original image (Original), the wavelet transform image (Wavelet), and the Gaussian filter image (LoG). There were seven different types of features: shape features 2D/3D, first-order features, gray-level co-occurrence matrix (GLCM), gray-level size zone matrix (GLSZM), gray-level run length matrix (GLRLM), neighboring gray tone difference matrix (NGTDM), and gray-level dependence matrix (GLDM); altogether, 1,130 features (Original:107, Wavelet:744, and LoG:279) were extracted in total.
The whole dataset is randomly divided, with 90% of the data (368 cases) being used as the training set and 10% being used for the test set. Due to the imbalance of the data, the stratified sampling method was used, making the proportion of all kinds of data in the training set and the test sets consistent with the original data. Feature selection technology is a key link in building a machine learning prediction model based on radiomics, which can avoid high-dimensional data disaster problems, reduce the training time, increase the interpretability of the model, and enhance the prediction performance of the model [22]. In addition to interpreting the output of machine learning models, the SHAP value can also be used as a feature selection method for processing high-dimensional data [23]. In this work, the SHAP value, combined with the XGBoost algorithm, was used in feature selection.
The training set was input into the XGBoost model, and the SHAP value of each feature in the sample was subsequently calculated to measure feature importance, which was obtained by averaging the contributions in all possible per-mutations of the special collection [24]. The SHAP value of feature i was defined, as shown in Eq. 1.
where N denotes the feature sets of the original data and S represents any feature subset in N.
2.3 Model training and evaluation
Normalization was performed on the training set, and this transformation was subsequently applied to the testing set to prevent information leakage from the testing data. Four tree-based machine learning algorithms, namely, RF, AdaBoost, XGBoost, and LightGBM, were selected to fit the training data. Grid searching [25] and five-fold cross-validation were used to obtain the model with the highest performance parameters applied to the test data.
RF is a special bagging method, which finds the optimal solution among randomly selected features of a decision tree to split each node and integrates these predictions of the decision tree to avoid overfitting of the model [26]. AdaBoost is a practical boosting algorithm, which creates a highly accurate classifier by adjusting a relatively weak and inaccurate combination of weights for the same training set [27]. XGBoost is an improved algorithm based on the gradient boosted decision tree (GBDT), where the entire dataset is used to generate each decision tree and the residuals between the predicted and true results of the previous decision tree model are taken into account in the generation of the latter decision tree [28]. LightGBM mainly proposed the gradient-based one-side sampling algorithm, mutually exclusive feature binding algorithm, parallel features, and data to solve the multi-feature problem of large data encountered in practical applications [29].
The performance of the binary classification model was evaluated using precision, sensitivity, specificity, F1 score, and the area under the curve (AUC). The curve is the receiver operating characteristic curve (ROC). Precision indicates the ratio of correctly predicted positive instances to the total number of instances predicted as positive (Eq. 2). Sensitivity represents the ratio of correctly predicted positive instances to the actual number of positive instances (Eq. 3). Specificity represents the ratio of correctly predicted negative instances to the actual number of negative instances (Eq. 4). The F1 score is a measure of a model’s accuracy that takes into account both precision and recall (Eq. 5). The ROC is a curve with the false positive rate at different thresholds as the horizontal coordinate and the true rate as the vertical coordinate, and the AUC value represents the area of the region below the ROC curve. TP and FP represent the number of positive and negative samples which are predicted as positive. TN and FN represent the number of positive and negative samples which are predicted as negative. The modeling and analysis procedures were performed using Python 3.7.
3 Results
3.1 Model classification performance evaluation
Figure 1 shows the confusion matrix of the four classification prediction models. The classification performance of each model on the testing set can be calculated based on the confusion matrix, as shown in Table 1. The results show that the RF model achieves a sensitivity of 0.96, and the specificity of the XGBoost and LightGBM models was 0.62. The precision and F1 score of the XGBoost model were 0.84 and 0.88, respectively. Figure 2 shows the ROC curves of the four classification prediction models, where the AUC values of RF, AdaBoost, XGBoost, and LightGBM were 0.81, 0.77, 0.85, and 0.83, respectively.
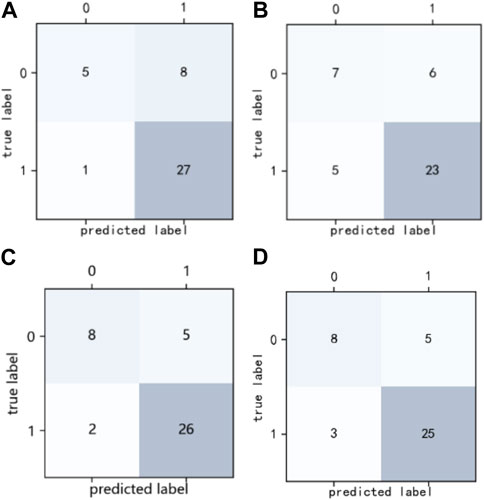
FIGURE 1. Confusion matrix of four classification prediction models. (A) RF model, (B) AdaBoost model, (C) XGBoost model, and (D) LightGBM model.
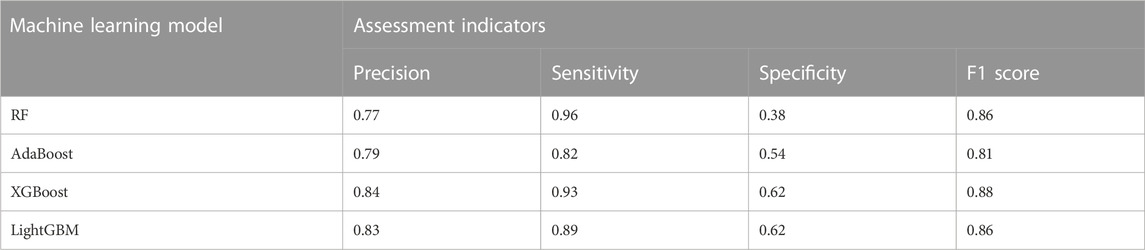
TABLE 1. Assessment of the performance of the four classification prediction models.
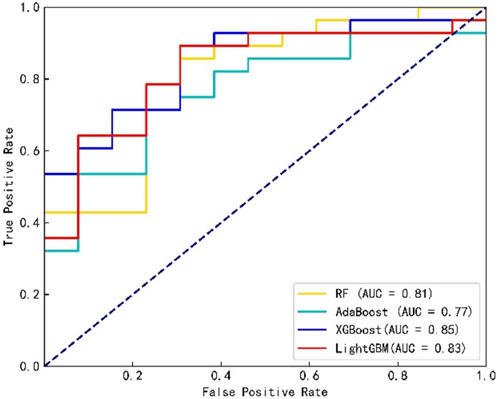
FIGURE 2. ROC curves of the four classification prediction models.
3.2 Interpretation of the model output
Figure 3 shows the SHAP summary plots for the four different models on the test set. The importance of the input features was ranked by SHAP values, where the most important features in the RF, AdaBoost, XGBoost, and LightGBM models were features 41, 19, 3, and 2, respectively. The higher the ranking of features, the greater the influence on the model output, and the overall influence of each feature on the model output can be observed. Different colors represent feature values (high values are in red, and low values are in blue), and wide areas indicate large sample clusters. As shown in Figure 3C, most of the blue points of feature 3 were distributed in regions with positive SHAP values. The lower value of feature 3 will have a positive driving effect on the model output and improve the probability of plan passing. Most of the red points in feature 1 were distributed in regions with positive SHAP values, indicating that the higher value of feature 1 increases the probability of plan passing. Table 2 shows the names of the top 10 significant features of the XGBoost model.
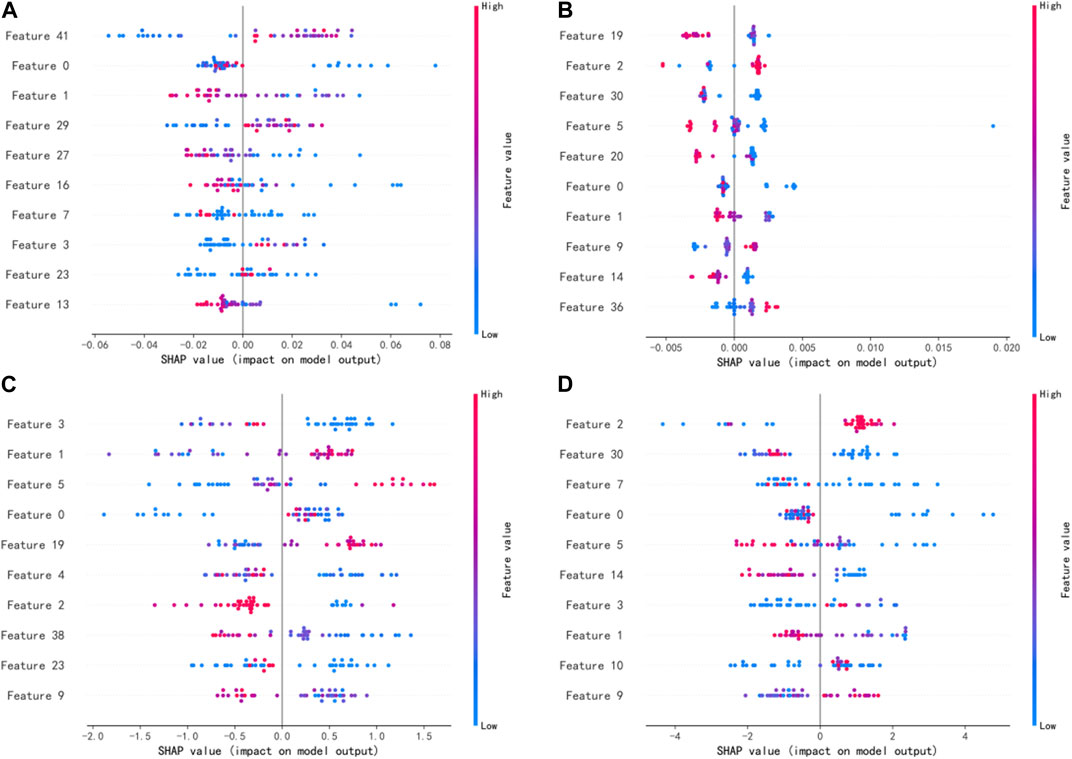
FIGURE 3. SHAP values of the four different models: (A) RF mode. (B) AdaBoost model. (C) XGBoost model. (D) LightGBM model.
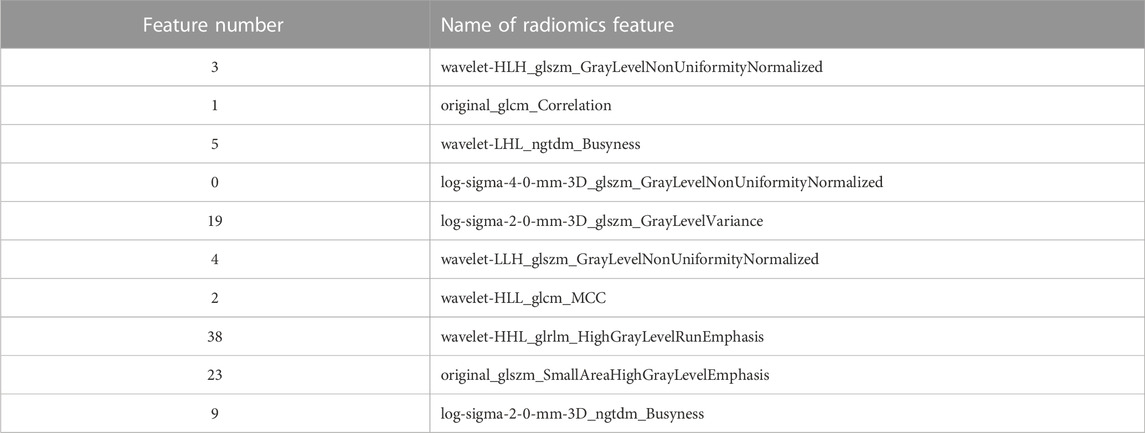
TABLE 2. Names of the top 10 important features of the XGBoost model.
The SHAP force plot for two samples under the XGBoost model is shown in Figure 4. The length of the arrow in the figure indicates the magnitude of the feature’s impact, where red represents a positive effect and blue represents a negative effect on the final output of the sample. For example, Figure 4A shows the force plot of sample 0 in the test set under the XGBoost model, demonstrating the influence of each input feature on this sample’s predicted output. The model’s base_value was 1.074, and the predicted output_value f(x) for this sample was 0.915. The difference between the total length of the red arrows and that of the blue arrows equals the distance between the base_value and the output_value. Figure 4B shows the SHAP force plot for sample 1 that has the same base_value, and its predicted output_value f(x) was −0.853.
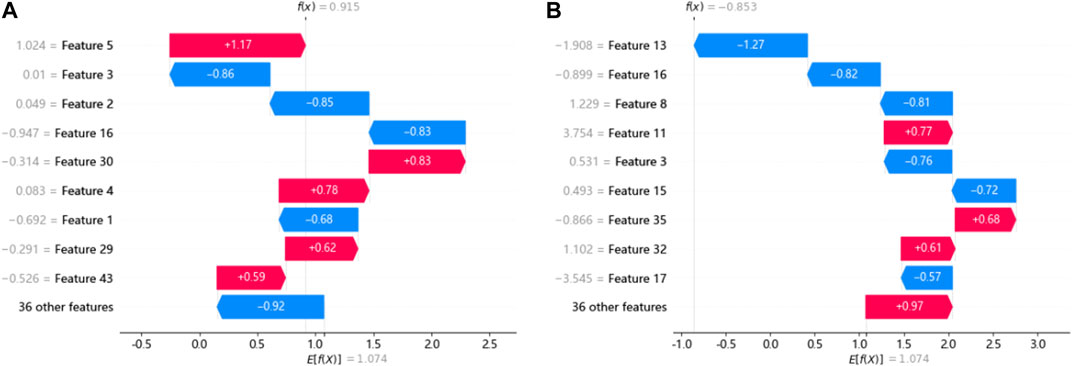
FIGURE 4. SHAP force plots for a single sample under the XGBoost model. (A) and (B) show the SHAP force plot of samples 0 and 1 in the testing set.
4 Discussion
Before treatment, implementing individualized IMRT/VMAT QA of patients is a crucial step in the clinical radiotherapy process to ensure accurate dose delivery. Establishing a GPR classification model is advantageous in aiding medical physicists to judge whether plans are “passed” or “failed” without an actual measurement, thus reducing the delay in patient treatment that may result from the failed plans. Most studies utilize machine learning models based on plan complexity parameters to predict the GPR [30]. [31] extracted radiomics features from VMAT plans of multiple sites for the first time to develop a GPR prediction model and compared it with the prediction model based on features related to plan complexity. In this study, a radiomics-based machine learning method was utilized to establish the GPR classification prediction model for IMRT combined with VMAT plans under the 3%/2 mm evaluation criterion.
The XGBoost model performed best among the four models, with the sensitivity and specificity values of 0.93 and 0.62 respectively, followed by the LightGBM model, while the AdaBoost model performed poorly. It scored the highest in precision, F1 score, and AUC value, obtaining better predictions than the model trained by [31] when the same criteria were imposed. The reason for the difference may be related not only to the inherent differences between different machine learning algorithms but also to the features selected for the calculation of SHAP value using the XGBoost algorithm [32]. As far as we know, there have been no studies on the GPR classification prediction model incorporating both IMRT and VMAT plans simultaneously. This study shows that a GPR classification prediction model incorporating IMRT and VMAT plans can be constructed using the machine learning technique based on radiomics for 3%/2 mm criteria and the specific tolerance threshold.
[33] demonstrated the rationale of using radiomics features in assessing dose verification results, where first-order features and texture features were selected as the most important features. In this study, 45 features were input into the model, including 11 first-order features and 34 texture features (GLSZM:14, GLCM:9, GLDM:5, GLRLM:4, and NGTDM:2). Among the four models, the most significant features belong to the GLSZM and GLCM categories. As shown in Figure 3, the top 10 features were ranked differently in importance among the four models due to differences in model mechanisms. Features 0 and 1 were both included in the top 10 most significant features of the four models, and features 2, 3, 5, and 9 appeared three times. It indicates that these features have a significant impact on model outputs. In contrast to previous studies, features 5 and 9 belonging to the NGTDM category were included in this study, which may be due to the patients being treated with different IMRT and VMAT technologies. In addition, five of the top 10 features belong to the GLSZM category, and the top-ranked feature 3 also belongs to the GLSZM category, indicating that the GLSZM radiomics feature is a significant indicator in this study on GPR classification prediction. The global interpretation of the XGBoost model by the SHAP value can obtain the ranking of important features and the effect distribution of the model output, while the single-sample interpretation based on the SHAP value can derive the specific effect of all input features predicting the output value in that sample. The relationship between these significant features and model output can provide a reference for medical physicists in planning and parameter optimization, which helps improve the efficiency and quality of treatment planning.
The study employed three different and unique equipment combinations, namely, Varian 600CD + Pinnacle + Delta4, Varian Trilogy + Eclipse + ArcCHECK, and Elekta Infinity + Monaco + ArcCHECK, for planning and dosimetric verification. The results indicated that the machine learning model has some universality across different equipment combinations and can serve as the basis for future GPR prediction research that involves more diverse equipment combinations. Additionally, this study is mainly a preliminary exploration of a GPR prediction model that merges different radiotherapy technologies. The data only include IMRT and VMAT plans; however, patients with the same tumor site may require different IMRT techniques to be implemented on the same or different machines. Future research will explore and verify the data on patients who receive various treatment techniques such as TOMO for a specific site. In addition, radiomics-based features of the dose distribution were input into the model. However, due to the complex relationship between radiomics features and “failed” plans, there is still a lack of direct and accurate troubleshooting methods if the result shows that the treatment plan fails in the dose verification. This study focused on GPR classification prediction for a single institution. However, multi-institutional validation is essential to promote the application of machine learning prediction models in clinical practice. [34] demonstrated the feasibility and effectiveness of establishing GPR prediction models for IMRT plans in different institutions. In the future studies, more universal and robust machine learning prediction models based on multi-center and large data will be established to promote the prospective clinical implementation and verification of virtual QA systems.
In summary, a radiomics-based machine learning technique can be used to develop a GPR classification prediction model for IMRT and VMAT plans of pelvic cases. The XGBoost model performs better in classification than the other three tree-based ensemble models, and global explanations and single-sample explanations of the model output through SHAP values may offer reference for medical physicists to provide high-quality plans, promoting the clinical application and implementation of GPR prediction models, and providing safe and efficient personalized QA management for patients.
Data availability statement
The raw data supporting the conclusion of this article will be made available by the authors, without undue reservation.
Ethics statement
This study was approved by the Hunan Cancer Hospital Ethics Committee. All methods involved in the collection of these data were performed in accordance with the relevant guidelines and regulations.
Author contributions
Concept development: QN and XY. Data analysis: QN, LC, JZ, JT, and JP. Manuscript writing: QN, LC, and XS. All authors contributed to the article and approved the submitted version.
Funding
The study was supported by the Science and Technology Innovation Program of Hunan Province (project no: 2021SK51116), the Scientific Research Plan Project of Hunan Provincial Health Commission (project nos: 202109031926 and 202218015767), and the Key Research and Development Project of Climbing Scientific Research Plan of Hunan Cancer Hospital (YF2021006).
Conflict of interest
The authors declare that the research was conducted in the absence of any commercial or financial relationships that could be construed as a potential conflict of interest.
Publisher’s note
All claims expressed in this article are solely those of the authors and do not necessarily represent those of their affiliated organizations, or those of the publisher, the editors, and the reviewers. Any product that may be evaluated in this article, or claim that may be made by its manufacturer, is not guaranteed or endorsed by the publisher.
Supplementary material
The Supplementary Material for this article can be found online at: https://www.frontiersin.org/articles/10.3389/fphy.2023.1217275/full#supplementary-material
References
1. Chandra RA, Keane FK, Voncken FEM, Thomas CR. Contemporary radiotherapy: Present and future. The Lancet (2021) 398(10295):171–84. doi:10.1016/S0140-6736(21)00233-6
2. Portelance L, Chao KSC, Grigsby PW, Bennet H, Low D. Intensity-modulated radiation therapy (IMRT) reduces small bowel, rectum, and bladder doses in patients with cervical cancer receiving pelvic and para-aortic irradiation. Int J Radiat Oncol (2001) 51(1):261–6. doi:10.1016/s0360-3016(01)01664-9
3. Ezzell GA, Galvin JM, Low D, Palta JR, Rosen I, Sharpe MB, et al. Guidance document on delivery, treatment planning, and clinical implementation of IMRT: Report of the IMRT subcommittee of the AAPM radiation therapy committee. Med Phys (2003) 30(8):2089–115. doi:10.1118/1.1591194
4. Ezzell GA, Burmeister JW, Dogan N, LoSasso TJ, Mechalakos JG, Mihailidis D, et al. IMRT commissioning: Multiple institution planning and dosimetry comparisons, a report from AAPM task group 119. Med Phys (2009) 36(11):5359–73. doi:10.1118/1.3238104
5. Siochi RAC, Molineu A, Orton CG. Patient-specific QA for IMRT should be performed using software rather than hardware methods: Point/Counterpoint. Med Phys (2013) 40:070601. doi:10.1118/1.4794929
6. Low DA, Harms WB, Mutic S, Purdy JA. A technique for the quantitative evaluation of dose distributions. Med Phys (1998) 25(5):656–61. doi:10.1118/1.598248
7. Kusunoki T, Hatanaka S, Hariu M, Kusano Y, Yoshida D, Katoh H, et al. Evaluation of prediction and classification performances in different machine learning models for patient-specific quality assurance of head-and-neck VMAT plans. Med Phys (2022) 49(1):727–41. doi:10.1002/mp.15393
8. Crowe SB, Kairn T, Kenny J, Knight RT, Hill B, Langton CM, et al. Treatment plan complexity metrics for predicting IMRT pre-treatment quality assurance results. Australas Phys Eng Sci Med (2014) 37(3):475–82. doi:10.1007/s13246-014-0274-9
9. Kalet AM, Luk SMH, Phillips MH. Radiation therapy quality assurance tasks and tools: The many roles of machine learning. Med Phys (2020) 47(5):e168–77. doi:10.1002/mp.13445
10. Chan MF, Witztum A, Valdes G. Integration of AI and machine learning in radiotherapy QA. Front Artif Intell (2020) 3:577620. doi:10.3389/frai.2020.577620
11. Valdes G, Scheuermann R, Hung CY, Olszanski A, Bellerive M, Solberg TD. A mathematical framework for virtual IMRT QA using machine learning. Med Phys (2016) 43(7):4323–34. doi:10.1118/1.4953835
12. Lam D, Zhang X, Li H, Deshan Y, Schott B, Zhao T, et al. Predicting gamma passing rates for portal dosimetry-based IMRT QA using machine learning. Med Phys (2019) 46(10):4666–75. doi:10.1002/mp.13752
13. Salari E, Shuai Xu K, Sperling NN, Parsai EI. Using machine learning to predict gamma passing rate in volumetric-modulated arc therapy treatment plans. J Appl Clin Med Phys (2023) 24(2):e13824. doi:10.1002/acm2.13824
14. Li B, Chen J, Guo W, Mao R, Zheng X, Cheng X, et al. Improvement using planomics features on prediction and classification of patient-specific quality assurance using head and neck volumetric modulated arc therapy plan. Front Neurosci (2021) 15:744296. doi:10.3389/fnins.2021.744296
15. Zhu H, Zhu Q, Wang Z, Yang B, Zhang W, Qiu J. Patient-specific quality assurance prediction models based on machine learning for novel dual-layered MLC linac. Med Phys (2023) 50(2):1205–14. doi:10.1002/mp.16091
16. Wall PDH, Fontenot JD. Application and comparison of machine learning models for predicting quality assurance outcomes in radiation therapy treatment planning. Inform Med Unlocked (2020) 18:100292. doi:10.1016/j.imu.2020.100292
17. Li J, Wang LE, Zhang X, Liu L, Jun L, Chan MF, et al. Machine learning for patient-specific quality assurance of VMAT: Prediction and classification accuracy. Int J Radiat Oncol Biol Phys (2019) 105(4):893–902. doi:10.1016/j.ijrobp.2019.07.049
18. Lundberg SM, Lee SI. A unified approach to interpreting model predictions. Proceedings of the 31st International Conference on Neural Information Processing Systems. Red Hook, NY,USA, December 2017, (2017):4768–77. doi:10.5555/3295222.3295230
19. Miften M, Olch A, Mihailidis D, Moran J, Pawlicki T, Molineu A, et al. Tolerance limits and methodologies for IMRT measurement-based verification QA: Recommendations of AAPM Task Group No. 218. Med Phys (2018) 45(4):e53–e83. doi:10.1002/mp.12810
20. Thongsawad S, Srisatit S, Fuangrod T. Predicting gamma evaluation results of patient-specific head and neck volumetric-modulated arc therapy quality assurance based on multileaf collimator patterns and fluence map features: A feasibility study. J Appl Clin Med Phys (2022) 23(7):e13622. doi:10.1002/acm2.13622
21. Arimura H, Soufi M, Kamezawa H, Ninomiya K, Yamada M. Radiomics with artificial intelligence for precision medicine in radiation therapy. J Radiat Res (2019) 60(1):150–7. doi:10.1093/jrr/rry077
22. Chandrashekar G, Sahin F. A survey on feature selection methods. Comput Electr Eng (2014) 40(1):16–28. doi:10.1016/j.compeleceng.2013.11.024
23. Marcílio WE, Eler DM. From explanations to feature selection: Assessing shap values as feature selection mechanism, Proccedings of the 2020 33rd SIBGRAPI conference on Graphics, Patterns and Images (SIBGRAPI). Porto de Galinhas, Brazil, November 2020, IEEE, (2020):340–7. doi:10.1109/SIBGRAPI51738.2020.00053
24. Nohara Y, Matsumoto K, Soejima H, Nakashima N. Explanation of machine learning models using shapley additive explanation and application for real data in hospital. Comput Meth Prog Bio (2022) 214:106584. doi:10.1016/j.cmpb.2021.106584
25. Xia Y, Liu C, Li YY, Liu N. A boosted decision tree approach using Bayesian hyper-parameter optimization for credit scoring. Expert Syst Appl (2017) 78:225–41. doi:10.1016/j.eswa.2017.02.017
27. Schapire RE. Explaining adaboost. Empirical inference. Berlin, Heidelberg: Springer (2013). p. 37–52. doi:10.1007/978-3-642-41136-6_5
28. Chen T, Guestrin C. Xgboost: A scalable tree boosting system. Proceedings of the 22nd acm sigkdd international conference on knowledge discovery and data mining. New York, NY, USA August 2016, (2016):785–94.doi:10.1145/2939672.2939785
29. Ke G, Meng Q, Finley T, et al. LightGBM: A highly efficient gradient boosting decision tree. Proceedings of the 31st International Conference on Neural Information Processing Systems. Red Hook, NY,USA, December 2017, (2017):3149–57.doi:10.5555/3294996.3295074
30. Osman AFI, Maalej NM. Applications of machine and deep learning to patient-specific IMRT/VMAT quality assurance. J Appl Clin Med Phys (2021) 22(9):20–36. doi:10.1002/acm2.13375
31. Hirashima H, Ono T, Nakamura M, Miyabe Y, Mukumoto N, Iramina H, et al. Improvement of prediction and classification performance for gamma passing rate by using plan complexity and dosiomics features. Radiat Oncol (2020) 153:250–7. doi:10.1016/j.radonc.2020.07.031
32. Liu Y, Liu Z, Luo X, Zhao H. Diagnosis of Parkinson's disease based on SHAP value feature selection. Biocybern Biomed Eng (2022) 42(3):856–69. doi:10.1016/j.bbe.2022.06.007
33. Lizar JC, Yaly CC, Bruno AC, Viani GA, Pavoni JF. Patient-specific IMRT QA verification using machine learning and gamma radiomics. Phys Med (2021) 82:100–8. doi:10.1016/j.ejmp.2021.01.071
Keywords: machine learning, intensity-modulated radiation therapy, radiomics, gamma pass rate, model interpretation
Citation: Ni Q, Zhu J, Chen L, Tan J, Pang J, Sun X and Yang X (2023) Establishment and interpretation of the gamma pass rate prediction model based on radiomics for different intensity-modulated radiotherapy techniques in the pelvis. Front. Phys. 11:1217275. doi: 10.3389/fphy.2023.1217275
Received: 05 May 2023; Accepted: 25 July 2023;
Published: 10 August 2023.
Edited by:
Guang Yang, Imperial College London, United KingdomReviewed by:
Fada Guan, Yale University, United StatesHuidong Wang, First Affiliated Hospital of Jilin University, China
Copyright © 2023 Ni, Zhu, Chen, Tan, Pang, Sun and Yang. This is an open-access article distributed under the terms of the Creative Commons Attribution License (CC BY). The use, distribution or reproduction in other forums is permitted, provided the original author(s) and the copyright owner(s) are credited and that the original publication in this journal is cited, in accordance with accepted academic practice. No use, distribution or reproduction is permitted which does not comply with these terms.
*Correspondence: Xiaohua Yang, eGlhb2h1YTE5NjNAdXNjLmVkdS5jbg==; Jun Zhu, emh1anVuQGhuY2Eub3JnLmNu