- 1Petroleum Engineering School, Southwest Petroleum University, Chengdu, China
- 2School of Public Finance and Taxation, Zhongnan University of Economics and Law, Wuhan, China
- 3Beijing Jingkong Technology Co., Ltd., Beijing, China
Carbon emissions and climate change is a significant challenge faced by the world today. The effects of climate change are felt globally, and many countries are making efforts to tackle this problem. The paper aims to analyze the carbon emissions data of 159 countries spanning from 1860 to 2016. By using the method of time-series visualization, the research aims to transform this data into complex networks to uncover any hidden information that might be useful in reducing emissions. By employing k-means, cluster analysis and other methods, we found that 1) While global carbon emissions continue to rise, there is a deceleration or reduction in carbon emissions in high-income countries. This deceleration or reduction may be attributed to factors such as policy measures and industrial shifts. 2) Additionally, our analysis highlights the significant increase in carbon emissions in certain economies that are not among the world’s leading nations in terms of overall economic size. This indicates the importance of these countries recognizing the relationship between carbon emissions and their economic development levels. 3) In addition, comparing the carbon emission levels of China and the United States, it can be found that even if the total amount of economic development is similar, their carbon emission patterns may be greatly different. Finally, we suggest that in the formulation of carbon emission policies, we should not only pay attention to the similar national models of economic development, but also take into account the actual development industry and stage of the country.
1 Introduction
Global warming has become one of the major problems of modern environmental protection, which influences things both living and inanimate [1]. The increasing greenhouse gas emissions is the main cause of global warming. In order to reduce the harm caused by greenhouse gas emissions, the Paris Agreement was adopted in 2015, which provides guidance for global action on climate change. Its overarching objective is to cap the worldwide average temperature increase at 2°C relative to pre-industrial levels, while making efforts to restrict the temperature rise to within 1.5°C. At the same time, countries all over the world have taken independent actions to achieve the low-carbon target, such as reducing carbon dioxide emissions, using clean energy, and building renewable energy. However, in some developing countries, especially those with incomplete industrialization and urbanization, urban low-carbon development is still far away. Taking China as an example, urbanization and industrialization are two pillar industries in China. And thus fuel consumption, especially coal consumption caused by thermal power stations, seriously pollutes its urban climate and environment. In India and other poorer and backward countries, the idea of environmental protection has not been deeply rooted in the hearts of the people, and the government still adheres to the path which first polluted and then governed and pursues high GDP and national development at a cost of environmental pollution, which greatly hinders the process of urban low-carbon development. The research on reducing carbon emissions is a key issue for the world. It helps to reduce the atmospheric dust pollution and the damage to mineral resources, and accelerate the research process of green energy, and thus promoting the transformation of the world economy to a green and sustainable development.
In recent years, as awareness of the detrimental effects of excessive greenhouse gas emissions has grown, along with concepts of sustainable and eco-friendly progress, researchers worldwide have become increasingly focused on the advancement of low-carbon economies and renewable energy sources. Key climate processes (particularly deep-sea warming) involve long lag times, with important greenhouse gases (especially carbon dioxide) remaining in the atmosphere for many years after they have been emitted. Climate change analysis therefore necessarily involves emissions projections that span decades, often a century or more [2]. Zhou et al. [3] analyzed the carbon emission performance through Malmquist index analysis and concluded that each country’s total factor carbon emission performance is progressively improving over the years. This is due to the continuous activities of various industries around the world, such as the well-known construction and power generation industries [4], which are regarded as industries with huge carbon emissions [5]. During the production, construction, and later operation and maintenance of building materials, a large amount of carbon emissions is generated. Many scholars’ research focuses on energy conservation and emission reduction in the construction industry [6–9]. Some industries that are traditionally difficult to pay attention to, such as reservoir construction [10] Astronomical research [11] will also make significant contributions to carbon emissions. In reference 10 [10], N. Barros et al. A large amount of terrestrial organic carbon has been found to be stored in reservoirs, leading to significant greenhouse gas emissions. The carbon emissions in the process of astronomical research are generated in related scientific experiments, global navigation for academic exchanges, and other processes [11]. A Razzaq.et al. [12] employed quarterly information spanning from the first quarter of 1995 to the fourth quarter of 2017 to investigate the influence of technological innovation and tourism growth on carbon emissions via different pathways. They proposed that, considering the long-term asymmetrical effects of tourism and technological innovation on emissions reduction, the Chinese government should enact integrated policies that combine both “tourism” and “technology”. These studies indicate that the issue of carbon emissions should attract the attention of the entire industry. In the field of reducing carbon emissions, Donald et al. [13] investigated technological innovations and policy interventions to improve energy efficiency and reduce carbon emissions in industry, construction and agriculture of different scales, and concluded that energy conservation and emission reduction can be achieved mainly through three methods: one is to improve energy efficiency in industry, construction, agriculture, transportation and other sectors; the other is to widely implement low fossil carbon renewable energy systems. Three is CCUS (carbon capture, utilization, and storage) and earth engineering plan. In addition to specific industry measures, carbon emission allocation is a strategy to reduce carbon emission from the perspective of economics and macro policies. Carbon emission allocation mechanism will have a great impact on regional development and enterprise production [14]. N. ABSI et al. [15] introduced a polynomial dynamic program with cyclical carbon emission restrictions, aiming to meet carbon emission limits via ecological constraints. After reviewing the popular allocation methods in recent years, Zhou Peng et al. [16] believe that the method using composite index can combine multiple conflicting criteria, making the allocation results more acceptable. It is evident that current studies on carbon emission reduction predominantly concentrate on two areas: lowering carbon emissions either by enhancing emission performance or altering existing emission methodologies; alternatively, by discovering new energy sources or utilizing renewable resources, among others.
Time series visualization is an approach that examines the attributes of pertinent data across time and displays them using various forms such as graphs, animations, and, etc. The data in time series are closely related to time and arranged in the order of time. The basic purposes of time series visualization involve query, prediction analysis, classification, clustering, and so on. The visualization chart includes the tree chart, heat chart, calendar chart, spiral chart, and so on. The essence of time series analysis is to compress the data. Given a time series, the data is classified and summarized by several characteristic numbers. Feature number is generally extracted from a large number of measurement samples with certain system characteristics, making it representative.
Because of the periodicity of greenhouse gas emissions, it is not rare to use time series to analyze greenhouse gas emissions. Many scholars use this method to identify factors that affect carbon emissions or analyze the characteristics of carbon emission data, for example, based on time series modeling and analysis, R. Kaufmann [17] argued that human activities have a greater impact on global surface temperature, and the rise of surface temperature changes the flow of greenhouse gases into and out of the atmosphere, causing a vicious circle. C. Shuai et al. [18] examined the influence of population, wealth, and technology on carbon emissions across 125 nations with varying income levels spanning the period from 1990 to 2011. Their results show that the key influencing factor at the global level is affluence, followed by technology and population. Zhang et al. [19] also reached similar conclusions. Sharma.et al. [20] examined economic income and carbon emission data from 69 countries over the period 1985–2005, it is concluded that GDP per capita and urbanization are the main determinants of carbon dioxide emissions in these groups of countries. Using the orthogonal GARCH (OGARCH) model, Luo et al. [21] found that carbon dioxide contributed the most to climate change from 1750 to 2005. Based on the time series method, Du et al. [22] also determined the data of 71 economies from 1996 to 2012, and investigated the impact of green technology on carbon dioxide emissions. It showed that for low-income economies, green technology innovation has no impact on the contribution to reducing carbon dioxide emissions, while for economies whose income level exceeds the threshold, it is slowing effect is significant, the result shows that factors such as forestry production, rainfall, and temperature positively impact carbon dioxide emissions. In contrast, crop production, livestock production, energy consumption, and population growth have a detrimental effect on carbon dioxide emissions.
Based on these studies, it can be seen that there is a clear correlation between economic development and carbon emissions. What are the characteristics of global time serialized data in terms of time dimension? But do countries with similar economic development also have similarities in their carbon emission patterns? This is the main purpose of our research. The goal of this research is to examine the carbon dioxide emissions of countries with different levels of the economic situation (low, middle and high-income areas) all over the world in recent decades based on time series visualization. Due to the differences in policies, and economic and social development of different countries, it is difficult to find a general improvement method to reduce the carbon emissions for all countries. Our final results indicate that there is a clear correlation between the total carbon emissions data and the level of economic development. The carbon emissions data of countries with higher economic development levels remained stable until 2005, but after 2005, the carbon emissions were surpassed by countries with medium, medium, and high levels. Therefore, the current carbon emission policies of these countries should receive more attention. In addition, even if the total economic development is at a relatively high level (such as China and the United States), there are still significant differences in studying their carbon emission patterns. Therefore, when formulating specific policies, it is not necessary to solely rely on the level of economic development as the basis for decision-making, but to conduct in-depth analysis of their industrial models, carbon emission data development, etc. Therefore, by dividing the countries into samples with different levels of income, we can put forward corresponding solutions to reduce carbon emissions according to the local conditions, and finally achieve global low carbon.
2 Preparatory knowledge
2.1 Principles of time series visualization
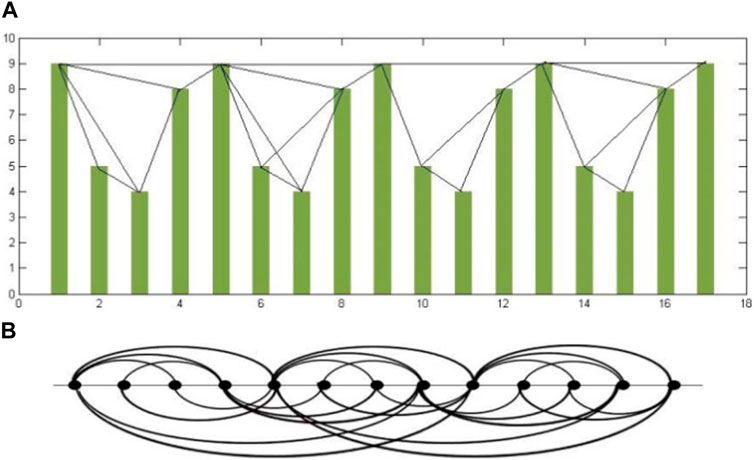
In 2008, Lacasa et al. [23] proposed a novel algorithm, known as the Visibility Graph (VG), to represent time series data through complex network structures. This mapping process is a fundamental problem in time series research. The VG algorithm builds a network using a simple principle: each node in the network symbolizes a discrete time series data point. The algorithm establishes connections between two nodes that comply with pre-set visibility rules, thus creating the network’s edges. The fundamental concept of the algorithm is depicted in Figure 1.
In the upper part of Figure 1A, twenty consecutive squares symbolize the initial 20 data points in a cyclical time series. The height of each square reflects the corresponding data value at that time point. If the top of one square is visible to the top of another, in Figure 1B, the respective points are linked in the network. Within this diagram, each node represents a data point in the time series. It is worth noting that a node cannot connect to itself, and each line of visibility must not intersect any straight bar.
Definition 2.1. principles of visualization: if any two data points
2.2 Complex network
A network is a graph that consists of nodes and edges, which can be mathematically represented as G=(N,V), where N is the set of nodes and V is the set of edges connecting the nodes. Complex networks have demonstrated their worth as analytical instruments in a multitude of domains, such as societal issues, business management studies, computational sciences, and statistical analysis. In this paper, we employ complex networks to analyze time series data by transforming it into a network. This method allows for the extraction of additional valuable information from the time series, leading to more precise analytical outcomes through the investigation of the statistical attributes of the complex network. The statistical features of such networks comprise.
1. Degree and degree distribution
Definition 2.2. Degree: In a network
Definition 2.3. Degree distribution: In a complex network
2. Average path length and network diameter
Definition 2.4. Average path length L: In a network,
Definition 2.5. Network diameter D, is the maximum value of the shortest path between any two nodes,
Definition 2.6.
2.3 K-means cluster analysis and determination of the best category
In the real world, utilizing interpretable methods for effective clustering of complex networks is an important analytical tool. For example, H.Li.et al. [24]introduced a novel clustering method called BMCL, which aims to provide a more accurate depiction of cluster architecture. However, in this paper, we utilized the widely-used clustering method K-means for our analysis. The K-means method, a prevalent partition-oriented clustering technique, splits a group of n elements into k clusters, wherein the parameter K is predetermined. The approach adopted promotes maximum homogeneity within individual clusters and enforces minimal likeness across separate clusters.
The K-means algorithm, based on a specified set of N entities, forms k partition clusters, where each partition stands for a cluster. The data is partitioned into n clusters, with every cluster containing at least one data entity, and each entity is exclusively associated with one cluster. It is important to note that entities within the same cluster exhibit high similarity, while those in different clusters demonstrate low similarity. The average value of the entities in each cluster is used to compute clustering similarity.
Regarding the operational flow of the K-means algorithm, it begins by randomly selecting k data entities, each representing a cluster center. Following that, the remaining entities are allocated to the cluster they most resemble, based on their similarity (or distance) to each cluster center. Following this, the method recalculates the average value of all elements within each group, thereby setting a fresh cluster centroid. This iterative process persists until the objective function reaches a steady state—implying that the cluster centroid does not experience substantial shifts. The criterion function usually employed is the mean square error, which aims to minimize the sum of the squared distances from each point to its nearest cluster center.
The computational steps of the K-means algorithm are as follows.
Input: Dataset D, Number of clusters K
1. Randomly select K data points from dataset D as initial centroids
2. Repeat the following steps until convergence:
2.1 Assign each data point in dataset D to the cluster represented by the nearest centroid
2.2 Update the centroids as the average of all data points in each cluster
Output: Labels indicating the cluster membership of each data point.
3 Case analysis
3.1 Global CO2 emissions analysis
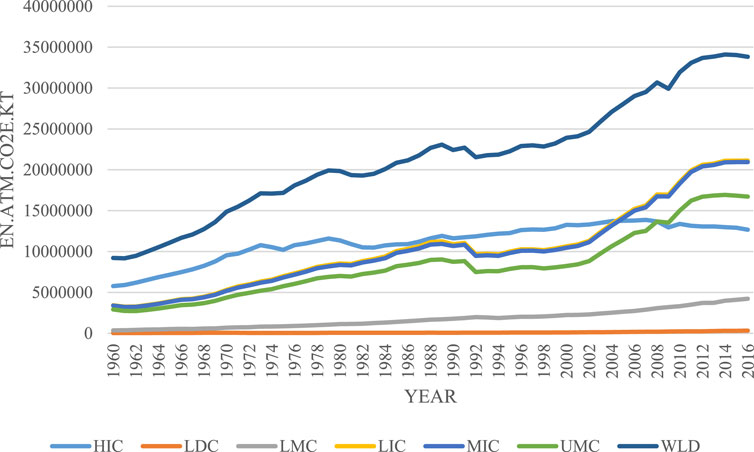
We analyzed the total carbon dioxide emissions of 159 countries and regions from 1960 to 2016. These data are from the World Bank. In 2019, the World Bank [25]categorized countries into four groups based on their economic indicators and income levels: high-income countries (HIC), upper-middle countries (UMC), lower-middle countries (LMC) and low income countries (LIC). In this paper, in order to better analyze the relationship between economic development and carbon emissions in different countries, we have referred to the United Nations’ methodology for country classification in creating these additional categories. In addition to the four categories mentioned above, we have added two additional categories: Least Developed Countries (LDC): This category includes countries with the lowest levels of socio-economic development, often facing significant challenges such as poverty, limited infrastructure, and vulnerability to environmental and climate risks. Middle-Income Countries (MIC): This category includes countries with moderate income levels, indicating a relatively higher level of economic development compared to low-income countries but not yet reaching high-income levels. The statistical characteristics and change trends of total emissions in high-income countries (HIC), least developed countries (LDC), low and middle-income countries (LMC), low-income countries (LIC), middle-income countries (MIC), middle and high-income countries (UMC) and the world (WLD) are shown in Table 1 and Figure 2.
As shown in Figure 2 and Table 1, we can find that the trend of global carbon emissions is still increasing, while carbon emissions of high-income countries are gradually slowing down in recent years, and the emissions are even gradually decreasing. The potential reasons may be as follows.
1. High-income countries pay more attention to carbon emissions. For example, Netherlands began to levy carbon tax in 1990, and the European Union is also more active in carbon tax. The carbon tax will reduce carbon emissions to a certain extent.
2. As the labor cost in developed areas is higher and the labor force is less in high-income countries, some large manufacturing enterprises will move some industries to underdeveloped countries, which will also reduce the carbon emissions in these areas;
3. The tertiary industry plays an important role in high-income countries, characterized by high added value and low energy consumption and emissions.
Although the growth trend of carbon emissions in high-income countries is slowing down or even reducing, the global carbon emissions have been increasing. Therefore, reducing carbon emissions is still an urgent matter.
3.2 Time series network construction
Based on the finite crossing level method, the time series network of carbon emissions is obtained. The flow-process diagram is shown in Figure 3.
By analyzing the structure of the visible networks of these countries, statistical indicators of these countries can be obtained, as shown in Figure 4, where Figures 4A–D represent the number of edges, average clustering coefficient, average degree, and average path length, respectively. The darker the color in the map, the larger the values of these four indicators. In complex network theory, average degree and clustering coefficient are larger, the connections between time nodes are closer; but when the average path length and network diameter are larger, the relationships between time nodes are more distant. Therefore, a comprehensive analysis is needed for the analysis of carbon emissions in these countries.
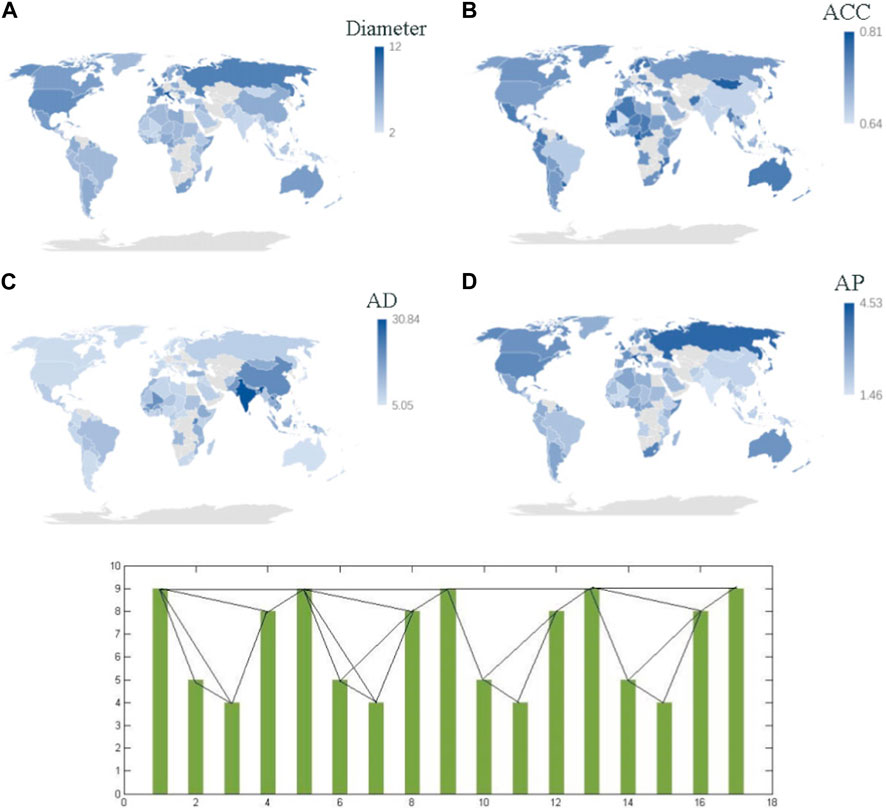
FIGURE 4. Each country CO2 statistical indicators of total emission. ACC, Average clustering coefficient; AD, Average Degree; APL, Average path length.
3.3 Cluster analysis
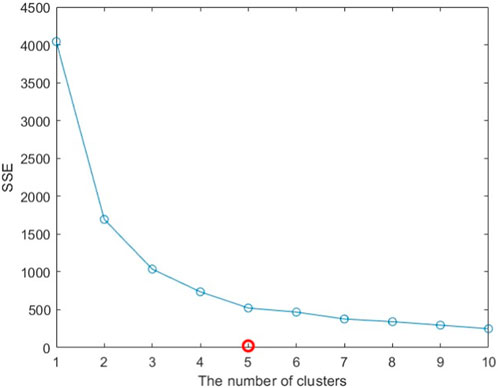
Several indexes of the network are adopted to cluster 159 countries, namely, the number of edges, the average shortest path, the average clustering coefficient, and the average degree. First, we use the elbow method to analyze the best number of clusters. According to the elbow method, in the clustered line graph, the point where the line decreases significantly slower is found by visual inspection. This point is called the “bending point”, which represents the optimal number of categories. which is displayed in Figure 5.
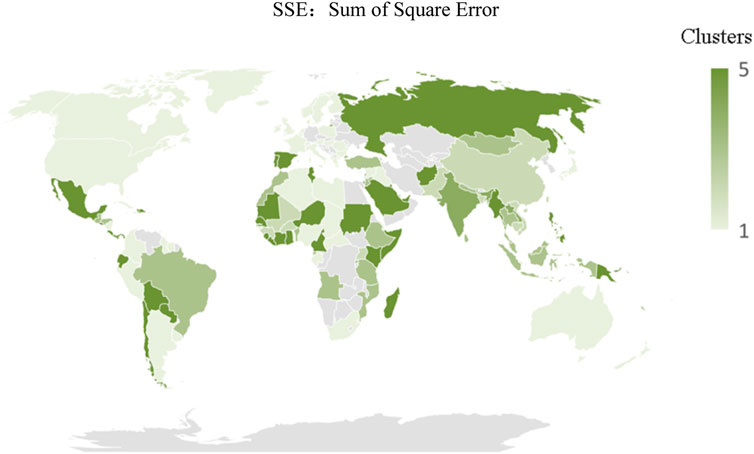
As shown in Figure 5, the best number of categories is 5 based on the elbow method. Therefore, the number of categories set for k-means clustering of carbon emission countries is 5, and the clustering results are shown in Figure 6.
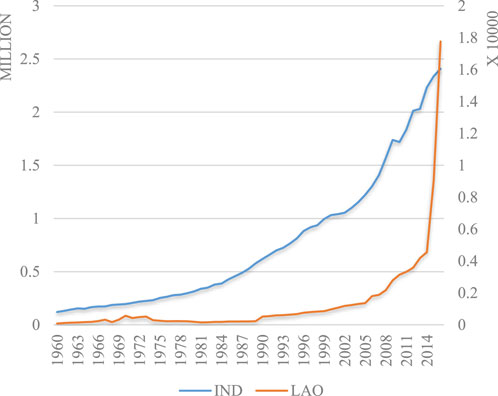
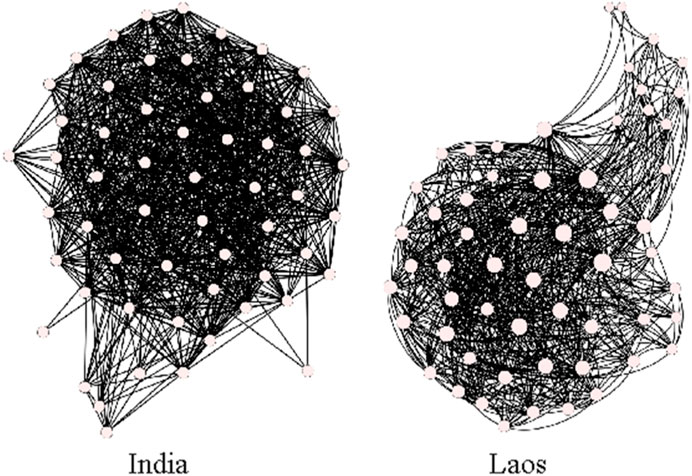
From Table 2, we find that most countries are in the first and fifth categories, but only two countries are in the fourth category, which are India and Laos. Although there are some differences in the total carbon emissions of the two countries, they show a certain similarity in the whole trend of emission change, as shown in Figures 7, 8. Carbon emission growth is slow in the early stage and increases rapidly in the late stage in the two countries. Especially in Laos, carbon emissions have increased very quickly. The results indicate that the two countries do poorly in controlling or reducing carbon emissions.
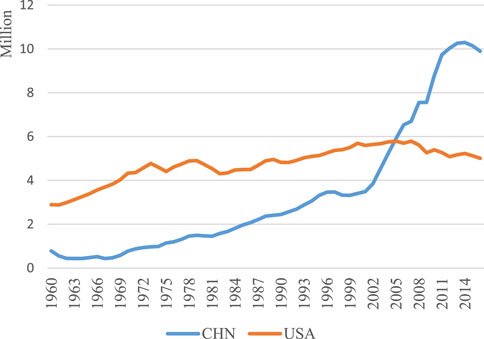
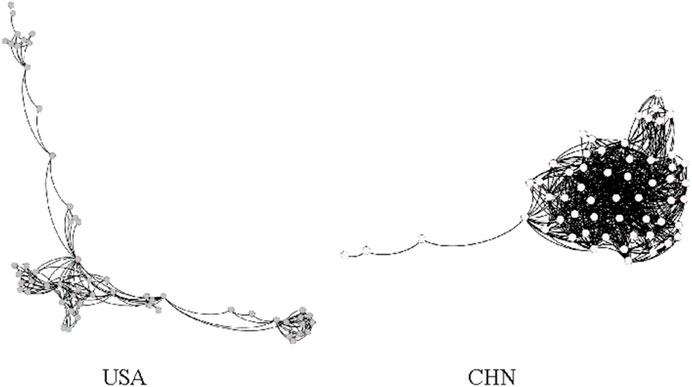
Based on the International Monetary Fund (IMF) data for the year 2022, China and the United States are the two largest economies in the world. However, we have identified significant differences in carbon emissions data between these two countries. China and the United States are not in the same category, the trends of carbon emissions are significantly different in the two countries. In Figure 9, we can find that China’s total carbon emissions are increasing in a certain period of time. However, since 2015, the amount of carbon emissions has begun to decrease, which indicates that China has begun to pay attention to the problem of carbon emissions and began to formulate corresponding policies to reduce carbon emissions. The carbon emissions are relatively steady in the United States, which suggests the efforts in reducing carbon emissions. In Figure 10, We can more intuitively find that there are huge differences in the network structure after Data and information visualization of carbon emissions between China and the United States. This demonstrates that although countries may have similar levels of economic development in terms of overall magnitude, the differences in carbon emissions are markedly different due to variations in development patterns. Therefore, specific carbon emissions policies need to be formulated based on classifying emission patterns, and development policies among similar emission patterns can provide valuable insights for policy-making.
4 Conclusion
This paper focuses on global carbon emission and analyzes the trends in countries with different income levels. It is shown that the time series of carbon emissions do not follow a random walk but have the rule of long memory. The long memory effect makes the future trend of carbon emission change tend to be the same as that of the past. The analysis of carbon emissions reveals that Laos and India have experienced a rapid increase in carbon emissions in recent years. Such countries should prioritize the issue of carbon emissions. When formulating carbon emissions policies, it is important not to rely solely on the stage of economic development as a reference factor. Due to different specific patterns of economic development and influences from factors such as industrial distribution, countries with similar levels of economic development may exhibit significant differences in carbon emissions. Therefore, specific considerations should be taken into account to develop policies that align with each country’s goals in reducing carbon emissions.
Data availability statement
The original contributions presented in the study are included in the article/Supplementary material, further inquiries can be directed to the corresponding author.
Author contributions
XL: Visualization, Software, Computation, Drawing and Writing. MZ: Investigation, Visualization, Software. QM: Conceptualization, Methodology, Validation, Writing-Reviewing and Editing. All authors contributed to the article and approved the submitted version.
Conflict of interest
Author QM was employed by the company Beijing Jingkong Technology Co., Ltd.
The remaining authors declare that the research was conducted in the absence of any commercial or financial relationships that could be construed as a potential conflict of interest.
Publisher’s note
All claims expressed in this article are solely those of the authors and do not necessarily represent those of their affiliated organizations, or those of the publisher, the editors and the reviewers. Any product that may be evaluated in this article, or claim that may be made by its manufacturer, is not guaranteed or endorsed by the publisher.
References
1. Kerr RA. Global warming is changing the world. Science (2007) 316(5822):188–90. doi:10.1126/science.316.5822.188
2. Schmalensee R, Stoker TM, Judson RA. World carbon dioxide emissions: 1950–2050. Rev Econ Stat (1998) 80(1):15–27. doi:10.1162/003465398557294
3. Zhou P, Ang B, Han J. Total factor carbon emission performance: A malmquist index analysis. Energ Econ (2010) 32(1):194–201. doi:10.1016/j.eneco.2009.10.003
4. Sims RE, Rogner H-H, Gregory K. Carbon emission and mitigation cost comparisons between fossil fuel, nuclear and renewable energy resources for electricity generation. Energy policy (2003) 31(13):1315–26. doi:10.1016/s0301-4215(02)00192-1
5. Ahmed Ali K, Ahmad MI, Yusup Y. Issues, impacts, and mitigations of carbon dioxide emissions in the building sector. Sustainability (2020) 12(18):7427. doi:10.3390/su12187427
6. Price L, Levine MD, Zhou N, Fridley D, Aden N, Lu H, et al. Assessment of China's energy-saving and emission-reduction accomplishments and opportunities during the 11th Five Year Plan. Energy policy (2011) 39(4):2165–78. doi:10.1016/j.enpol.2011.02.006
7. Zhong Z, Zhang X, Yang X. Benefit evaluation of energy-saving and emission reduction in construction industry based on rough set theory. Ecol Chem Eng S (2021) 28(1):61–73. doi:10.2478/eces-2021-0006
8. Lin B, Liu H. China's building energy efficiency and urbanization. Energy and Buildings (2015) 86:356–65. doi:10.1016/j.enbuild.2014.09.069
9. Liu Y, Guo W. Effects of energy conservation and emission reduction on energy efficiency retrofit for existing residence: A case from China. Energy and Buildings (2013) 61:61–72. doi:10.1016/j.enbuild.2013.01.033
10. Barros N, Cole JJ, Tranvik LJ, Prairie YT, Bastviken D, Huszar VL, et al. Carbon emission from hydroelectric reservoirs linked to reservoir age and latitude. Nat Geosci (2011) 4(9):593–6. doi:10.1038/ngeo1211
11. Stevens AR, Moss VA. Driving action on the climate crisis through astronomers for planet earth and beyond (2023). arXiv preprint arXiv:230305259.
12. Razzaq A, Sharif A, Ahmad P, Jermsittiparsert K. Asymmetric role of tourism development and technology innovation on carbon dioxide emission reduction in the Chinese economy: fresh insights from QARDL approach. Sustain Develop (2021) 29(1):176–93. doi:10.1002/sd.2139
13. Huisingh D, Zhang Z, Moore JC, Qiao Q, Li Q. Recent advances in carbon emissions reduction: policies, technologies, monitoring, assessment and modeling. J Clean Prod (2015) 103:1–12. doi:10.1016/j.jclepro.2015.04.098
14. Cai W, Ye P. A more scientific allocation scheme of carbon dioxide emissions allowances: the case from China. J Clean Prod (2019) 215:903–12. doi:10.1016/j.jclepro.2019.01.043
15. Absi N, Dauzère-Pérès S, Kedad-Sidhoum S, Penz B, Rapine C. Lot sizing with carbon emission constraints. Eur J Oper Res (2013) 227(1):55–61. doi:10.1016/j.ejor.2012.11.044
16. Zhou P, Wang M. Carbon dioxide emissions allocation: A review. Ecol Econ (2016) 125:47–59. doi:10.1016/j.ecolecon.2016.03.001
17. Kaufmann RK, Stern DI. Evidence for human influence on climate from hemispheric temperature relations. Nature (1997) 388(6637):39–44. doi:10.1038/40332
18. Shuai C, Shen L, Jiao L, Wu Y, Tan Y. Identifying key impact factors on carbon emission: evidences from panel and time-series data of 125 countries from 1990 to 2011. Appl Energ (2017) 187:310–25. doi:10.1016/j.apenergy.2016.11.029
19. Zhang X, Wang Y. How to reduce household carbon emissions: A review of experience and policy design considerations. Energy Policy (2017) 102:116–24. doi:10.1016/j.enpol.2016.12.010
20. Sharma SS. Determinants of carbon dioxide emissions: empirical evidence from 69 countries. Appl Energ (2011) 88(1):376–82. doi:10.1016/j.apenergy.2010.07.022
21. Luo C, Wu D. Environment and economic risk: an analysis of carbon emission market and portfolio management. Environ Res (2016) 149:297–301. doi:10.1016/j.envres.2016.02.007
22. Du K, Li P, Yan Z. Do green technology innovations contribute to carbon dioxide emission reduction? Empirical evidence from patent data. Technol Forecast Soc Change (2019) 146:297–303. doi:10.1016/j.techfore.2019.06.010
23. Lacasa L, Luque B, Ballesteros F, Luque J, Nuno JC. From time series to complex networks: the visibility graph. Proc Natl Acad Sci (2008) 105(13):4972–5. doi:10.1073/pnas.0709247105
24. Li H, Xu W, Qiu C, Pei J. Fast markov clustering algorithm based on belief dynamics. IEEE Trans Cybernetics (2023) 53(6):3716–25. doi:10.1109/TCYB.2022.3141598
25.The World Bank. Classifying countries by income (2019). Available at: https://datatopics.worldbank.org/world-development-indicators/stories/the-classification-of-countries-by-income.html.2019.
Keywords: time series visualization principle, complex network, carbon dioxide emissions, kmeans, cluster analysis
Citation: Liu X, Zhao M and Miao Q (2023) Global carbon dioxide emissions analysis based on time series visualization. Front. Phys. 11:1201983. doi: 10.3389/fphy.2023.1201983
Received: 07 April 2023; Accepted: 31 July 2023;
Published: 25 August 2023.
Edited by:
Hui-Jia Li, Beijing University of Posts and Telecommunications (BUPT), ChinaReviewed by:
Jinlong Ma, Hebei University of Science and Technology, ChinaYuhao Feng, Beijing University of Posts and Telecommunications (BUPT), China
Copyright © 2023 Liu, Zhao and Miao. This is an open-access article distributed under the terms of the Creative Commons Attribution License (CC BY). The use, distribution or reproduction in other forums is permitted, provided the original author(s) and the copyright owner(s) are credited and that the original publication in this journal is cited, in accordance with accepted academic practice. No use, distribution or reproduction is permitted which does not comply with these terms.
*Correspondence: Qinghong Miao, bWlhb3FoXzExMDFAMTYzLmNvbQ==; Meilin Zhao, MjAyMDIxMDcwMDMxQHN0dS56dWVsLmVkdS5jbg==
 Xuanyu Liu1
 Qinghong Miao