- 1Institute of Electronic and Electrical Engineering, Civil Aviation Flight University of China, Guanghan, China
- 2School of Computer Science, Sichuan University, Chengdu, China
- 3College of Aviation Engineering, Civil Aviation Flight University of China, Guanghan, China
- 4College of Flight Technology, Civil Aviation Flight University of China, Guanghan, China
An improved algorithm has been proposed to address the challenges encountered in object detection using visible and thermal infrared images. These challenges include the diversity of object detection perspectives, deformation of the object, occlusion, illumination, and detection of small objects. The proposed algorithm introduces the concept of contrastive learning into the YOLOv5 object detection network. To extract image features for contrastive loss calculation, object and background image regions are randomly cropped from image samples. The contrastive loss is then integrated into the YOLOv5 network, and the combined loss function of both object detection and contrastive learning is used to optimize the network parameters. By utilizing the strategy of contrastive learning, the distinction between the background and the object in the feature space is improved, leading to enhanced object detection performance of the YOLOv5 network. The proposed algorithm has shown pleasing detection results in both visible and thermal infrared images.
1 Introduction
Object detection is a crucial area of research in computer vision [1–4] that aims to identify and localize objects in an image, including both detection and recognition [5–7]. This technology has become increasingly important in various domains of our daily lives, such as autonomous driving, robotics, and video surveillance.
Currently, deep learning has made significant strides in scientific research, particularly in the field of object detection, where convolutional neural networks (CNNs) have been extensively used and have achieved remarkable results [8-12]. Object detection techniques can be classified into two categories: one-stage object detection algorithms based on boundary box regression and two-stage object detection algorithms based on the candidate region. One-stage object detection algorithms typically use a boundary box to localize objects in an image and then implement classification regression, as exemplified by the YOLO series algorithm [13, 14], SSD algorithm [15], RetinaNet algorithm [16], etc. The two-stage object detection is carried out based on the candidate regions of the image feature extraction and object classification regression, such as R-CNN [17], Fast R-CNN [18], and Faster R-CNN [19]. At present, these classical supervised learning object detection algorithms have achieved promising performance.
Despite the impressive progress made by the supervised object detection, there are still many challenges, including object perspective diversity, deformation, occlusion detection, illumination, and small object detection, which can make it challenging to extract useful image features [20]. To overcome these challenges, we propose an improved object detection algorithm based on YOLOv5 and contrastive learning [21–24]. The basic idea of contrastive learning is to train a network by comparing the similarity between images based on the images themselves. This idea is consistent with the process of differentiating objects from the background during object detection. The YOLO-series algorithms are renowned for their high detection speed and excellent performance. Our proposed algorithm introduces the concept of contrastive learning into the YOLOv5 object detection network, using a supervised training strategy. The goal is to increase the distance between the object and background samples in the feature space, thereby enhancing the detection performance of the model, as illustrated in Figure 1.
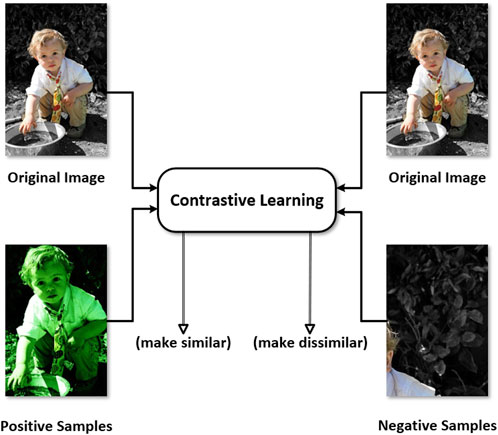
FIGURE 1. Contrastive learning makes the same objects (positive samples) similar in the feature space, and makes the object and background (negative samples) dissimilar in the feature space.
It is worth noting that the proposed improved YOLOv5 algorithm in this paper is specifically designed to enhance object detection in both visible and infrared thermal images [21–25]. Some of the visible light and infrared thermal images are shown in Figure 2. This is particularly crucial in night monitoring scenarios where infrared thermal imaging plays a crucial role in pedestrian detection, forest fire detection, maritime rescue, public security reconnaissance, etc [26]. The proposed method is expected to address challenges such as light source interference, air humidity, occlusion, and other factors that affect object detection accuracy in infrared thermal images [27]. By implementing this improved algorithm, a significant enhancement in the detection accuracy of infrared thermal images is expected.

FIGURE 2. Some of the visible light images and infrared thermal images. Images in the first row are the visible light images, and images in the second row are the infrared thermal images.
2 Materials and methods
2.1 Image preprocessing
We propose utilizing contrastive learning to improve the distinction between the background and object in the feature space. Given an image, we perform random cropping to obtain the object and background regions. The object region image serves as positive samples, while the background region image serves as negative samples. In this process, we first identify the object’s center point coordinates and then capture a 64 × 64 image block randomly using these coordinates as the standard. If the captured image block contains more than half of the object area, it is considered a positive sample and represented by a green box in Figure 3. Conversely, if the captured image block contains less than half of the object area, it is considered a negative sample or background image and represented by a yellow box in Figure 3.
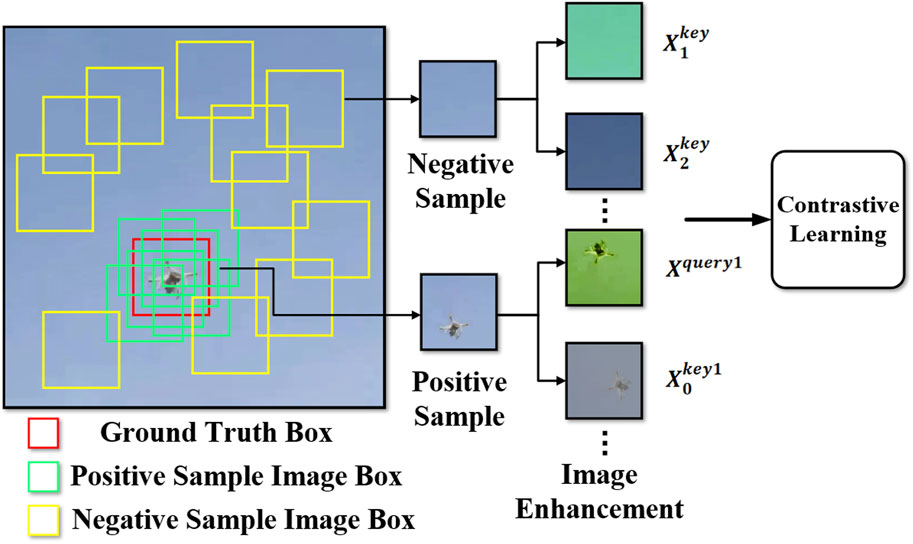
FIGURE 3. Image preprocessing and feature extraction for the positive and negative samples. Then, the generated positive and negative samples are input into the contrastive learning network to calculate the contrastive loss.
Once we obtain the positive and negative samples through random cropping, we perform image enhancement. Essentially, we derive different images from the same original image while maintaining its content. However, the derived images have variations in size, scale, brightness, color, and other characteristics. In this paper, we use various image enhancement methods such as cropping, rotation, color adjustment, scale adjustment, and illumination adjustment. Each operation is randomly combined to generate diverse images.
In Figure 3, after enhancing the object image, different views generate Xquery1 and
2.2 Overall network structure
The overall network structure contains two types of network structures, i.e., the YOLOv5 network structure and the contrastive learning network structure, as shown in Figure 4. The YOLOv5 network structure and the contrastive learning network structure encoder are both composed of several convolution layers, pooling layers, and fully connected layers. The YOLOv5 network structure is mainly divided into four parts: input, backbone, neck, and prediction.
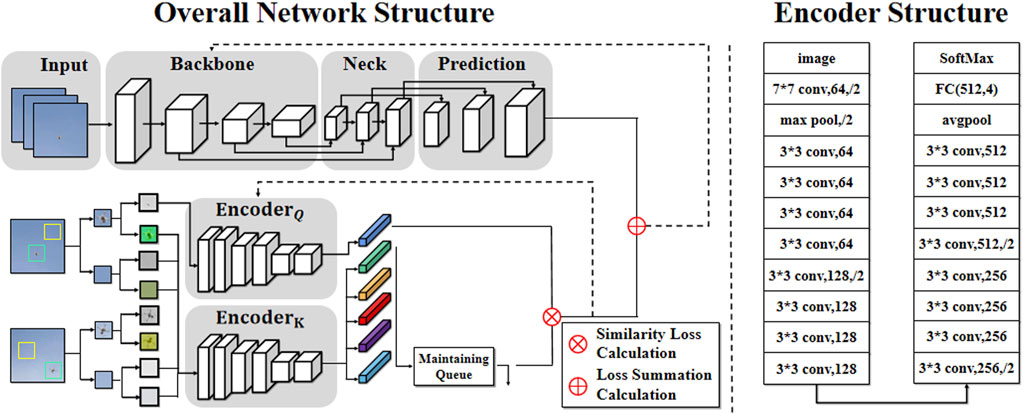
FIGURE 4. Overall network structure of the proposed method. The left part represents the improved YOLOv5 algorithm, and the right part represents the encoder network structure of contrastive learning.
We use the MoCo contrastive learning network to participate in the improvement of the YOLOv5 network architecture. The MoCo network structure includes three modules: image enhancement, feature extraction, and loss calculation. In the image enhancement phase, the images are randomly enhanced, including cropping, rotation, color adjustment, scale adjustment, and illumination adjustment. The images in the datasets can be randomly combined with various enhancement methods, and then, the pictures Xquery and
We use a ResNet-style module as the encoder to extract image features, as depicted in Figure 5. The input is an image with a resolution of 1 × 64 × 64 pixels, followed by convolution and pooling operations. The size of the spatiotemporal kernel (depth, height, and width) of the convolution layer is [7, 7, and 7], the step size is 2, and the filling size is 3. The pooling layer utilizes a 3 × 3 maximum pooling operation with a step size of 2 and padding of 1. The resulting feature map is then fed into a residual block with 64 channels. Subsequently, the feature map undergoes four consecutive convolution operations with a spatial kernel size of [3, 3, and 3], a stride of 1, and padding of 1, resulting in a feature map size of 64 × 16 × 16. As the channel size is 64, the residuals are connected via solid lines at this stage. One side of the feature map is then up-sampled and down-sampled to obtain a size of 128 × 8 × 8, followed by four convolution operations on the other side. The first convolution layer has a spatial kernel size of [3, 3, and 3], a stride of 2, and padding of 1, while the last three convolution layers have a spatial kernel size of [3, 3, and 3], a stride of 1, and padding of 1. The feature map after the convolution operation is then added to the up-sampled feature map to obtain a feature map size of 128 × 8 × 8.
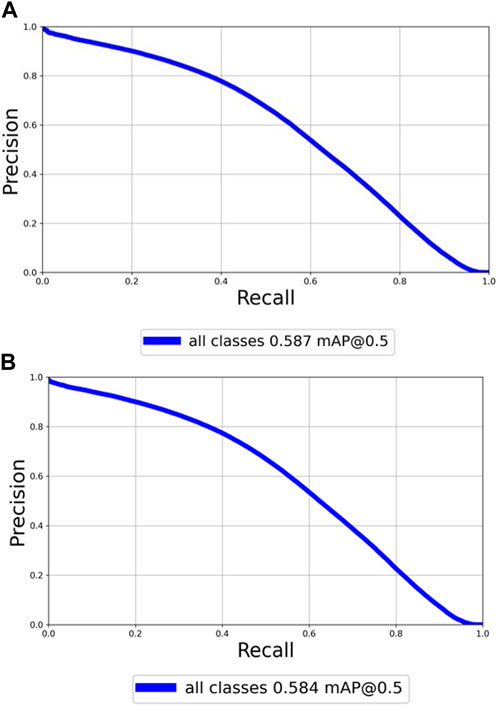
FIGURE 5. P-R curve for the improved and original YOLOv5 networks on the experiment of COCO2017 datasets, respectively. (A) P-R curve for the improved YOLOv5 network. (B) P-R curve for the original YOLOv5 network.
2.3 Loss function
The YOLOv5 loss function is composed of three parts, i.e., Lossbox (rectangular frame loss), Lossconf (confidence loss), and Losscls (classification loss). The rectangular frame loss function calculates the discrepancy between the predicted frame and the object label frame, while the confidence loss function determines the level of certainty of a given predicted frame. Lastly, the classification loss function evaluates the model’s ability to correctly identify the object category. The overall loss function of YOLOv5 is obtained by taking a weighted sum of these three individual losses as follows:
The contrastive loss is defined by the following equation:
where q represents the feature extracted by the query encoder from the object image, ki represents the feature extracted by the momentum encoder, k+ represents the feature of the positive sample (assuming there is only one), and τ is used as a hyper-parameter to adjust the aforementioned contrastive loss.
After the contrastive loss of positive samples and negative samples is calculated, the next step is to calculate the cross entropy loss function. It is worth noting that the contrastive loss of positive samples and negative samples is taken as loss samples to calculate the cross entropy loss function, whose calculation formula is defined by the following equation:
where n represents the number of samples between positive and negative samples, Li represents the ith expected contrastive loss, and
The aforementioned equation is the overall optimization object function for the proposed method, where LossYOLO represents the YOLOv5 object detection loss and LossCL represents the contrastive learning loss.
3 Results
The PyTorch deep learning framework is used in the experiment. The CUDA version used is 11.3. YOLOv5 confidence loss weight α is set to 0.4, and the rectangular frame loss and classification loss weights β and γ are both set to 0.3 The network training utilized asynchronous random gradient descent with a momentum term of 0.973. The initial learning rate for weight is set to 0.01, and the attenuation coefficient is set to 0.0005. A batch size of 128 is used, and a total of 200 batches were trained. In the global loss function, the weight ξ of the YOLOv5 loss function is set to 1, and the weight λ of the contrastive learning loss function is set to 0.001.
3.1 Experiment on the COCO2017 dataset
The MS COCO dataset is used for the evaluation of our method. This dataset is funded and annotated by Microsoft; it is a large-scale dataset that can be utilized for image detection, semantic segmentation, and image captioning. It consists of over 330,000 images, out of which 220,000 are annotated, containing 1.5 million objects and 80 object categories, such as pedestrians, cars, and elephants. Additionally, it includes 91 material categories such as grass, walls, and sky. Each image in the dataset is accompanied by five descriptive sentences, and there are 250,000 pedestrians with key points available for analysis.
In the first experiment, we select the COCO2017 dataset as the experimental dataset. Specifically, 118,287 images are chosen as the training set, 40,670 images are chosen as the testing data, and 5,000 sets are chosen as the validation set while keeping their original label files intact. The datasets are divided into training, validation, and testing sets in the ratio of 118,287:40,670:5,000. It is ensured that the training and test sets are independent of each other during the experiment. Finally, the dataset is fed into the improved YOLOv5 network for training.
The performance of the model is evaluated using precision P), recall(R), average precision (AP), and mean average precision (mAP) for all categories of AP values. The calculation formula for each index is as follows:
where TP is the true case, FP is the false case, FN is the missed case, M is the total number of samples, and N is the number of categories. To create a P-R curve, we will use the recall rate as the horizontal axis and the precision rate as the vertical axis. The area under this curve is known as the average precision (AP) value. This experiment is focused on 80 classes, so N = 80 and the mAP value is equal to the average sum of the AP values of 80 classes. The detection accuracy of the improved YOLOv5 network is compared with that of the original YOLOv5 network, and the detection performance of the network before and after the improvement is analyzed.
After feeding the COCO2017 dataset into both the YOLOv5 network and the improved YOLOv5 network for training 200 epochs, the loss function begins to converge. Figure 5A displays the P-R curve for the improved YOLOv5 network. On the other hand, Figure 5B shows the P-R curve for the original YOLOv5 network. In addition, the precision, recall, and mAP data pairs of the two models are shown in Table 1. mAP50 indicates the mAP of the IOU between the preselection box and the groundtruth box is greater than 0.5, and mAP50−95 indicates the mAP of the IOU between the preselection box and the groundtruth box is between 0.5 and 0.95.

TABLE 1. Comparison results between the improved YOLOv5 and the original YOLOv5 algorithms on the COCO2017 dataset.
From Table 1, we can see that the precision value of the original YOLOv5 model is 0.719, while the precision value of our model is 0.724, an increase of 0.005. The recall value of the original YOLOv5 model is 0.526, while the recall value of our model is 0.527, an increase of 0.001. The mAP50 value of the original YOLOv5 model is 58.4%, while that of our model is 58.7%, an increase of 0.3%. The mAP50−95 value of the original YOLOv5 model is 36.9%, while that of our model is 37.2%, an increase of 0.3%. As observed from Figure 5 and Table 1, the improved algorithm in this study outperforms the original algorithm on the COCO datasets. Figure 6 displays the detection results of the improved YOLOv5 and the original YOLOv5 algorithms.

FIGURE 6. Detection results by the improved YOLOv5 and original YOLOv5 algorithms on the COCO2017 dataset. The upper layer is the detection result of the original YOLOv5 algorithm, and the lower layer is the detection result of the improved YOLOv5 algorithm. It is worth noting that the fourth image is the detection result for small objects, which shows that the method used in this article is also applicable for detecting small objects.
3.2 Experiment on the LLVIP datasets
To validate the accuracy of the improved YOLOv5 object detection network for infrared thermal imaging, we apply the algorithm to infrared images using the LLVIP dataset. This dataset consists of 15,488 pairs of infrared images captured in 26 real-time scenes, with a majority of them taken in low-light conditions using a wavelength band of 8–14 μm. In the experiment, we select 100 images successively from 18 scenes in the original LLVIP dataset, resulting in a total of 1,800 images as the training sets. We also select 50 images successively from four scenes in the original LLVIP dataset, resulting in a total of 200 images as the testing and validation sets. The evaluation metrics, precision P), recall(R), and mean average precision (mAP) of all categories of AP values are used to evaluate the performance of the model.
After training the LLVIP datasets on both the YOLOv5 network and the improved YOLOv5 network for up to 100 epochs, the loss function starts to converge. Figure 7A displays the P-R curve for the improved YOLOv5 network after the loss function has converged. Meanwhile, Figure 7B shows the P-R curve for the original YOLOv5 network after the loss function has converged.
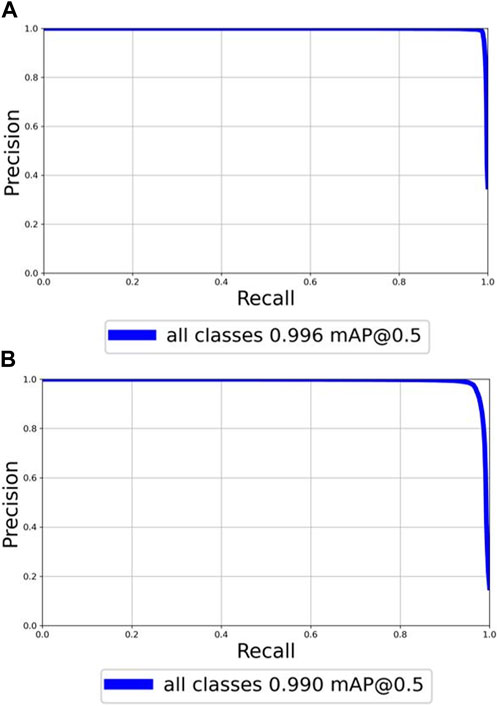
FIGURE 7. P-R curve for the improved and original YOLOv5 networks on the experiment of LLVIP datasets. (A) P-R curve for the improved YOLOv5 network. (B) P-R curve for the original YOLOv5 network.
From Table 2, we can see that the precision value of the original YOLOv5 model is 0.989, while the precision value of our model is 0.994, an increase of 0.005. The recall value of the original YOLOv5 model is 0.970, while the recall value of our model is 0.983, an increase of 0.013. The mAP50 value of the original YOLOv5 model is 99.0%, while that of our model is 99.6%, an increase of 0.6%. The mAP50−95 value of the original YOLOv5 model is 74.7%, while that of our model is 76.0%, an increase of 1.3%. The detection results of the improved YOLOv5 and the original YOLOv5 algorithms can be viewed in Figure 8A and Figure 8B, respectively.

TABLE 2. Comparison results between the improved YOLOv5 and the original YOLOv5 algorithms on the LLVIP dataset.
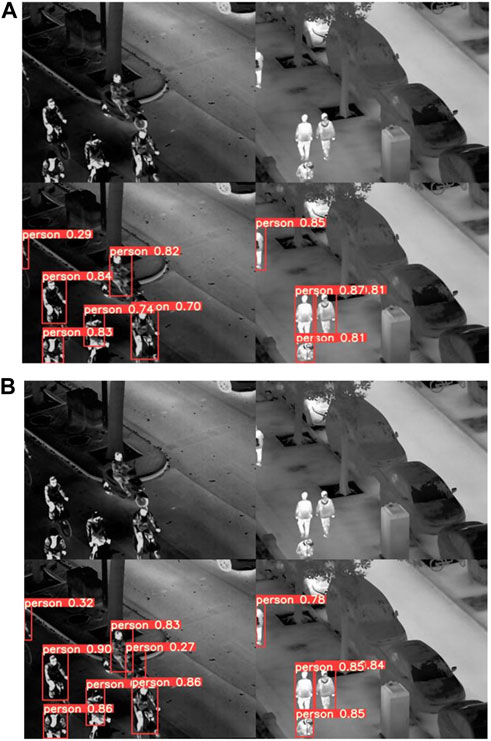
FIGURE 8. Detection results by the improved YOLOv5 and original YOLOv5 algorithms on the LLVIP datasets. (A) Detection results by the improved YOLOv5 algorithm. (B) Detection results by the original YOLOv5 algorithm.
3.3 Comparison with other algorithms
In order to further prove the effectiveness of our improved YOLOv5 algorithm, this paper conducted experimental comparisons with several current mainstream object detection algorithms, including YOLOv3, SSD, Faster R-CNN, mask R-CNN, and R-FCN. We unified the configuration environment and initial training parameters in all experiments; the experimental data are the same as that of the experiment, MS COCO dataset. The dataset is still guaranteed to include 118,287 training sets, 40,670 testing sets, and 5,000 verification sets. The experimental data results are shown in Table 3.
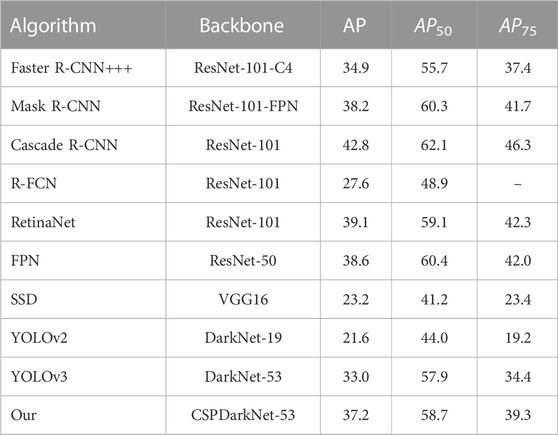
TABLE 3. Comparison results between various classical object detection algorithms and our improved YOLOv5 algorithm on the MS COCO dataset.
In Table 3, we assess the accuracy of the frame regression task. The accuracy of the frame is generally measured by the intersection ratio (IOU), AP represents the IOU interval of 0.5 up to 0.95, after the average is taken. AP50 represents that the IOU value is 0.5, then taking the average value. AP75 represents that the IOU value is 0.75, then taking the average value. Table 3 indicates that when the same datasets are input into our improved YOLOv5 algorithm and the other mainstream object detection algorithms, the various AP values of our improved YOLOv5 algorithm are all improved. These findings verify the effectiveness of our improved YOLOv5 algorithm in object detection tasks.
4 Discussion
4.1 Previous research on object detection
Object detection is a fundamental task in computer vision that involves identifying the presence of objects and their location in images or videos. Over the years, there have been many advances in object detection algorithms, resulting in two main categories: two-stage algorithms, such as R-CNN [17], Fast R-CNN [18], and Faster R-CNN [19], and one-stage algorithms, such as SSD [15] and YOLO series [13, 14]. Although R-CNN represented a significant improvement over traditional algorithms, its candidate area box calculation in the CNN led to increased computation, significantly affecting the test speed. Fast R-CNN reduced computation but still could not achieve true real-time performance or end-to-end training and testing. Therefore, Faster R-CNN is proposed to integrate feature extraction, candidate box selection, classification, and boundary box regression into a single framework, improving accuracy and speed, and achieving end-to-end object detection. However, there is still a gap between real-time object detection and Faster R-CNN, leading to the emergence of one-stage algorithms such as SSD and YOLO. Although the YOLO series solved object detection as a regression problem, it suffered from a positioning error compared to Faster R-CNN. YOLOv2 improved the original algorithm while maintaining its speed advantage, while YOLOv3 used a deep residual network to extract image features. The YOLOv5 algorithm is the latest version and has a streamlined architecture and improved performance on object detection tasks, achieving good detection speed and accuracy by adopting adaptive anchor box computing and the multi-semantic fusion detection mechanism to quickly and effectively integrate high-level semantic information and low-level location information.
4.2 Discussion on the proposed method
In this paper, we propose an improved object detection algorithm by integrating contrastive learning into the YOLOv5 network, to further improve the performance of current object detection methods. Even there are many ready-made contrastive learning methods such as SimCLR [28], MoCo [29], BYOL [30], SwAV [31], and SimSiam [32], we use MoCo as the contrastive learning structure to build our model since MoCo is one of the best contrastive learning networks at present and it is relatively simple to be implemented. By simultaneously constraining the object detection loss and contrastive loss, our method can compact the distribution of similar objects in the feature space and enlarge the distribution distance between the object and the background in the feature space, thereby enhancing the distinction between the object and the background. Experimental results on COCO and LLVIP datasets demonstrate that our proposed method outperforms the original YOLOv5 network in terms of object detection performance in both visible and thermal infrared images. Moreover, our proposed method is a general framework as the contrastive learning mechanism can be applied not only to the YOLOv5 object detection model but also to other deep learning-based object detection methods, such as the Faster R-CNN series, SSD, and SPP-Net.
Data availability statement
Publicly available datasets were analyzed in this study. These data can be found at: MS COCO Datasets: https://cocodataset.org/#download and LLVIP Datasets: https://bupt-ai-cz.github.io/LLVIP.
Author contributions
XT: conceptualization, methodology, software, investigation, formal analysis, and writing—original draft; ZY: data curation and writing—original draft; BL: visualization and investigation; JL: resources and supervision; YH: software and validation; HH: visualization. All authors contributed to the article and approved the submitted version.
Funding
This work was supported in part by the Science and Technology Department in the Sichuan Province of China under grant no. 2022JDRC0076, in part by the China Postdoctoral Science Foundation under grant no. 2022M722248, in part by the Project of Basic Scientific Research of Central Universities of China under grant nos. ZHMH2022-004 and J2022-025, in part by the Open Fund of Key Laboratory of Flight Techniques and Flight Safety, CAAC (grant no. FZ2022KF06), and in part by the Fund of Key Laboratory of Flight Techniques and Flight Safety, CAAC (grant no. FZ2021ZZ05).
Conflict of interest
The authors declare that the research was conducted in the absence of any commercial or financial relationships that could be construed as a potential conflict of interest.
Publisher’s note
All claims expressed in this article are solely those of the authors and do not necessarily represent those of their affiliated organizations, or those of the publisher, the editors, and the reviewers. Any product that may be evaluated in this article, or claim that may be made by its manufacturer, is not guaranteed or endorsed by the publisher.
References
1. Everingham M, Van Gool L, Williamsc K, Winn J, Zisserman A. The pascal visual object classes (VOC) challenge. Int J Comp Vis (2010) 88(2):303–38. doi:10.1007/s11263-009-0275-4
2. Girshick R, Donahue J, Darrell T, Malik J. Rich feature hierarchies for accurate object detection and semantic segmentation. In: Proceedings of the IEEE Conference on Computer Vision and Pattern Recognition; June 2014; Columbus, OH, USA. IEEE (2014). p. 580–7.
3. Xia GS, Bai X, Ding J, Zhu Z, Belongie S, Luo J, et al. DOTA:A large scale dataset for object detection in aerial images[C]. Proceedings of the IEEE Conference on Computer Vision and Pattern Recognition. IEEE (2018). p. 3974–83.
4. Liu B, Pang J, Tu X. Design and calibration test of a support force measuring system for hypersonic vehicle aerodynamic measurement. Flow Meas Instrumentation (2022) 88:102264. doi:10.1016/j.flowmeasinst.2022.102264
5. Tan M, Le Q. Efficientnet: Rethinking model scaling for convolutional neural networks [C]. In: Proceedings of the International conference on machine learning; Long Beach, California. PMLR (2019). p. 6105–14.
6. Liu J, Wu Z, Liu J, Tu X. Distributed location-aware task offloading in multi-UAVs enabled edge computing. IEEE Access (2022) 10:72416–28. doi:10.1109/access.2022.3189682
7. Tu X, Zhao J, Liu Q, Ai W, Guo G, Li Z, et al. Joint face image restoration and frontalization for recognition. IEEE Trans Circuits Syst Video Tech (2021) 32(3):1285–98. doi:10.1109/TCSVT.2021.3078517
8. Sun FW, Li CY, Xie YQ, Li ZB, Yang CD, Qi J Review of deep learning applied to occluded object detection. J Front Comp Sci Tech (2022) 16(6):1243–59.
9. Tu X, Zhao J, Xie M, Jiang Z, Luo Y, Zhao Y, et al. 3D face reconstruction from a single image assisted by 2D face images in the wild. IEEE Trans Multimedia (2020) 23:1160–72. doi:10.1109/TMM.2020.2993962
10. He K, Zhang X, Ren S, Sun J. Deep residual learning for image recognition. In: Proceedings of the IEEE confer ence on computer vision and pattern recognition; June 2016; Las Vegas, NV, USA. IEEE (2016). p. 770–8.
11. Tu X, Zou Y, Zhao J, Ai W, Dong J, Yao Y, et al. Image-to-video generation via 3D facial dynamics. IEEE Trans Circuits Syst Video Tech (2021) 32(4):1805–19.
12. Liu J, Shi X, Liu J, Tu X, Wu Z. Novel trust scheme applicable to edge computing. Authorea Preprints (2022).
13. Sruthi MS, Poovathingal MJ, Nandana VN, Lakshimi S, Samshad M, Sudeesh V. YOLOv5 based open-source UAV for human detection during search and rescue (SAR). In: Proceedings of the 10th International Conference on 13 Advances in Computing and Communications; October 2021; Kochi. IEEE (2021). p. 1–6.
14. Zhu XK, yu LSC, Wang X, Zhao Q. TPH-YOLOv5: Improved YOLOv5 based on transformer prediction head for object detection on drone-captured scenarios. In: Proceedings of the IEEE International Conference on Computer Vision; October 2021; Montreal, BC, Canada. IEEE (2021). p. 2778–88.
15. Liu W, Anguelov D, Erhan D, Szegedy C, Reed S, Fu C, et al. Ssd: Single shot MultiBox detector. In: Proceedings of the 14th European Conference on Computer Vision; Amsterdam. Springer (2016). p. 21–37.
16. Lin TY, Goyal P, Girshick R, He K, Dollar P. Focal loss for dense object detection. In: Proceedings of the 2017 IEEE International Conference on Computer Vision; Venice. IEEE (2017). p. 2999–3007.
17. Chen C, Liu MY, Tuzel O, Xia J. R-CNN for small object detection. In: Asian conference on computer vision. Cham: Springer (2016). p. 214–30.
18. Girshick R. Fast R-CNN. In: Proceedings of the 2015 IEEE International Conference on Computer Vision (ICCV); December 2015; Santiago. IEEE (2015). p. 1440–8.
19. Ren SQ, He KM, Girshick R, Sun J. Faster R-CNN: Towards real-time object detection with region proposal networks. In: Proceedings of the 28th International Conference on Neural Information Processing Systems; Montreal. MIT Press (2015). p. 91–9.
20. Han J, Ding J, Xue N, Xia G. Redet: A rotation-equivariant detector for aerial object detection[C]. In: Proceedings of the IEEE/CVF Conference on Computer Vision and Pattern Recognition (2021). p. 2786–95.
21. Huang Z, Wang J, Fu X, Yu T, Guo Y, Wang R. DC-SPP-YOLO: Dense connection and spatial pyramid pooling based YOLO for object detection. Inf Sci (2020) 522:241–58. doi:10.1016/j.ins.2020.02.067
22. Wu W, Li Q. Machine vision inspection of electrical connectors based on improved yolo v3. IEEE Access (2020) 8:166184–96. doi:10.1109/access.2020.3022405
23. Liu G, Nouaze JC, Touko PL, Kim J. YOLO-tomato: A robust algorithm for tomato detection based on YOLOv3. Sensors (2020) 20(7):2145.1–2145.20. doi:10.3390/s20072145
24. Huang Y, Tu X, Fu G, Liu T, Liu B, Yang M, et al. Low-light image enhancement by learning contrastive representations in spatial and frequency domains (2023). arXiv preprint arXiv:2303.13412.
25. Hsu WY, Lin WY. Ratio-and-Scale-Aware YOLO for pedestrian detection. IEEE Trans Image Process (2020) 30:934–47. doi:10.1109/TIP.2020.3039574
26. Wang H, Li H, Zhou H, Chen X. Low-altitude infrared small target detection based on fully convolutional regression network and graph matching. Infrared Phys Tech (2021) 115:103738. doi:10.1016/j.infrared.2021.103738
27. Dai Y, Wu Y, Zhou F, Barnard K. Attentional local contrast networks for infrared small target detection. IEEE Trans-actions Geosci Remote Sensing (2021) 59(11):9813–24. doi:10.1109/tgrs.2020.3044958
28. Chen T, Kornblith S, Norouzi M, Hinton G. A simple framework for contrastive learning of visual representations. In: Proceedings of the 37th International Conference on Machine Learning. PMLR (2020). p. 1597–607.
29. He KM, Fan HQ, Wu YX, Xie S, Girshick R. Momentum contrast for unsupervised visual representation learning. In: Proceedings of 2020 IEEE/CVF Conference on Computer Vision and Pattern Recognition; Seattle. IEEE (2020). p. 9726–35.
30. Grill JB, Strub F, Altché F, Tallec C, Richemond PH, Buchatskaya E, et al. Bootstrap your own latent a new approach to self-supervised learning. In: Proceedings of the 34th International Conference on Neural Information Processing Systems (NIPS); Vancouver, Canada. Curran Associates Inc (2020). p. 21271–84.
31. Caron M, Misra I, Mairal J, Goyal P, Bojanowski P, Joulin A. Unsupervised learning of visual features by contrasting cluster assignments. In: Proceedings of the 34th International Confer ence on Neural Information Processing Systems; Vancouver, Canada. Curran Associates Inc (2020). p. 9912–24.
Keywords: deep learning, YOLOv5, object detection, contrastive learning, infrared thermal image
Citation: Tu X, Yuan Z, Liu B, Liu J, Hu Y, Hua H and Wei L (2023) An improved YOLOv5 for object detection in visible and thermal infrared images based on contrastive learning. Front. Phys. 11:1193245. doi: 10.3389/fphy.2023.1193245
Received: 24 March 2023; Accepted: 21 April 2023;
Published: 11 May 2023.
Edited by:
Xiaoqiang Zhang, Beihang University, ChinaReviewed by:
Yingtian Zou, National University of Singapore, SingaporeZun Li, Beijing University of Technology, China
Copyright © 2023 Tu, Yuan, Liu, Liu, Hu, Hua and Wei. This is an open-access article distributed under the terms of the Creative Commons Attribution License (CC BY). The use, distribution or reproduction in other forums is permitted, provided the original author(s) and the copyright owner(s) are credited and that the original publication in this journal is cited, in accordance with accepted academic practice. No use, distribution or reproduction is permitted which does not comply with these terms.
*Correspondence: Xiaoguang Tu, eGd1YW5ndHVAb3V0bG9vay5jb20=
 Xiaoguang Tu
 Zihao Yuan
 Bokai Liu3