- 1Medical College of Fujian Medical University, Fujian Provincial Hospital South Branch, Fuzhou, Fujian, China
- 2Key Laboratory of Optoelectronic Science and Technology for Medicine, Ministry of Education, Fujian Provincial Key Laboratory of Photonics Technology, Fujian Provincial Engineering Technology Research Center of Photoelectric Sensing Application, College of Photonic and Electronic Engineering, Fujian Normal University, Fuzhou, Fujian, China
- 3Clinical Medical College of Fujian Medical University, Fujian Provincial Hospital, Fuzhou, Fujian, China
Introduction: Polarization-sensitive optical coherence tomography (PS-OCT) is a functional extension of standard OCT. PS-OCT systems can be generally categorized into two categories based on the number of input polarization states on the sample: multi-input polarization state (multi-IPS) and single IPS. In addition, each category includes two configurations: fiber-based system and bulk optics-based system. However, there are complex and time-consuming steps to calibrate the polarization states of light among the reference, the sample, and detection arms for fiber-based system. And it is not compact and robust enough for bulk optics-based system.
Methods: In the modified SD PS-OCT system with structural symmetry in both arms of the reference and sample, there are no bulk polarization optical elements in both arms of the reference and the sample. A circularly polarized light was used to incident on sample, and Stokes vector of backscattered light was employed to characterize the birefringence of biological tissues based on the quaternion approach, which directly establishes the relationship between Stokes vectors of backscattered light and Jones matrix of the sample.
Results and discussion: The new algorithm provides the analytic solution of retardance and fast-axis orientation. To evaluate the performance of the developed system, an eighth-wave plate is used. Then, the polarization properties of the myocardial tissue in vivo are quantitatively reconstructed based on the quaternion approach. The results demonstrated that the proposed method has an advantage over Jones formalism based on a single input state and two polarization input states. In the future, the modified SD PS-OCT could be improved as a common path SD PS-OCT for clinical applications.
1 Introduction
Polarization-sensitive optical coherence tomography (PS-OCT) is a functional extension of standard OCT, which was first developed for one-dimensional measurements in 1992 [1]. Since then, PS-OCT has made significant progress for three-dimensional (3D) imaging with high speed and sensitivity [2–4]. The extracted information based on PS-OCT includes cumulative or local phase retardation, birefringent axis orientation [5–8], degree of polarization uniformity (DOPU) [9, 10], and uniformity of the birefringent optic axis [11–13].
PS-OCT systems can be generally categorized into two categories based on the number of input polarization states on the sample: multi-input polarization state (multi-IPS) and single IPS. In addition, each category includes two configurations: fiber-based system and bulk optics-based system. Fiber-based PS-OCT, including polarization-maintaining fiber (PMF) [14–17] and single-mode fiber (SMF) [4, 18–20], offers the advantages such as easy alignment, compact size, and robustness compared to bulk optics-based PS-OCT for clinical application. However, there are complex and time-consuming steps to calibrate the polarization states of light among the reference, the sample, and detection arms for SMF-based PS-OCT due to the random change in the polarization properties of the SMF. In PMF-based PS-OCT, ghost images were caused by the cross-talk between the orthogonal polarization channels of the PMF.
In bulk optics-based PS-OCT, a well-defined polarization state of light illuminated both the reference mirror and the sample, and the state is maintained throughout the PS-OCT setup [21–23]. The extracted sample birefringence does not need any calibration, and it is simpler and quicker than that in fiber-based PS-OCT. However, it is not compact and robust enough for clinical diagnosis since different polarization states of light are observed in the reference and sample arms.
In the Fourier domain OCT, including spectral domain (SD) OCT [24, 25] and swept source (SS) OCT [26, 27], a common beam path for the reference and sample arms was used for a simpler and more compact configuration [28], which increases the OCT system’s physical stability and optical phase sensitivity [29]. However, the sample and reference arms cannot share a common optical path in PS-OCT because the reflected light from the reference mirror is 45° linearly polarized light, which is different from that of the incident light for the sample.
In this work, the same circular polarized light was applied for both the reference and sample arms in the modified SD PS-OCT, and there are no bulk polarization optical elements in both arms, which can be modified as the common path. In the modified SD PS-OCT, the theoretical algorithm of the extracted birefringence is different from that of the traditional PS-OCT with 45° linearly polarized light. Furthermore, a new algorithm combining Stokes vector with the quaternion approach is introduced to provide birefringence of the sample, which provides an analytic solution for retardance and fast-axis orientation.
2 Materials and methods
2.1 Theoretical analysis
Light is a transverse wave and is assumed to propagate in the z-direction, and the polarization state of light can be described by the Jones vector, which can be described as follows [30]:
where angular frequency
When the circular polarized light irradiates the sample, the corresponding Jones vector of the backscattered light beam from the sample is calculated as follows:
The output Stokes vector Sout can be calculated by using
Quaternion, a convenient mathematical tool, was introduced by Richartz and Hsu [32] for representation of a polarization state of light and birefringence of samples [33, 34]. The quaternion descriptions for the Stokes vector of backscattered light in PS-OCT can be expressed as follows:
where
where
Therefore, when the input polarization state is known, the output polarization state can be used to contrast the birefringent properties of the tissue sample with high efficiency.
When the normalized circular polarized light irradiated on the birefringent sample, the Stokes quaternion of the backscattered light can be obtained as follows:
The aforementioned Stoke vector of the backscattered light from the sample based on Eq. 4 is the same to Eq. 8 based on a quaternion approach, which demonstrates that the transmission of the Stoke vector of backscattered light from the sample can be established with the Jones matrix based on the quaternion approach.
Based on the aforementioned equation,
The aforementioned equation shows that the quaternion simplified the algorithm for extracting the birefringence of the sample using the modified PS-OCT.
2.2 SD PS-OCT system
A sketch of the modified SD PS-OCT system is shown in Figure 1. The light source is a 12-mW PM-coupled superluminescent diode (SLD) with an FWHM bandwidth of 85 nm centered at 1,310 nm (S5FC1021P, Thorlabs), which results in the axial resolution of 8.9 µm in free space [35]. A polarization state generator based on magneto-optic polarization rotators was employed to obtain circularly polarization states of irradiated light, in which the measurements are independent of the sample axis rotation in the plane perpendicular to the sample beam. The circularly polarized light passes through a non-polarizing beam splitter (NBS) and is split into two beams. One goes to the reference arm and the other goes to the sample arm. Thus, the polarization states in the reference and sample arms are both circular, and the symmetry between them is good without using the additional quarter-wave plate (QWP), which can be improved as the common path PS-OCT in the following work. A galvo-scanning mirror (GVS002, Thorlabs) and an achromatic focusing lens with a focal length of 50 mm (AC254-050-C-ML, Thorlabs) form the scanning structure. The lateral resolution is deduced to 18.2 μm theoretically [35]. A total of 400 A-scan OCT signals are acquired, in increments of 25 μm of the position of the light beam, over the width of 10 mm. The backscattered polarized light from the sample and the reflected light from the reference arm interfere at the NBS. After passing through PBS, it is divided into horizontal linear and vertical linear interference components, which are detected by two spectrometers (C-1235-1385, Wasatch Photonics). The interference signals recorded at the two instruments were processed using traditional SD OCT data processing, including subtraction of an averaged spectrum, rescaling of spectra from wavelength to wavenumber space, numerical dispersion compensation, and Hilbert transform and Fourier transform.
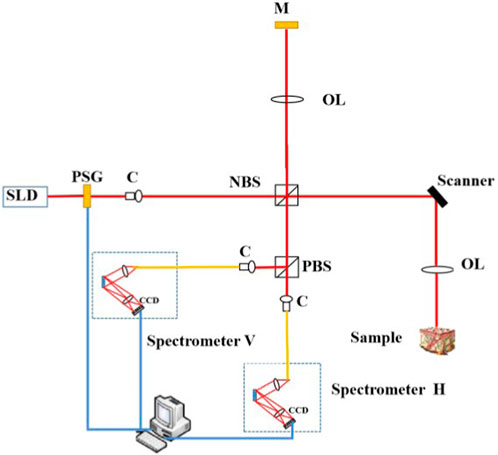
FIGURE 1. Sketch of our SD PS-OCT system. SLD, superluminescent diode; C, collimator; PSG, polarization state generator; NBS, non-polarization beam splitter; OL, objective lens; M, mirror; and PBS, polarization beam splitter.
2.3 Samples
To evaluate the quantitative measurement performance of the system, healthy male Sprague–Dawley rats (National Rodent Laboratory Animal Resources, Shanghai Branch) were employed for SD PS-OCT of myocardial tissues. These Sprague–Dawley rats, weighing 250–300 g, were anesthetized using 3–4 mL/Kg 10% chloral hydrate. The rats underwent open heart surgeries. Then, the rats remained under anesthesia and SD PS-OCT was used to image the myocardial tissue in the left ventricle anterior wall. This study was performed in accordance with the protocol approved by the Animal Ethical and Welfare Committee (AEWC) (NO. IACUC-20180018) in Fujian Normal University.
3 Results and discussion
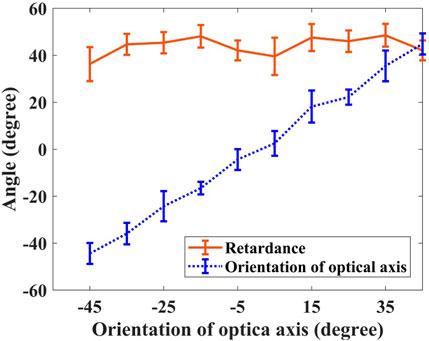
To evaluate our method, we used an eighth-wave plate in front of a mirror as the sample, with the wave plate from −45° to 45° in step of 10°. Figure 2 demonstrated the measured phase retardance at approximately 45° at all orientations of the optical axis, whose value is 45° in theory for the eighth-wave plate, and the measured orientation of the optical axis increased with the increasing orientation of the eighth-wave plate.
The Stokes vector of the myocardial tissue in vivo was reconstructed, as shown in Figure 3. Figure 3A shows that there is no band structure of s0 in the logarithmic grayscale range. s0 is related to the backscattered intensity summed over both polarization channels. Figures 3B–D demonstrate
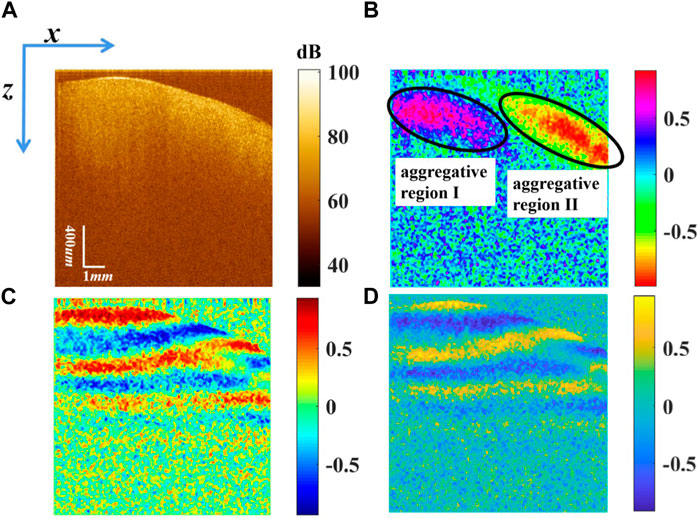
FIGURE 3. Stokes vectors (A) s0 displayed in logarithmic scale, (B)
Figure 4A demonstrates the cumulative phase retardance
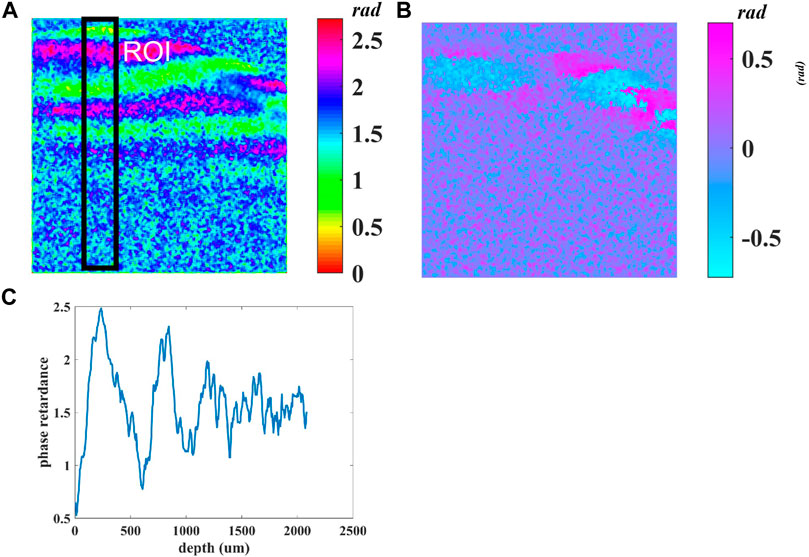
FIGURE 4. (A) Cumulative phase retardance
The Jones matrix can describe the complete polarization properties of the sample, except the depolarizing feature, and includes four complex numbers in general. The algorithms based on Jones formalism to determine the Jones matrix require the use of at least two different polarization states in the sample and/or the reference arm [7, 12, 22, 33, 37, 38], and the birefringence can be easily derived by minimizing the off-diagonal elements or performing an eigenvalue and eigenvector decomposition of this matrix [31]. The four Jones matrix elements are determined by the Jones vector of the backscattered light [
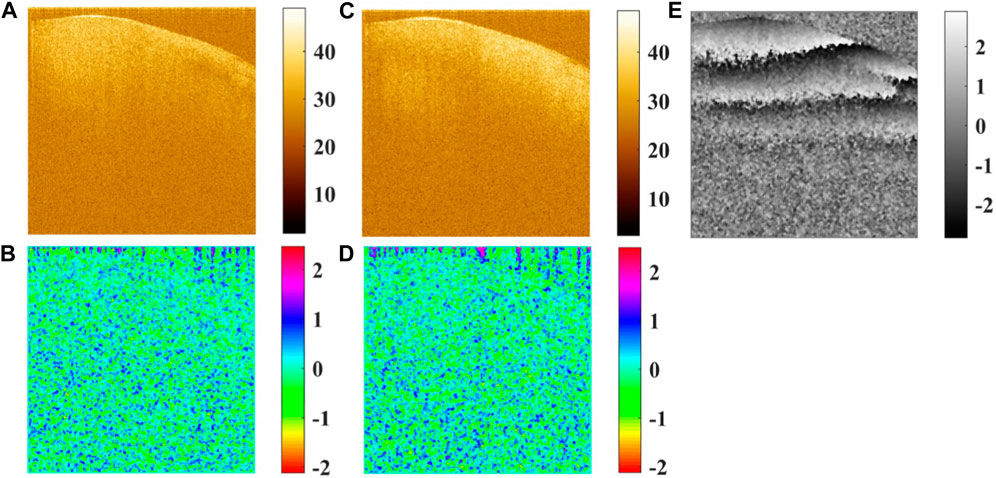
FIGURE 5. (A) Amplitude of Ex in the logarithmic scale, (B) phase of Ex, (C) amplitude of Ey in the logarithmic scale, (D) phase of Ey, and (E) phase difference between Ex and Ey.
Additionally, the Jones vectors
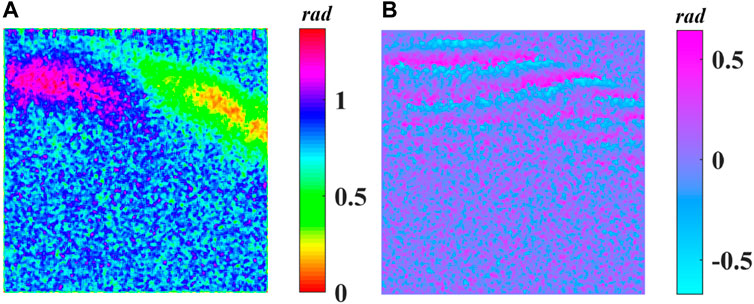
FIGURE 6. (A) Cumulative phase retardance
In this study, the backscattered light is given by Eq. 3, in which
The completely polarization properties contain birefringence, dichroism, optical rotation, and depolarization. Depolarization cannot be detected due to the coherent detection in OCT, and optical rotation cannot be detected in the round-trip optical path in OCT. Thus, birefringence, including retardance and optical axis, is the main polarization property for biological tissue based on PS-OCT. Furthermore, the scattering properties of the sample can be measured based on the depth-dependent s0 component of Stokes vector since the s0 component is the intensity of backscattered light.
It is known that the bulk optics-based PS-OCT system is difficult to be used in practical clinical application due to the relatively large size. In this study, there are no bulk polarization optical elements in both the sample and reference arms, the symmetry between which is good. Thus, our SD PS-OCT can be improved as the common path SD PS-OCT, which can reduce the system’s size and is beneficial for clinical applications.
4 Conclusion
In this study, a modified SD-PS-OCT system combined with a quaternion approach is presented for determination of birefringence of biological tissues. In the modified SD PS-OCT system with structural symmetry in both arms of the reference and sample, the Stokes vector of backscattered light was employed to characterize the birefringence of biological tissues based on the quaternion approach, which directly establishes the relationship between Stokes vectors of backscattered light and Jones matrix of the sample. The new algorithm provides the analytic solution of retardance and fast-axis orientation. To evaluate the performance of the developed system, an eighth-wave plate is used. Then, the polarization properties of the myocardial tissue in vivo are quantitatively reconstructed based on the quaternion approach. The results demonstrated that the proposed method has an advantage over Jones formalism based on a single input state and two polarization input states. In the future, the modified SD PS-OCT could be improved as a common path SD PS-OCT for clinical applications.
Data availability statement
The original contributions presented in the study are included in the article/Supplementary Material. Further inquiries can be directed to the corresponding authors.
Ethics statement
The animal study was reviewed and approved by the Animal Ethical and Welfare Committee (AEWC) (NO. IACUC-20180018) in Fujian Normal University.
Author contributions
QK, RC, and ZL contributed to conception and design of the study. QK, KL, and WW performed the experiments. ZL, WL, and HC performed the theoretical analysis. QK wrote the first draft of the manuscript. ZL and KL wrote sections of the manuscript. All authors contributed to manuscript revision, read, and approved the submitted version.
Funding
This work was supported by the National Natural Science Foundation of China (61875038), Natural Science Foundation of Fujian Province (2022J01995/2020I0013), and Fujian Provincial Hospital Chuang Shuang Gao firestone fund project (2020HSJJ15).
Conflict of interest
The authors declare that the research was conducted in the absence of any commercial or financial relationships that could be construed as a potential conflict of interest.
Publisher’s note
All claims expressed in this article are solely those of the authors and do not necessarily represent those of their affiliated organizations, or those of the publisher, the editors, and the reviewers. Any product that may be evaluated in this article, or claim that may be made by its manufacturer, is not guaranteed or endorsed by the publisher.
References
1. Hee MR, Huang D, Swanson E, Fujimoto JG. Polarization-sensitive low-coherence reflectometer for birefringence characterization and ranging. J Opt Soc America B-optical Phys (1992) 9(6):903–8. doi:10.1364/JOSAB.9.000903
2. Walther J, Li Q, Villiger M, Farah CS, Koch E, Karnowski K, et al. Depth-resolved birefringence imaging of collagen fiber organization in the human oral mucosa in vivo. Biomed Opt Express (2019) 10(4):1942–56. doi:10.1364/BOE.10.001942
3. Yao G, Duan D. High-resolution 3D tractography of fibrous tissue based on polarization-sensitive optical coherence tomography. Exp Biol Med (2020) 245(4):273–81. doi:10.1177/1535370219894332
4. Wu T, Cao K, Wang X, Pan R, Huo W, Wang J, et al. Single input state, single mode fiber based spectral domain polarization sensitive optical coherence tomography using a single linear-in-wavenumber spectral camera. Opt Lasers Eng (2020) 127:105948. doi:10.1016/j.optlaseng.2019.105948
5. Li Q, Sampson DD, Villiger M. In vivo imaging of the depth-resolved optic axis of birefringence in human skin. Opt Lett (2020) 45(17):4919–22. doi:10.1364/OL.400855
6. Adams DC, Szabari MV, Lagares D, McCrossan AF, Hariri LP, Tager AM, et al. Assessing the progression of systemic sclerosis by monitoring the tissue optic axis using PS-OCT. Scientific Rep (2020) 10(1):2561. doi:10.1038/s41598-020-59330-7
7. Villiger M, Braaf B, Lippok N, Otsuka K, Nadkarni SK, Bouma BE. Optic axis mapping with catheter-based polarization-sensitive optical coherence tomography. Optica (2018) 5(10):1329–37. doi:10.1364/OPTICA.5.001329
8. Hitzenberger CK, Gotzinger E, Sticker M, Pircher M, Fercher AF. Measurement and imaging of birefringence and optic axis orientation by phase resolved polarization sensitive optical coherence tomography. Opt Express (2001) 9(13):780–90. doi:10.1364/OE.9.000780
9. Baumann B, Baumann SO, Konegger T, Pircher M, Gotzinger E, Schlanitz F, et al. Polarization sensitive optical coherence tomography of melanin provides intrinsic contrast based on depolarization. Biomed Opt Express (2012) 3(7):1670–83. doi:10.1364/BOE.3.001670
10. Golde J, Tetschke F, Walther J, Rosenauer T, Hempel R, Hanning C, et al. Detection of carious lesions utilizing depolarization imaging by polarization sensitive optical coherence tomography. J Biomed Opt (2018) 23(4):1. doi:10.1117/1.JBO.23.7.071203
11. Willemse J, Grafe MGO, van de Kreeke JA, Feroldi F, Verbraak FD, de Boer JF. Optic axis uniformity as a metric to improve the contrast of birefringent structures and analyze the retinal nerve fiber layer in polarization-sensitive optical coherence tomography. Opt Lett (2019) 44(15):3893–6. doi:10.1364/OL.44.003893
12. Gräfe MGO, van de Kreeke JA, Willemse J, Braaf B, de Jong Y, Tan HS, et al. Subretinal fibrosis detection using polarization sensitive optical coherence tomography. Translational Vis Sci Technol (2020) 9(4):13. doi:10.1167/tvst.9.4.13
13. Motschi AR, Roberts PK, Desissaire S, Schranz M, Schwarzhans F, Bogunovic H, et al. Identification and quantification of fibrotic areas in the human retina using polarization-sensitive OCT. Biomed Opt Express (2021) 12(7):4380–400. doi:10.1364/BOE.426650
14. Gotzinger E, Baumann B, Pircher M, Hitzenberger CK. Polarization maintaining fiber based ultra-high resolution spectral domain polarization sensitive optical coherence tomography. Opt Express (2009) 17(25):22704–17. doi:10.1364/OE.17.022704
15. Lu Z, Liu C. Fiber motion-insensitive fiber-based polarization-sensitive optical coherence tomography for optic axis determination. J Opt Soc America B (2020) 37(3):608–17. doi:10.1364/JOSAB.376808
16. Moon S, Miao Y, Chen Z. Fiber-based polarization-sensitive optical coherence tomography of a minimalistic system configuration. Opt Lett (2019) 44(12):3150–3. doi:10.1364/OL.44.003150
17. Wang H, Al-Qaisi MK, Akkin T. Polarization-maintaining fiber based polarization-sensitive optical coherence tomography in spectral domain. Opt Lett (2010) 35(2):154–6. doi:10.1364/OL.35.000154
18. Ding Z, Liang C-P, Tang Q, Chen Y. Quantitative single-mode fiber based PS-OCT with single input polarization state using Mueller matrix. Biomed Opt Express (2015) 6(5):1828–43. doi:10.1364/BOE.6.001828
19. Trasischker W, Zotter S, Torzicky T, Baumann B, Haindl R, Pircher M, et al. Single input state polarization sensitive swept source optical coherence tomography based on an all single mode fiber interferometer. Biomed Opt Express (2014) 5(8):2798–809. doi:10.1364/BOE.5.002798
20. Liu X, Jiang L, Ke M, Schmetterer L, Barathi VA. Using image data to numerically correct the jitter in polarization depth encoding PS-OCT. Opt Lett (2021) 46(7):1692–5. doi:10.1364/OL.420029
21. Yu L, Guo J, Chou L, Ma T, Wu J, Lee J, et al. Polarization-sensitive optical coherence tomography using a modified balance detector. J Innovative Opt Health Sci (2012) 05(4):1250024. doi:10.1142/S1793545812500241
22. Fan C, Yao G. Full-range spectral domain Jones matrix optical coherence tomography using a single spectral camera. Opt Express (2012) 20(20):22360–71. doi:10.1364/OE.20.022360
23. He Y, Li Z, Zhang Y, Li H. Single camera spectral domain polarization-sensitive optical coherence tomography based on orthogonal channels by time divided detection. Opt Commun (2017) 403:162–5. doi:10.1016/j.optcom.2017.07.036
24. Lan G, Singh M, Larin KV, Twa MD. Common-path phase-sensitive optical coherence tomography provides enhanced phase stability and detection sensitivity for dynamic elastography. Biomed Opt Express (2017) 8(11):5253–66. doi:10.1364/BOE.8.005253
25. Wang C, Zhang Q, Wang Y, Zhang X, Zhang L. Long-range common-path spectral domain optical coherence tomography. Opt Express (2019) 27(9):12483–90. doi:10.1364/OE.27.012483
26. Mao Y, Chang S, Murdock E, Flueraru C Simultaneous dual-wavelength-band common-path swept-source optical coherence tomography with single polygon mirror scanner. Opt Lett (2011) 36(11):1990–2. doi:10.1364/OL.36.001990
27. Chang L, Weiss N, Van Leeuwen TG, Pollnau M, de Ridder RM, Worhoff K, et al. Chip based common-path optical coherence tomography system with an on-chip microlens and multi-reference suppression algorithm. Opt Express (2016) 24(12):12635–50. doi:10.1364/OE.24.012635
28. Vakhtin AB, Kane DJ, Wood WR, Peterson KA. Common-path interferometer for frequency-domain optical coherence tomography. Appl Opt (2003) 42(34):6953–8. doi:10.1364/AO.42.006953
29. Liu X, Iordachita II, He X, Taylor RH, Kang JU. Miniature fiber-optic force sensor based on low-coherence Fabry-Pérot interferometry for vitreoretinal microsurgery. Biomed Opt Express (2012) 3(5):1062–76. doi:10.1364/BOE.3.001062
31. de Boer JF, Hitzenberger CK, Yasuno Y. Polarization sensitive optical coherence tomography - a review [Invited]. Biomed Opt Express (2017) 8(3):1838–73. doi:10.1364/BOE.8.001838
32. Richartz M, Hsu H. Analysis of elliptical polarization. J Opt Soc America (1949) 39(2):136–57. doi:10.1364/JOSA.39.000136
33. Guo S, Zhang J, Wang L, Nelson JS, Chen Z. Depth-resolved birefringence and differential optical axis orientation measurements with fiber-based polarization-sensitive optical coherence tomography. Opt Lett (2004) 29(17):2025–7. doi:10.1364/OL.29.002025
34. Liu L, Wu C, Shang C, Li Z, Wang J. Stress direction measurement based on polarization state in optical fibers using the quaternion method. IEEE Photon J (2015) 7(4):6901014. doi:10.1109/JPHOT.2017.2764102
35. Li D, Li Z, Zhang J, Li K, Wu S, He Y, et al. Orthogonal-polarization-gating optical coherence tomography for human sweat ducts in vivo. J Biophotonics (2021) 14(4):e202000432. doi:10.1002/jbio.202000432
36. Wood MFG, Ghosh N, Wallenburg MA, Li S, Weisel RD, Wilson BC, et al. Polarization birefringence measurements for characterizing the myocardium, including healthy, infarcted, and stem-cell-regenerated tissues. J Biomed Opt (2010) 15(4):047009. doi:10.1117/1.3469844
37. Makita S, Yamanari M, Yasuno Y. Generalized Jones matrix optical coherence tomography: Performance and local birefringence imaging. Opt express (2010) 18(2):854–76. doi:10.1364/OE.18.000854
Keywords: quaternion approach, polarization-sensitive optical coherence tomography, polarization properties, birefringence, Jones matrix
Citation: Ke Q, Li K, Wu W, Li W, Chen H, Cai R and Li Z (2023) Determination of birefringence of biological tissues using modified PS-OCT based on the quaternion approach. Front. Phys. 11:1175914. doi: 10.3389/fphy.2023.1175914
Received: 28 February 2023; Accepted: 25 April 2023;
Published: 11 May 2023.
Edited by:
Chenxi Li, Tianjin University, ChinaReviewed by:
Peng Li, Zhejiang University, ChinaDan Cheng, Affiliated Eye Hospital to Wenzhou Medical University, China
Copyright © 2023 Ke, Li, Wu, Li, Chen, Cai and Li. This is an open-access article distributed under the terms of the Creative Commons Attribution License (CC BY). The use, distribution or reproduction in other forums is permitted, provided the original author(s) and the copyright owner(s) are credited and that the original publication in this journal is cited, in accordance with accepted academic practice. No use, distribution or reproduction is permitted which does not comply with these terms.
*Correspondence: Renhui Cai, Y3JoaHp6MkAxMjYuY29t; Zhifang Li, bGl6aGlmYW5nQGZqbnUuZWR1LmNu
 Qiuqing Ke1
 Zhifang Li