 Mingwei Xu
 Ke Li
Ke Li Yanling Xue
 Feixiang Wang2
 Zhixuan Liu
 Zenghao Song
 Tiqiao Xiao
95% of researchers rate our articles as excellent or good
Learn more about the work of our research integrity team to safeguard the quality of each article we publish.
Find out more
ORIGINAL RESEARCH article
Front. Phys. , 24 April 2023
Sec. Optics and Photonics
Volume 11 - 2023 | https://doi.org/10.3389/fphy.2023.1174387
This article is part of the Research Topic Advances in Bio-Optical Imaging View all 7 articles
Cuttage is a widely used technique for plant propagation, whose success relies on the refilling for water transport recovery. However, requirements for refilling characterization studies, including large penetration depth, fast temporal resolution and high spatial resolution, cannot be reached simultaneously via conventional imaging techniques. So far, the dynamic process of water refilling along the vessels at the initial stage of cuttage, as well as its characteristics, remains unclear. Hereby, we developed a move contrast X-ray microtomography method which achieves 3D dynamic non-destructive imaging of water refilling at the initial stage of willow branch cuttage, without the aid of any contrast agent. Experimental results indicate three primary refilling modalities in vessels: 1) the osmosis type, mainly manifested by the osmosis of tissue through the vessel wall into the cavity; 2) the linear type, revealed as the tissue permeates to a certain extent where the liquid column in the vessels is completely formed; and 3) an osmosis-linear mixed type refilling as an intermediate state. Further analysis also exhibits a “temporal-spatial relay” mode of refilling between adjacent vessels. Since the vessel length is quite limited, the cavitation and the relay refilling mode of vessels can be an important way to achieve long-distance water transport.
Prior research results show that the survival of plants depends on the water transport in the soil-plant-atmosphere continuum [1, 2]. The plant vessel is one of the most important organs for water transport, but the cavitation of the vessels can greatly reduce the water transport efficiency [3]. According to the air seeding theory, air seeds will be introduced into the xylem due to drought stress, freeze-thaw cycle and trauma during the plant growth [4–8]. The rapid expansion of air seeds under the negative pressure environment will lead to varying degrees of vessel cavitation in the xylem [3, 9, 10]. Further development of cavitation will evolve into a more destructive embolism phenomenon, which significantly reduces or even leads to complete loss of the water transport capacity of plants, causing plant death [11]. Some studies have concluded that cutting the plant stem segments, either in air or underwater, increases the degree of cavitation and the cavitation will inevitably exist in the detached stem segments [12]. As far as cuttage are concerned, the plants must experience the process of dehydration, cavitation, and refilling. The key to successful cuttage lies in timely restoration of water transport, that is, the refilling process of cavitation repair.
The mechanism of refilling of cavitated vessels has long been a hot topic in the botany research. As imaging technology proceeds, the water transport process of plants is analyzed from more and more detailed spatial-temporal dimensions. Currently, the imaging methods applied to study the water transport process of plants include visible light imaging [13], terahertz imaging [14], Raman microspectroscopy [15], neutron imaging [16, 17], magnetic resonance imaging (MRI) [18], contrast-enhanced MRI [19], X-ray/synchrotron radiation imaging (2D/3D) [20–26], MRI-CT multi-mode imaging [27], etc. Among these methods, visible light, terahertz and Raman microspectroscopy have relatively shallow imaging depths, making it arduous to image opaque plant stems. Neutron imaging and MRI have good penetrability, but their spatial resolution can only reach about 50 μm generally, therefore difficult to accurately image refilling process within tens of microns in diameter plant vessels. In addition, corresponding temporal resolution of neutron imaging and MRI is about 3 min, thus challenging for these methods to capture the dynamic process of cavitation repair. More specifically, the conflict between temporal resolution, spatial resolution, and imaging depth appears to be the main problem of current plant water transport imaging.
Compared to above imaging methods, X-ray phase contrast imaging (2D/3D) with its large penetration depth, high spatial resolution, and excellent density resolution [28], allows tracking changes at the gas-water interface. Therefore, it is suitable for imaging refilling processes in plant leaves [20, 22, 26] and opaque stems [21, 23–25]. However, phase contrast X-ray CT (PCXCT) has a low temporal resolution, typically on the order of tens of minutes. It is thus difficult to visualize the 3D dynamic evolution of refilling using PCXCT. Dynamic micro-CT is capable of 3D dynamic imaging at a high frame rate [29–31], while the primary challenge is its low image contrast [32], which makes localization for the refilling of plant stems in 3D space laborious. High contrast images could be obtained by using iodine-based contrast agent [33]. Nevertheless, contrast agents can alter the original physicochemical environment of the plant, such as osmotic pressure and chemical potential [34], leading to incorrect experimental results. Therefore, it is difficult to achieve in situ dynamic 3D imaging of plant refilling processes using conventional X-ray imaging techniques.
In comparison, move contrast X-ray imaging (MCXI) allows in situ observation of the dynamic evolution of refilling without resorting to any contrast agents. By means of MCXI, Li et al. realized the quantitative analysis of water transport characteristics in the vessels of the plant stems for the first time. They discovered that refilling in the vessels started with water osmosis along the vessel inner-wall and then entered the process of quick transport [35]. However, due to the complexity of the internal plant tissue and microvascular network structure, it is impossible to localize the relationship between refilling and plant microstructure by a single-projection-based MCXI. By combining the MCXI with the dynamic micro-CT, and taking advantage of high sensitivity in move contrast imaging [36–38], it is possible to realize the 3D in situ quantitative study of the water refilling process.
Salix babylonica L. is a kind of tree species that likes light, warm and humid climates, has developed roots, grows rapidly, cold resistant, drought resistant, saline-alkali resistant, and has strong environmental adaptability. It is found mainly distributed in the temperate zone of the Northern Hemisphere and is generally propagated by cuttage. In this study, willow branch with the length of 10–12 cm and the diameter of about 2 mm was collected at the south gate of Shanghai Synchrotron Radiation Facility (31° 11′ 33″ N, 121° 35′ 34″ E) in early July as experimental samples. After that, place them in an indoor environment with a temperature of 23°C and a humidity of 40% for about 0.5 h for cavitation treatment, and then conduct experiments to insert willow branch into water to simulate the natural cuttage process. Due to the use of filtering measures and the short experimental time, no significant temperature increase and no radiative damage were found in the willow branch sample after the experiment.
Different move modes of various components of the sample will have different modulation effects on the incident X-ray. The time-domain change
Where
The amplitude and phase of the spectrum are as follows:
Where the amplitude represents the fit of the sample’s move mode to the target move mode, that is, the trajectory of the move signal. In this article, it represents the trajectory of water. The phase value represents the time information of the move signal, corresponding to the time when the refilling occurs. According to the linear property of Fourier transform, the spectrum of move contrast’s amplitude information can be divided into combinations of different frequencies, and the move track information of the interesting signals can be obtained by selecting the appropriate spectrum range [35]. Formula 3 can be transformed into:
Where
In order to obtain the time of refilling, the phase information of move contrast imaging can be used. It is assumed that the target moves from the space-time position
This means that a phase shift factor
In order to obtain the 3D spatial position information of the refilling, it must conduct the 3D reconstruction of the move contrast signal. In principle, extending MCXI to 3D imaging is not difficult. The challenge lies on data collection and image reconstruction. In 2D MCI, an image sequence can be acquired in a moderate exposure time and frame rate. In comparison, 3D move contrast imaging needs to tell the difference in a sequence of CT images. It means that move contrast X-ray micro-CT (MCXCT) needs higher photon flux, faster rotational speed, and faster frame rate for shooting. Meanwhile, projections at a fixed angle from different set of CT need to be aligned accurately. This is a great challenge for the synchronization of the detector with the rotating stage during the experiments. Usually, the mismatch of the projection images should be less than one-half pixel, in order to reconstruct the 3D trajectory of water refilling along the vessels. In addition, sample should be strictly stable during high-speed rotating for dynamic data acquisition. The sample-instability-introduced misalignment is also required to be less than one-half pixel to avoid motion artifacts or erroneous signal during image reconstruction of MCXCT. As for image reconstruction of MCXCT, we need to reconstruct the three-dimensional conventional contrast microstructure of the cutting and also the move contrast trajectory of water refilling respectively. Then the vessels with the occurrence of water refilling are identified by the image fusion of the two sets of CT in phase contrast and move contrast.
The MCXCT experiment of the willow branch was conducted on the X-ray imaging beamline BL13HB and R&D beamline BL09B of third-generation Shanghai Synchrotron Radiation Facility (SSRF) with storage ring energy of 3.5 GeV. Because the water refilling speed is very fast at initial stage of cuttage, the broadband white light mode was adopted to achieve high time resolution. To eliminate the effect of radiation damage on the sample, four layers of 15 μm thick aluminum foils were placed in the optical path in front of the sample to absorb low-energy X-rays. The experimental device is shown in Supplementary Figure S1. The cavitated willow branch was fixed on the polymethyl methacrylate (PMMA) holder with a water tank at the bottom through adhesive tape. A round hole is opened on the upper surface of the water tank to facilitate insertion of the willow branch. Before experiment α-cyanoacrylate glue/adhesive (502 glue) was used to fix the holder on the air-bearing stage to keep the sample stable during the rotary scanning process. Before the experiment, the water tank should be kept dry. When everything is ready, the water tank was filled with water (about 18 mL) through a medical syringe, the photon shutter was opened, and shooting started immediately after the rotation speed of the air-bearing stage was stable. Due to the safety interlock setting of the experimental hutch, the photon shutter was opened 10–15 s after water injection, and data acquisition was started. The detector was placed 53 cm away from the sample to ensure sufficient phase propagation distance and the contrast of the water-air interface was further enhanced. As shown in Supplementary Figure S1, the imaging area is marked with a red rectangle. The X-ray light field passing through the sample was converted by the scintillator (LuAG: Ce, 100 μm) into visible light, and then magnified by optical microscope with 8× lens. The image was recorded by CMOS fast imaging detector (FASTCAM SA-Z, Photon), with a pixel size of 20 μm, bit depth 12 bits, array size of 1,024 × 1,024 pixels. Accordingly, the effective pixel size of the detector is 2.5 μm. It is enough to distinguish the vessels with a diameter of 20–40 μm and surrounding tissue in the willow branch.
During data acquisition, the rotation speed of the air-bearing stage was set to 240 rpm, with the exposure time of each frame of 33.7 μs, the frame rate of the detector of 1,000 fps, and the shooting time of 7.75 s. This indicates that the sample rotated by 180° every 125 ms, and 125 projections were taken at the same time. A total of 62 sets of CT data were collected within 7.75 s The refilling process can be regarded as quasi-static during a CT scan cycle of 125 ms. At the same time, according to the acceleration equation of circular motion, a = ω2r, the outer edge of the willow branch has the maximum centrifugal acceleration. Substituting the relevant parameters into the acceleration equation yields the maximum centrifugal acceleration is a = 0.63 m/s2 ≈ 0.06 g (g refers to the acceleration of gravity). This means that the effect of centrifugal acceleration caused by rotating at such a speed can be ignored. In other words, rotational exposure does not affect natural refilling.
To obtain the 3D distribution of the refilling, the dynamic micro-CT slices were reconstructed using the PITRE software [39], and then slices with the refilling distribution were generated by move contrast algorithm. When water of uniform density flows through a point, the time-series grayscale at that point will produce a step-like signal. The Fourier transform spectral power of the step signal is concentrated mostly in the low frequency region, while the fluctuations in the imaging background and the detector thermal noise are mainly high frequency signals. Taking advantage of this difference, the passband ranges [kLP, kHP] can be set to the low-frequency region to extract the signal generated by water refilling. So that the weak signal imaging under a complex background was realized, and the imaging sensitivity of the water refilling in the complex vessel-tissue network structure of the willow branch was greatly improved. Furthermore, based on the phase information of move contrast imaging, the time information of refilling could be further obtained, and the refilling flow and its change with time could be calculated.
In this study, based on the high sensitivity of MCXI in combination with the dynamic micro-CT, we traced the movement of the gas-water interfaces under the complex background of plant stem without using any contrast agent, and realized the four-dimensional spatial-temporal positioning of refilling in the vessels through the MCXCT. By fusing the CT microstructure of the willow branch with the spatio-temporal position of the MCXCT refilling water, the 3D dynamic evolution of the refilling along the willow branch tissues and vessels was obtained. The first set of CT data was used to reconstruct the 3D microstructure of the willow branch, which is in fact the phase contrast X-ray CT (PCXCT) of the branch. At this time, the refilling was just started, and the refilling information of water had little impact on the structural information of the willow branch. According to the recorded time series, multiple sets of CT data were used to reconstruct the 3D spatial distribution of the refilling trajectory and its evolution with time. Figure 1 shows the three-dimensional microstructure of the willow branch and the distribution of refilling trajectory at the initial stage of cuttage. Figure 1A shows the 700th layer slice of MCXCT, and green elements represent the amplitude signal of MCXCT, indicating that refilling has occurred at these locations. The spatial positions of the pixels on the PCXCT and MCXCT reconstruction results correspond to each other, due to the same projection was used for reconstruction in PCXCT and MCXCT. Therefore, the distribution of the refilled water in the willow branch can be obtained by fusing the two images as shown in Figure 1B, in which a gray image is used to illustrate the spatial structure of the willow branch. The brighter part represents the willow branch tissues, and the darker part represents the low-density areas, which are the vessels distributed on the cross-section. According to the locations, the MCXCT signals in the tissues are scattered in the willow branch cross-section, almost everywhere. This means that the refilling in the tissues should be dominated by osmosis, and the tissues in all parts of the body participated in the refilling process. As can be seen from Figure 1B, most of the inner walls of the vessels have scattered MCXCT signals, and this part of the water should be formed by osmosis from the tissues into the inner walls of the vessels. Individual vessels are fully filled with the MCXCT signals, indicating that these vessels have completed tissue osmosis and are undergoing the transport along the vessel cavities. It can be seen from the evolution of the distribution of refilling signals in the section of this layer over time (Supplementary Figure S2A) that, with the progress of refilling, the water continuously permeates into the vessel from the tissue, and these droplets gradually fuse until they fill the vessel, completing the refilling of the vessel. Combined with the dynamic evolution process of refilling in the 3D space (Supplementary Figure S2B), it can be found that the droplets in the vessel gradually form a liquid column, and then the liquid column gradually grows with time, thus achieving the cavitation repair. Moreover, the above observed phenomenon is similar to that of the model of water osmosis-aggregation in the refilling process [21–24].
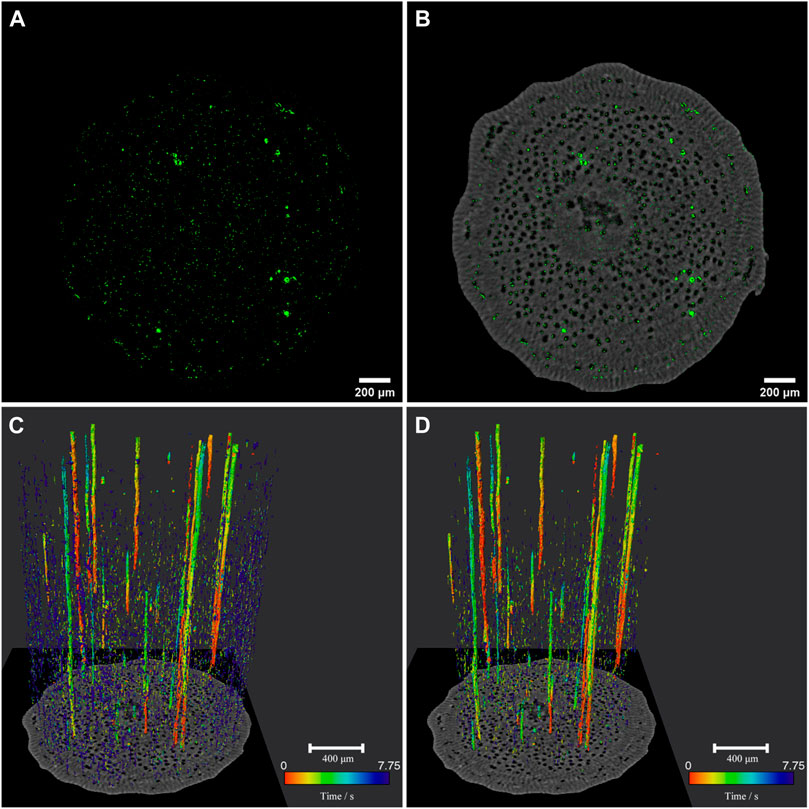
FIGURE 1. Imaging results for MCXCT. (A) MCXCT slice No. 700 at 7.75 s. (B) Fusion of CT slice (grayscale) and MCXCT slice (green) at 7.75 s (C,D) Temporal and spatial distribution of refilling water in willow branch (C) and vessels (D), with the color bar corresponding to time 0–7.75 s.
According to the principle of move contrast imaging, the amplitude diagram represents the trajectory of the motion signals, the phase diagram represents the temporal distribution, and the change direction of the phase value represents the evolution direction with time. By fusing the PCXCT amplitude diagram with its phase diagram and combining the PCXCT spatial structure information, the evolution of the refilled water in the willow branch with time was obtained. As shown in Figure 1C. The red to blue colors are used to map the corresponding spatial positions at different time points in the time period of 0–7.75 s. It can be seen that the refilling in the willow branch is mainly in the form of liquid columns, supplemented by the osmosis of liquid droplets. According to the column shape of the vessels, these liquid columns should be in the vessels, and the vessels should be the main site for refilling at the initial stage of willow cuttage. Based on the vessel spatial structure given by the PCXCT, the MCXCT signals inside the vessels were extracted separately, as shown in Figure 1D. On the whole, the colors of the liquid columns in the vessels are generally bright, and those of the permeated droplets are dark. Since the bright color represents an earlier time sequence and the dark color represents a later time sequence, it is indicated that the severely cavitated vessels are refilled in the form of liquid columns first. Viewing from the color distribution of the liquid columns, the colors are mainly distributed in the order of red, orange, yellow and green colors from the bottom to the top, which means that the refilling is extended from the proximal end to the distal end, which is consistent with our existing knowledge. In order to more intuitively express the evolution of refilling with time, Supplementary Figure S2 shows the spatial distribution of the refilling trajectories at different time points (2D/3D). Obviously, the information given in Supplementary Figure S2 is consistent with that in Figure 1D. By means of pseudo color expression, Figure 1D shows a 4D distribution diagram of water filling in the vessels, which contains the 3D space and 1D time information.
From the 4D distribution information of refilling given in Figure 1D, we can know the qualitative information of the refilling process in the vessels at the initial stage of cuttage. To better understand the cavitation repair mechanism of vessels, it is necessary to further quantitatively analyze when and where the refilling startups. Because the MCXCT can provide the 3D space and 1D time information of refilling at the same time, it can be used to realize the quantitative analysis of the starting and transfer characteristics of the vessel refilling. The distribution of refilling starting positions along the vessels can be obtained by making the statistics of the occurrence positions of refilling in the vessels at different time points, as shown in Figure 2A. It can be known from Figure 2A that refilling may start simultaneously from multiple heights at the same time point. During the time period of 0.5 ± 0.5 s, refilling startups in the vessels are more intensive. During the time period of 2.0 ± 0.5 s, the number of refilling startups is smaller. It may be because that after a period of intensive starting, the tissues around the vessels need to spend time accumulating water as the source for subsequent starting. This means that the refilling at the initial stage of cuttage starts simultaneously from different parts of the vessels, rather than from the bottom up as is commonly understood. During the time period of 3.0 ± 0.5 s, the refilling starting is resumed, but the number of startups is reduced compared with that of the first round of starting. After 4 s, the number of refilling startups decreases significantly until 5 s when the number of startups becomes zero. The statistical histogram of the number of refilling startups in Figure 2B confirms the above analysis. Therefore, excluding the time from water injection in the pool to the start of recording, the time required for the initial refilling of the willow branch cuttage to start is about 4 s. From Figures 2A, B, it can be seen that after 5 s, no new start of refilling can be observed along the vessel walls, indicating that the water columns in the vessel cavities have been formed at this time, and the refilling form has changed from the osmosis from the surrounding tissue to the vessel walls to the transport inside the vessel cavities. Figure 2C shows the statistical histogram of changing of the number of refilling startups with the height. It can be seen that the number of startups decreases rapidly with the height, and only one new refilling start can be observed at the top of the field of view. The number of refilling startups at the proximal end is more than that at the distal end, indicating that the refilling pressure at the proximal end is larger, and the gradual decrease of the number means that there is a pressure gradient from high to low. Apparently, this is consistent with the prediction by Cohesion-Tension theory (CTT) [40].
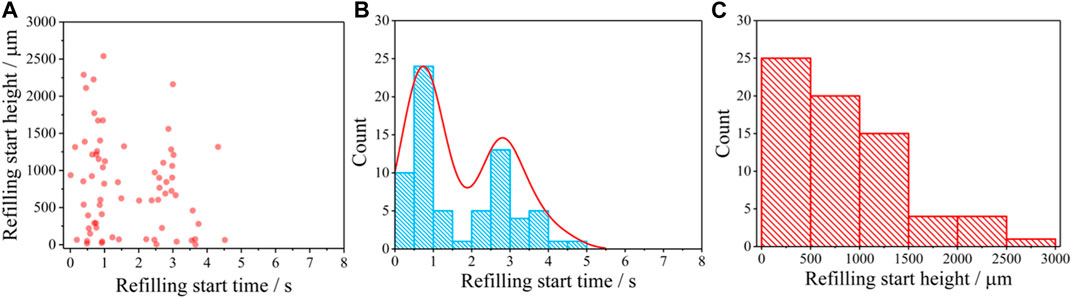
FIGURE 2. Startup time and height of water refilling in vessels. (A) Height vs. time. (B) Histogram of startup time and (C) Histogram of startup height.
By analyzing the position and time of refilling starting, we can infer the overall characteristics of the initial refilling starting in the willow branch cuttage. Firstly, the water osmosis from the tissue into the inner walls of the vessel occurs along the vessel walls at different heights. Then, a steady stream of water permeates from the tissue into the inner walls of the vessel, forming scattered droplets, which gradually grow in both number and size until they fuse together to form a column that fills the vessel cavity. Finally, the liquid column in the vessel cavity grows gradually from bottom to top, thereby completing the repair of the cavitated vessel. Because the vessels and tissues form a complete water network, when the part close to the water source absorbs water, the change of osmotic pressure in the tissue will be quickly transferred to the entire network, including the vessels. Under the traction of the cavitation negative pressure, refilling can be started quickly in a short time at different heights along the vessel walls. Therefore, it can be considered that the refilling chain of the willow branch at initial stage of cuttage is composed of water source-tissue-vessel-tissue. As a key link, tissue is the pressure transmitter and water source for the start of refilling in vessels.
There are numerous vessels in the willow branch, the cavitation degrees of different vessels and the relationship between the vessel and the surrounding tissue are different. Studying the refilling performance of a single vessel is the key to further accurate understanding of the refilling modalities. The total number of vessels for the willow branch during the MCXCT experiments in this paper was over 400 by count. However, only 69 vessels appeared to have been refilled on a significant amount during the experiment. These vessels were randomly indexed, and height-time curves for refilling within them were plotted based on the spatial and temporal distribution provided by the MCXCT experiment, as shown in Supplementary Figure S3 in Supplementary Material. There are three primary refilling modalities were summarized, namely, osmosis type (vessel No. 7), linear type (vessel No. 60), and mixed type (vessel No. 62). The detailed height-time curves of the three typical examples and their corresponding structures are shown in Figure 3.

FIGURE 3. Three typical modalities of water refilling along vessels. (A) Position vs. time curves for the three typical modalities and the velocities after linear fitting. (B–F) Fused images of CT and MCXCT at positions of the vessels, with the grayscale indicating the microstructure of the vessels surrounded by the tissues, and the blue denoting the refilled water reconstructed by MCXCT. (B) Cross section at 895 μm corresponding to the black curve in (A). (C) Red curve at 1,400 μm (D) Blue curve at 1,875 μm. (E) Blue curve at 2,000 μm (F) Blue curve at 2,200 μm.
The black curve in Figure 3A represents the osmosis type, which, on the height-time curve, is manifested by the simultaneous occurrence of the refilling signals at different positions in the vessel within a short period of time, which means that the tissue-vessel wall-vessel cavity osmosis occurs at different positions of the vessel at the same time. Figure 3B shows the cross-sectional view of the 3D structure of the vessel corresponding to the black curve, its neighboring vessels and its surrounding tissue at the position of 895 μm, where the blue part represents the refilled water. It can be found that there are a number of intervessel pits on the inner walls of the vessel that connect with the adjacent vessels. The existence of these intervessel pits makes it impossible to create a stable negative pressure environment in the vessel cavity, leading to the fact that the refilling of this type of vessels is mainly based on permeability, and this refilling modality is called osmosis type.
The red curve in Figure 3A represents the linear type, and the position of the refilling signal changes linearly with time, indicating that the refilling is unidirectional along the vessels, which is a typical vessel-dominated refilling. According to the linear fitting of this curve, the refilling speed of 104.6 μm/s was obtained, which is relatively slow, indicating that the vessel is in the stable vessel transport period. Figure 3C shows the cross-section view of the 3D microstructure of the vessel at 1,400 μm. It is obvious that the vessel is isolated from and has no connection with the adjacent vessels. As there are no macro pits between the vessel and the adjacent tissue, the vessel wall is relatively complete, and a relatively independent negative pressure environment can be formed to ensure the stable water transport in the vessel cavity. With no connection to adjacent vessels, the water source for continuous refilling of the vessel should come from the osmosis of the surrounding tissue. The water permeates into the inner wall of the vessel and mutually fuses to form a complete liquid column. Then the liquid column continues to transport upward at a stable speed driven by the negative pressure gradient in the vessel [3]. This refilling modality is called linear type. In addition, Kim et al. observed the refilling process in xylem vessels of isolated rice leaves using the synchrotron radiation source [20]. The average rising velocity of the refilling liquid column in their study was about 50–100 μm/s. This is similar to the linear type refilling velocity of 104.6 μm/s achieved by MCXCT in this paper.
The blue curve in Figure 3A shows the mixed type. The height-time curve of the refilling signals shows that there are signals at multiple positions at the same time in the early stage, and then it turns into a linear change with a constant slope. It can be known from Figure 3A that the positions of the blue curve at 1,875 μm, 2,000 μm and 2,200 μm correspond to the osmosis section, transition section and linear transport section, respectively, and the corresponding spatial microstructure is as shown in Figures 3D–F. It can be seen from Figures 3D–F that the liquid column corresponding to the osmosis section is incomplete, and there is a cavity in the middle of the liquid column, while the liquid column of the transition section and that of the linear section are relatively complete, filling the entire vessel. The results in Figure 3D show that a complete liquid column has not been formed at the start stage of refilling, the vessel cavity is connected up and down, there is no pressure difference at both ends of the liquid column, and the liquid column has no overall upward power, which is mainly manifested by the osmosis from the surrounding tissue to the vessel, forming an osmosis refilling. As the refilling proceeds, the water in the vessel cavity gradually accumulates until a complete liquid column is formed at the osmosis part, as shown in Figures 3E, F. The pressure difference caused by the negative pressure at the cavitation end of the vessel drives the liquid column to transport upward at a constant speed, with the refilling transiting from the osmosis type to the linear type. It can be considered that viewing from a long period of time, most cavitated vessels will experience the mixed refilling modality from osmosis type to linear type at the initial stage of cuttage. From the fitting result of the linear section of the blue curve in Figure 3A, it can be seen that the growth rate of the liquid column is 359.8 μm/s, which is far greater than that in the linear type refilling represented by the red curve. This indicates that the pressure difference in the vessel is large during the mixed type refilling, which drives the refilling to progress quickly.
More structural evidence corresponding to the three refilling modalities can be seen in Supplementary Figure S4. The osmosis refilling modality mostly appears in the vessels that are connected with the adjacent vessels, the linear refilling modality appears in the vessels that exist alone and the liquid column in which is complete, and the mixed refilling modality appears in the vessels in which a closed liquid column is not formed in the osmosis stage, but at the linear stage, the liquid column is complete and fills the vessel cavity. Supplementary Figure S5 shows the longitudinal section views of the microstructures of the osmosis, linear and mixed refilling modalities, respectively. As shown by the yellow arrow, the vessel where the osmosis type of refilling is located has connected adjacent vessels and many macro pits on its inner wall. The vessel where the linear type of refilling is located is completely separated from the adjacent vessels and has no macro pits in the inner wall, in which the liquid column is complete. The vessel where the mixed type refilling is located is alone in the surrounding tissue and has complete inner walls, in which the liquid column below the transition point marked by the yellow arrow is incomplete and has cavities, and the liquid column becomes complete after the transition point. Obviously, the microstructures of the longitudinal sections further validate the cross-section-based analysis.
The height of a plant is usually far greater than the length of its vessels, and therefore, water cannot be transported from roots to leaves by a single vessel. A large number of vessels are densely distributed in the willow branch, as shown in Figures 4A, B. As long as there are adjacent connected vessels, the vessel relay transport mode should be possible. It can be seen from the height-time curves of the liquid columns in vessel refilling (Supplementary Figure S3) that the refilling in No. 7 and No. 59 vessels shows the obvious “temporal-spatial relay” characteristics, which can be clearly seen by plotting the two curves together, as shown in Figure 4C. It can be seen that refilling is almost consecutive at the height of 1,300 μm marked by blue solid line in Figure 4C. Combined with the wood anatomical structures, the relay of refilling occurs near the intervessel pits. Two pink horizontal dashed lines in Figure 4C are used to mark the height interval of the intervessel pits. The position of the vessel in the 3D microstructure reconstructed by the MCXCT can be located according to the index, and the refilling in vessels No. 7 and No. 59 are marked with red and green arrows, respectively (Figures 4A, B). It can be seen from the distribution sectional images of the longitudinal (Figure 4A) and transverse (Figure 4B) vessels of the willow branch that these two vessels are closely adjacent to each other, and the refilling relay position is marked with a white rectangle in Figure 4A. In order to show the microstructure of the relay position more clearly, the white rectangle marking position in Figure 4A is shown in Figure 4D after being magnified. The cross-sectional 3D view of the region marked by the purple rectangle in Figure 4D at the height of 1,520 μm is shown in Figure 4E. It can be seen from Figures 4D, E that no direct water-transmission can be found between the two vessels, and the end of the former vessel refilling and the start position of the posterior vessel refilling are not completely consistent in space, but there is a longitudinal spatial overlap. It indicated that the refilling processes of these two vessels are mutually independent, and it is also the water supply provided by the surrounding tissue osmosis for the two vessels that ensures the refilling relay.
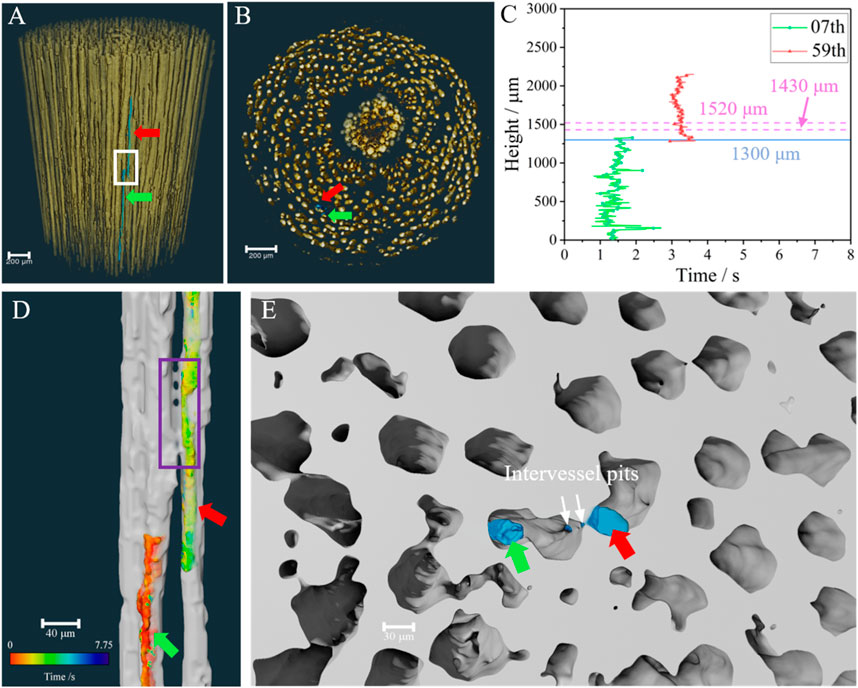
FIGURE 4. Relay transport between adjacent vessels. (A) Fusion of vessels and relay transport water columns with the stereo view and (B) Vertical view from the top. (C) Height-time curve for the refilling column in vessels No. 7 and No. 59, while the blue solid line and pink dash lines representing the height of the relay point and the intervessel pits, respectively. (D) The side view of adjacent vessels and water column extracted from the white rectangle in (A), and the relay region are marked by purple rectangle. (E) Cross section view of the selected part of the purple rectangle in (D). The blue parts in (A,B,E), and colored parts in (D) represent water. In addition, green and red arrows marked the refilling column in vessels No. 7 and No. 59, respectively.
As shown in Figure 4E, vessels No. 7 and No. 59 are connected by intervessel pits. This means that the air pressure between them is essentially the same. As well known, water is constantly transported in plants in a proximal-to-distal pattern, and the proximal tissues are prioritized to receive water. After the former vessel was refilled, the water then seeped through the inner wall of the posterior vessel, stimulating the relay refilling. This implicates that the intervessel pits and osmosis from tissue to vessel contribute to the relay refilling of the two adjacent vessels.
There are currently three main hypotheses for the mechanism of water refilling: the osmotic hypothesis, the reverse osmotic hypothesis and the phloem-driven refilling hypothesis [41]. The validation of these hypotheses requires the development of novel imaging techniques. Phase contrast X-ray CT (PCXCT) is one of the most important in situ imaging methods for xylem refilling studies [42]. Refilling models based on PCXCT developed by different research groups are consistent [21–23]. These models support the osmotic hypothesis that plants can actively secrete solutes such as sugars into the cavitated vessel so that the local osmotic pressure is lower than that of the surrounding tissue. This mechanism allows water within the tissue to permeate the inner walls of the vessel at different heights. As refilling proceeds, the droplets become more and more numerous until they coalesce into liquid columns and occupy the cavitated vessel [21–23, 43]. However, these models give only an approximate picture of the refilling process on hourly time scales and is hard to give quantified dynamic details. As comparison, move contrast X-ray micro-CT (MCXCT) with a spatial resolution of 2.5 μm and a three-dimensional temporal resolution of 125 ms reveals that there are three typical modalities of water refilling, namely, osmosis type, linear type, and mixed type at the initial stage of willow cuttage. Among them, the imaging results and height-time curves of osmosis refilling are consistent with the osmotic hypothesis. The linear type represents the refilling process after liquid column formation. The mixed type shows the evolution of the whole refilling process. This suggests that the experimental results of MCXCT demonstrate the existing refilling models based on the osmotic hypothesis. Furthermore, a “temporal-spatial relay” refilling mode between adjacent vessels with intervessel pits was discovered. The experimental results infer that the intervessel pits and osmosis from tissue to vessel contribute to the relay refilling of the two adjacent vessels. Based on the results of the existing studies on embolism spread in the xylem through the vessel relay [44–47], the existence of “temporal-spatial relay” refilling mode should be justified. The Cohesion-Tension theory points out that water is in a metastable state under the tension drawing in the vessels of normally growing plants, and the xylem vessels will experience frequent cavitation and refilling cycles due to drought stress, freeze-thaw cycles and external injuries [48, 49]. Each of such cycles involves the transfer of water between the vessels and the tissues. It is speculated that the mechanism of long-distance water transport in plants should be related to the vessel cavitation and refilling cycles and the relay refilling along the adjacent vessels.
In conclusion, the MCXCT technique developed in this paper can realize 3D dynamic imaging of weak moving signals in a complex background. It can be applied to many research fields for weak signal tracking in a complex system. Meanwhile, some issues deserve to be taken seriously. Firstly, MCXCT requires efficient data collection with high precision. Secondly, massive data need to be processed during image reconstruction. In addition, the twirling of sample may affect the natural state of some dynamic processes to some extent.
The raw data supporting the conclusion of this article will be made available by the authors, without undue reservation.
TX conceived this research. MX and KL prepared the plant samples. TX, KL, and MX designed the experiments. MX and KL conducted the experiments. MX and KL analyzed the data, produced all materials. MX and TX wrote the manuscript. The manuscript reflects the contributions and ideas of all authors.
The following fundings are acknowledged: National Key Research and Development Program of China (Grant No. 2021YFA1600703, 2021YFF0601203, 2017YFA0206004) and National Natural Science Foundation of China (NSFC) (Grant No. 81430087).
The authors thank Guohao Du, Honglan Xie, Haipeng Zhang, Yuan Zhang, Fucheng Yu, Xiaolu Ju, and Han Guo for their kind help and fruitful discussion on experiments and data processing.
The authors declare that the research was conducted in the absence of any commercial or financial relationships that could be construed as a potential conflict of interest.
All claims expressed in this article are solely those of the authors and do not necessarily represent those of their affiliated organizations, or those of the publisher, the editors and the reviewers. Any product that may be evaluated in this article, or claim that may be made by its manufacturer, is not guaranteed or endorsed by the publisher.
The Supplementary Material for this article can be found online at: https://www.frontiersin.org/articles/10.3389/fphy.2023.1174387/full#supplementary-material
1. Kreszies T, Schreiber L, Ranathunge K. Suberized transport barriers in Arabidopsis, barley and rice roots: From the model plant to crop species. J Plant Physiol (2018) 227:75–83. doi:10.1016/j.jplph.2018.02.002
2. Manzoni S, Vico G, Porporato A, Katul G. Biological constraints on water transport in the soil–plant–atmosphere system. Adv Water Resour (2013) 51:292–304. doi:10.1016/j.advwatres.2012.03.016
3. Zimmermann MH. Xylem structure and the ascent of sap. Germany: Springer Science and Business Media (2013).
4. Brendan C, Brodersen CR, McElrone AJ. Synchrotron X-ray microtomography of xylem embolism in Sequoia sempervirens saplings during cycles of drought and recovery. New Phytol (2015) 205(3):1095–105. doi:10.1111/nph.13110
5. Brodersen CR, McElrone AJ. Maintenance of xylem network transport capacity: A review of embolism repair in vascular plants. Front Plant Sci (2013) 4:108. doi:10.3389/fpls.2013.00108
6. Cochard H, Tyree MT. Xylem dysfunction in quercus: Vessel sizes, tyloses, cavitation and seasonal changes in embolism. Tree Physiol (1990) 6(4):393–407. doi:10.1093/treephys/6.4.393
7. Davis SD, Sperry JS, Hacke UG. The relationship between xylem conduit diameter and cavitation caused by freezing. Am J Bot (1999) 86(10):1367–72. doi:10.2307/2656919
8. Ryu J, Hwang BG, Kim YX, Lee SJ. Direct observation of local xylem embolisms induced by soil drying in intact Zea mays leaves. J Exp Bot (2016) 67(9):2617–26. doi:10.1093/jxb/erw087
9. Venturas MD, Sperry JS, Hacke UG. Plant xylem hydraulics: What we understand, current research, and future challenges. J Integr Plant Biol (2017) 59(6):356–89. doi:10.1111/jipb.12534
10. Sperry JS, Tyree MT. Mechanism of water stress-induced xylem embolism. Plant Physiol (1988) 88(3):581–7. doi:10.1104/pp.88.3.581
11. Zwieniecki MA, Holbrook NM. Confronting maxwell's demon: Biophysics of xylem embolism repair. Trends Plant Sci (2009) 14(10):530–4. doi:10.1016/j.tplants.2009.07.002
12. Torres-Ruiz JM, Jansen S, Choat B, McElrone AJ, Cochard H, Brodribb TJ, et al. Direct x-ray microtomography observation confirms the induction of embolism upon xylem cutting under tension. Plant Physiol (2015) 167(1):40–3. doi:10.1104/pp.114.249706
13. Garrigues E, Doussan C, Pierret A. Water uptake by plant roots: I – formation and propagation of a water extraction front in mature root systems as evidenced by 2D light transmission imaging. Plant and Soil (2006) 283(1-2):83–98. doi:10.1007/s11104-004-7903-0
14. Song ZY, Yan SH, Zang ZY, Fu Y, Wei DS, Cui HL, et al. Temporal and spatial variability of water status in plant leaves by terahertz imaging. IEEE Trans Terahertz Sci Tech (2018) 8(5):520–7. doi:10.1109/tthz.2018.2851922
15. Pascut FC, Couvreur V, Dietrich D, Leftley N, Reyt G, Boursiac Y, et al. Non-invasive hydrodynamic imaging in plant roots at cellular resolution. Nat Commun (2021) 12(1):4682. doi:10.1038/s41467-021-24913-z
16. Warren JM, Bilheux H, Kang M, Voisin S, Cheng CL, Horita J, et al. Neutron imaging reveals internal plant water dynamics. Plant and Soil (2013) 366(1-2):683–93. doi:10.1007/s11104-012-1579-7
17. Bottomley PA, Rogers HH, Foster TH. NMR imaging shows water distribution and transport in plant root systems in situ. Proc Natl Acad Sci U S A (1986) 83(1):87–9. doi:10.1073/pnas.83.1.87
18. Zwieniecki MA, Melcher PJ, Ahrens ET. Analysis of spatial and temporal dynamics of xylem refilling in Acer rubrum L. using magnetic resonance imaging. Front Plant Sci (2013) 4:265. doi:10.3389/fpls.2013.00265
19. Zubairova US, Kravtsova AY, Romashchenko AV, Pushkareva AA, Doroshkov AV. Particle-based imaging tools revealing water flows in maize nodal vascular plexus. Plants (2022) 11(12):1533. doi:10.3390/plants11121533
20. Kim HK, Lee SJ. Synchrotron X-ray imaging for nondestructive monitoring of sap flow dynamics through xylem vessel elements in rice leaves. New Phytol (2010) 188(4):1085–98. doi:10.1111/j.1469-8137.2010.03424.x
21. Brodersen CR, McElrone AJ, Choat B, Matthews MA, Shackel KA. The dynamics of embolism repair in xylem: In vivo visualizations using high-resolution computed tomography. Plant Physiol (2010) 154(3):1088–95. doi:10.1104/pp.110.162396
22. Ryu J, Hwang BG, Lee SJ. In vivo dynamic analysis of water refilling in embolized xylem vessels of intact Zea mays leaves. Ann Bot (2016) 118(5):1033–42. doi:10.1093/aob/mcw145
23. Knipfer T, Cuneo IF, Brodersen CR, McElrone AJ. In situ visualization of the dynamics in xylem embolism formation and removal in the absence of root pressure: A study on excised grapevine stems. Plant Physiol (2016) 171(2):1024–36. doi:10.1104/pp.16.00136
24. Brodersen CR, Knipfer T, McElrone AJ. In vivo visualization of the final stages of xylem vessel refilling in grapevine (Vitis vinifera) stems. New Phytol (2018) 217(1):117–26. doi:10.1111/nph.14811
25. Gauthey A, Peters JMR, Lopez R, Carins-Murphy MR, Rodriguez-Dominguez CM, Tissue DT, et al. Mechanisms of xylem hydraulic recovery after drought in Eucalyptus saligna. Plant Cel Environ (2022) 45(4):1216–28. doi:10.1111/pce.14265
26. Xue YL, Xiao TQ, Du GH, Tong YJ, Hq L, Deng B, et al. Observation of cavitation and water-refilling processes in plants with X-ray phase contrast microscopy. Nucl Sci Tech (2013) 24(6). doi:10.13538/j.1001-8042/nst.2013.06.001
27. Bouda M, Windt CW, McElrone AJ, Brodersen CR. In vivo pressure gradient heterogeneity increases flow contribution of small diameter vessels in grapevine. Nat Commun (2019) 10(1):5645. doi:10.1038/s41467-019-13673-6
28. Tao SW, He CX, Hao X, Kuang CF, Liu X. Factors affecting the spatial resolution in 2D grating–based X-ray phase contrast imaging. Front Phys (2021) 2021:9. doi:10.3389/fphy.2021.672207
29. Zhang Y, Xie HL, Du GH, Mw X, Xue YL, Xiao TQ. Fast reconstruction of X-ray dynamic micro-CT based on GPU parallel computing. Nucl Tech (2021) 44(06):1–8. doi:10.11889/j.0253-3219.2021.hjs.44.060101
30. Xu L, Chen RC, Du GH, Yang Y, Wang F, Deng B, et al. Anisotropic shrinkage of insect air sacs revealed in vivo by X-ray microtomography. Sci Rep (2016) 6:32380. doi:10.1038/srep32380
31. Xu F, Liu WC, Xiao Y, Dong B, Hu XF, Wu XP. High-speed tomography of local-plasma-induced rapid microwave sintering of aluminum. Appl Phys Lett (2017) 110(10):101904. doi:10.1063/1.4978257
32. Xie HL, Deng B, Du GH, Fu YN, Guo H, Xue YL, et al. Methodology development and application of X-ray imaging beamline at SSRF. Nucl Sci Tech (2020) 31(10):102. doi:10.1007/s41365-020-00805-7
33. Koc MM, Aslan N, Kao AP, Barber AH. Evaluation of X-ray tomography contrast agents: A review of production, protocols, and biological applications. Microsc Res Tech (2019) 82(6):812–48. doi:10.1002/jemt.23225
34. Krause W, Schneider PW. Chemistry of X-ray contrast agents. In: W Krause, editor. Contrast agents II: Optical, ultrasound, X-ray and radiopharmaceutical imaging. Berlin, Heidelberg: Springer Berlin Heidelberg (2002). p. 107–50.
35. Li K. X-ray imaging to complex systems and its application in low-Z materials [dissertation thesis]. Beijing: University of Chinese Academy of Sciences (2021).
36. Wang FX, Zhou PT, Li K, Mamtilahun M, Tang YH, Du GH, et al. Sensitive imaging of intact microvessels in vivo with synchrotron radiation. IUCrJ (2020) 7:793–802. doi:10.1107/S2052252520008234
37. Ju XL, Li K, Yu FC, Xu MW, Deng B, Li B, et al. Move contrast X-ray imaging of electrochemical reaction process in electrolytic cell. Acta Physica Sinica (2022) 71(14):144101. doi:10.7498/aps.71.20220339
38. Xiao TQ, Wang FX, Li K, Xu MW, Ju XL. Move contrast x-ray imaging and its applications. Acta Optica Sinica (2022) 42(11):1134001. doi:10.3788/aos202242.1134001
39. Chen RC, Dreossi D, Mancini L, Menk R, Rigon L, Xiao TQ, et al. Pitre: Software for phase-sensitive X-ray image processing and tomography reconstruction. J Synchrotron Radiat (2012) 19:836–45. doi:10.1107/S0909049512029731
40. Dixon HH. On the ascent of sap. Phil Trans R Soc Lond (B) (1895) 186:563–76. doi:10.1098/rstb.1895.0012
41. Nardini A, Lo Gullo MA, Salleo S. Refilling embolized xylem conduits: Is it a matter of phloem unloading? Plant Sci (2011) 180(4):604–11. doi:10.1016/j.plantsci.2010.12.011
42. Brodersen CR, Roddy AB, Wason JW, McElrone AJ. Functional status of xylem through time. Annu Rev Plant Biol (2019) 70:407–33. doi:10.1146/annurev-arplant-050718-100455
43. Nardini A, Savi T, Trifilò P, Lo Gullo MA. Drought stress and the recovery from xylem embolism in woody plants. Prog Bot (2017) 79:197–231.
44. Brodersen CR, Choat B, Chatelet DS, Shackel KA, Matthews MA, McElrone AJ. Xylem vessel relays contribute to radial connectivity in grapevine stems (Vitis vinifera and V. arizonica; Vitaceae). Am J Bot (2013) 100(2):314–21. doi:10.3732/ajb.1100606
45. Brodersen CR, McElrone AJ, Choat B, Lee EF, Shackel KA, Matthews MA. In vivo visualizations of drought-induced embolism spread in Vitis vinifera. Plant Physiol (2013) 161(4):1820–9. doi:10.1104/pp.112.212712
46. Wason J, Bouda M, Lee EF, McElrone AJ, Phillips RJ, Shackel KA, et al. Xylem network connectivity and embolism spread in grapevine(Vitis vinifera L.). Plant Physiol (2021) 186(1):373–87. doi:10.1093/plphys/kiab045
47. Brodersen CR, Lee EF, Choat B, Jansen S, Phillips RJ, Shackel KA, et al. Automated analysis of three-dimensional xylem networks using high-resolution computed tomography. New Phytol (2011) 191(4):1168–79. doi:10.1111/j.1469-8137.2011.03754.x
48. Hacke UG, Stiller V, Sperry JS, Pittermann J, McCulloh KA. Cavitation fatigue. Embolism and refilling cycles can weaken the cavitation resistance of xylem. Plant Physiol (2001) 125(2):779–86. doi:10.1104/pp.125.2.779
Keywords: move contrast X-ray imaging, agent free imaging, weak signal tracking in complex background, dynamic CT, in situ imaging, water refilling, willow cuttage
Citation: Xu M, Li K, Xue Y, Wang F, Liu Z, Song Z and Xiao T (2023) Water refilling along vessels at initial stage of willow cuttage revealed by move contrast CT. Front. Phys. 11:1174387. doi: 10.3389/fphy.2023.1174387
Received: 26 February 2023; Accepted: 10 April 2023;
Published: 24 April 2023.
Edited by:
Jingying Jiang, Beihang University, ChinaReviewed by:
Xuyao Yu, Tianjin Medical University Cancer Institute and Hospital, ChinaCopyright © 2023 Xu, Li, Xue, Wang, Liu, Song and Xiao. This is an open-access article distributed under the terms of the Creative Commons Attribution License (CC BY). The use, distribution or reproduction in other forums is permitted, provided the original author(s) and the copyright owner(s) are credited and that the original publication in this journal is cited, in accordance with accepted academic practice. No use, distribution or reproduction is permitted which does not comply with these terms.
*Correspondence: Tiqiao Xiao, dHF4aWFvQHNhcmkuYWMuY24=
Disclaimer: All claims expressed in this article are solely those of the authors and do not necessarily represent those of their affiliated organizations, or those of the publisher, the editors and the reviewers. Any product that may be evaluated in this article or claim that may be made by its manufacturer is not guaranteed or endorsed by the publisher.
Research integrity at Frontiers
Learn more about the work of our research integrity team to safeguard the quality of each article we publish.