 Jianghao Rao
 Peng Qin1
 Zhenming Peng
- 1Laboratory of Photoelectric Detection and Signal Processing, Institute of Optics and Electronics, Chinese Academy of Sciences (CAS), Chengdu, China
- 2Key Laboratory of Optical Engineering, Institute of Optics and Electronics, Chinese Academy of Sciences (CAS), Chengdu, China
- 3Information and Communication Engineering, University of Electronic Science and Technology of China, Chengdu, China
During X-ray inspection detection, a detector converts the collected X-rays from objects into electrical signals, which are then transmitted to a computer for image processing and analysis. From the aspect of digital image processing, detection tasks mainly focus on data processing and transformation to identify valuable features, which make the algorithms more effective. The consistent requirement for speed and accuracy in X-ray prohibited item detection is still not fully satisfied, especially in pictures obtained under special imaging conditions. For noisy X-ray images with heavy occlusion, a direct and suitable approach of representation learning is the optimal solution. According to our study, we realized that heterogeneous information fusion from different extraction approaches can be applied effectively to overcome this issue. We proposed two innovative algorithms to extract effective features of X-ray objects to significantly improve the efficiency of X-ray prohibited item detection. The brief model we proposed fuses the representations learned from the noisy X-ray images and outperforms the best model (DOAM-O) so far on OPIXray. Furthermore, the attention module we designed to select information on deep learning and representation strengthens the model; considering this, the model utilizes lesser time for both training and inference, which makes it easier to be trained on a lightweight computing device.
1 Introduction
Security inspection equipment usually adopt an electron accelerator or a ray tube to accelerate electrons to form a high-energy X-ray beam. X-ray security inspection is used to understand the internal structure, density, and composition of objects by X-ray irradiation and detection, which is helpful to identify the presence of suspicious objects. The detected objects can vary in material, density, and composition and have different X-ray absorption, scattering, and transmission characteristics. The detector converts the collected X-rays from the objects into electrical signals, which are then transmitted to a computer for image processing and analysis.
Sameer Singh summarized the applications of signal processing and pattern recognition in image processing to detect the presence of explosives and non-material substances in luggages. Domingo Mery et al. proposed the public dataset GDXray [6] containing 19,407 X-ray images, including five categories of security inspection images, castings, welds, etc.
RoomI m et al. used the fuzzy K-nearest neighbor (FKNN) [7] algorithm to identify pistols in baggage, and the pistol is extracted by a segmentation method. Shape context descriptor and Zernike moment are the traditional extraction methods. In machine learning, the support vector machine (SVM) [8] and random forest can also be used for classification after the bag of visual word (BOVW) [9] is built. This has already been described by Mikolaj E and David Castro.
The aim of these representation learnings is to learn vector representations via convolution layers, and the most existing approaches summarized into unified two-step operators used to extract matrix construction and dimension reduction, such as Network Representation Learning (NRL) [1–4].
One of these methods analyzes the proximity matrix construction step first and then uses the NRL method to build the proximity matrix. Network Embedding Update (NEU) [5] algorithm is used for designing as the modules are made up of convolutional layers. During the training process, the parameters are optimized to approximately higher order proximities to enhance the performance of the model. It is essential to obtain high-quality feature representations to achieve high performance and efficiency in a vision task.
As for noisy X-ray images, some method was proposed [10]. The GDXray dataset contains limited number of images from largely facilitated relevant researches. As the images in the dataset are completely gray-scaled and have repetitive patterns, the items in these images can be easily checked; moreover, the single energy security detector for taking images has been eliminated. After GDXray, SIXray [11] was proposed which contains 19,407 X-ray images that are taken at the actual security inspection places. The dual energy security detector used is still the mainstream means of cargo and baggage security inspection.
A number of detection methods based on convolutional neural networks [12] have been proposed that have produced amazing results in different vision tasks. Most of these models are used for pictures taken under natural conditions; unlike these pictures, the style and characteristics of X-ray images are different. Considering this, we carefully compared the dataset of X-ray images with the dataset for different tasks. In the datasets of common visual tasks [19], objects in the real world contain rich details and generate perspective projection in human eyes and photos. In these kinds of tasks, there is a lack of the details of the objects and the borders take up more importance. Therefore, it is essential to find effective methods for feature extractions to have a balance between the two kinds of features. SIXray aims at the real complicated site, and the dataset still cannot meet actual needs.
According to the characteristics of X-ray images and the ability of convolutional neural network [13–18], the edges and contours of objects in X-ray images play a crucial role in detecting the prohibited items we want to find. In addition, we need to realize that the regions and the semantic information in neural networks are also quite useful at the same time.
There are some achievements in the detection of occluded prohibited items in X-ray images; for example, DOAM [20] has a state-of-the-art performance with occlusion and performs better than other models.
For better representation learning, existing network embedding is used to get the brief and useful low-dimensional vertexes, and most of these are applied in natural language processing (NLP), such as word2vec [21], DeepWalk [22], and node2vec [23]. Network embedding primarily focuses on preserving the microscopic structure of the data but does not consider the special distributions in the data, such as the various data distribution in OPIXray.
We found that the traditional feature extractor contributes the most to the result, and the embedding module can be designed as the extraction operator to suit OPIXray. This kind of representation learning works well and efficiently. Essentially, the CNN models can be combined with the designed representation features: it is easy to be trained, and the fine-tuning [24] is helpful to prompt the models by learning the presentations of something new. This is task-oriented based on the training mechanism of deep learning [25], which is exactly what we are looking for. We proposed the network embedding of edge-region unified architecture for occluded X-ray images; furthermore, we designed the unity attention module of contour and region to improve the performance of network embedding and absorb the SSD (single shot multi-box detector) model [26] into it. Our contributions can be listed as follows:
• We analyzed the high-quality operators and the feature representations first, representing the expressions and discussions for these. Based on these, we developed a high-quality network embedding module that can enhance the detection of prohibited items in the high-quality noisy X-ray dataset named OPIXray.
• We designed a self-attention module based on CNN. This module is also based on the partial supervision mechanism when the whole detector is in the process of training. It trains the model to place more emphasis on the key areas, to make performance of the special task more efficient than other structures. To the best of our knowledge, this is the first work exploiting the partial supervision mechanism to detect prohibited items, which might provide a new way to solve the occlusion problem in noisy X-ray images.
• We combined a deep learning model with the network embedding, named ERU. The self-attention module provides partial supervision during end-to-end training while simultaneously providing information on the shape and material of items. ERU helps refine feature maps of the general detectors, enhancing the performance of the most popular detector. The innovation module ERU outperforms DOAM in both efficiency and mAP.
• Extensive experiments were conducted on the published dataset OPIXray, which is the only dataset for X-ray prohibited item detection. The results demonstrate that our method can drastically boost detection accuracy and achieve the new state-of-the-art performance for this task.
The paper is structured as follows: Section 2 introduces the related work; Section 3 introduces the operators and the attention mechanism we proposed; Section 4 describes and discusses the proposed de-occlusion methodology and the whole training strategy.
2 Related work
2.1 Difference in CNNs
Considering the edge extraction of digital images, the grid function space [27] is a set of functions defined on a given grid point corresponding to the elements in the receptive field [28] and forms a finite dimensional space.
Classical operators such as Robert [29] and Sobel [30] are used to characterize the information on edge and sudden change of context.
Pixel difference convolution (PDC) [31] is a more suitable operator: it introduces differential operation into convolutional neural networks efficiently. According to the sampling strategy of candidate pixel pairs, PDC can be divided into three subforms (shown as follows) which are used to process feature maps.
2.1.1 Pixel difference convolution based on central differences (CPDC)
The subform CPDC [32] is similar to PDC and performs differential operation in the neighborhood based on the center pixel (Figure 1). As aforementioned, differences are calculated first and then the convolution kernels process these differences.
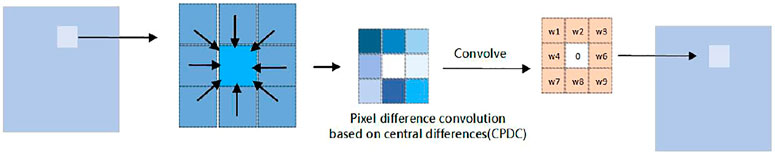
FIGURE 1. Processing of CPDC.
According to the law of multiplicative distribution [33], we can simply crop the feature map without considering the edge region.
Subtracting the cropped feature maps from the convoluted output gives the final CPDC output.
2.1.2 Pixel difference convolution based on angular differences (APDC)
The subform APDC obtains differences in the candidate pixel pairs in the clockwise direction (Figure 2). Just in the same manner analysed above, we can composed it to the twice convolution. The composed calculation cannot share the weights of kernel very well.
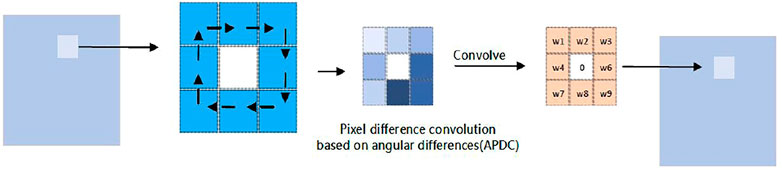
FIGURE 2. Processing of APDC.
The Eq. 3 essentially instead the difference operation, while APDC is not focused on one element like x5 in the equation, which invisibly shuffle the fixed difference templates. We can understand this more clearly using the following formula.
As the receptive fields change with the steps and the kernel size, it is more difficult to transform the position on the inputs. We share the receptive fields and transform the kernel. If we define the receptive field as
and we define
then the formula in Eq. 6 can be rewritten as
The kernels cannot be shared, and we must use two kernels to let it work. At the same time, it should be considered that the gradients can be propagated well, which corresponds to the same original element in the convolution kernel.
2.1.3 Pixel difference convolution based on radial differences (RPDC)
To obtain a bigger receptive field, the subform RPDC differentiates the candidate pixel pairs in the inner ring and outer ring separately for the neighborhood (Figure 3). It can be simply seen as the difference between two ouputs based on the shared convolution kernel with various dilations.
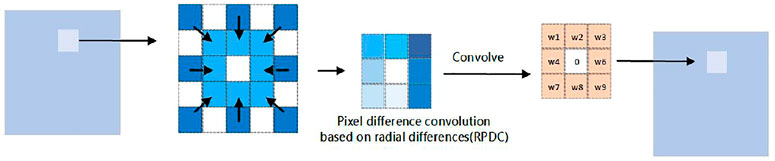
FIGURE 3. Processing of RPDC.
2.2 Pooling in CNNs
2.2.1 The power-average pooling
Conventional max pooling [34] and average pooling [35]methodsare used to obtain the description of colors and areas from feature maps. Power average pooling is a kind of integration of max pooling and average pooling. This kind of pooling uses parameter p to balance the importance of max pooling and average pooling, and the formulation can be written as follows:
It is clear that power average pooling is used to obtain the sum in the neighborhood when p equals 1; max pooling is achieved when p approaches infinity.
2.2.2 Soft-pooling
Soft-pooling is another kind of pooling inspired by cortical neural simulation and early experiments with pooling of hand-coded features [36].
Soft-pooling [37] is different from max pooling; that is, the activation values in the neighborhood will get at least one minimum gradient during back propagation [38].
Soft -pooling uses maximum approximation R in the activation area. Every activation value ai corresponding to i applies weight wi, where weight wi is defined as the ratio between the activated natural exponent and the sum of the activated natural exponents in the neighborhood:
Weights and the corresponding activation play a role in the non-linear transformation [39]. The dominant position in feature map is taken by the activation computation of the formulation.
The output of soft-pooling is obtained by summing all the weighted activation in the neighborhood:
2.3 Convolutional networks for representation
Several convolutional neural network architectures for representation learning have been proposed [40–44] in recent years. The majority of these methods are based on graphs and do not scale to large graphs or are designed for the whole-graph classification [40, 41, 43, 44].
In a given network, network embedding aims to learn representations for vertexes. Some researchers regard network embedding as a part of dimensionality reduction techniques in addition to the aforementioned. To expand the manifold of the data distribution room, where the data lie, Laplacian Eigenmaps (LE) aim to learn vertex representation, Locality Preserving Projections (LPP) [45] learn a linear projection from the feature space to embedding space as a variant of LE, and further develop the model to handle heterogeneous networks [46] building on word2vec.
Following the aforementioned, a vertex’s context is decomposed by LINE [47] into first-order (neighbors) and second-order (two-degree neighbors) proximity. Wang et al. preserved community information in their vertex representations [48].
2.4 Detector for prohibited items in noisy X-ray images
Because of the challenges and the lack of special datasets, there are few CNN models aiming at solving this special problem, and the released benchmark, GDXray, is gray-scaled with simple backgrounds. Thanks to de-occlusion attention network (DOAM) [49], whose performance is state of the art, it contributed the first and high-quality dataset OPIXray focusing on occluded prohibited item detection during security inspection, which allowed for further studies on this.
2.4.1 De-occlusion attention network
The de-occlusion attention network (DOAM) is a plug-and-play module, which simultaneously leverages the different appearance information (shape and material) of items. DOAM helps refine feature maps for general detectors, promoting the performance of most popular detectors.
1) Edge guidance (EG): For each input sample x ∈ X, the edge guidance module first computes the edge images Eh and Ev in horizontal and vertical directions using the convolutional neural network with Sobel operators sh and sv, which denote the horizontal and vertical kernels, respectively. Second, exploiting the aforementioned two results Eh and Ev, it generates a new one; in other words, the entire edge image E of input image x is further generated.
2) Material Awareness (MA): In this kind of dataset, features from regions tend to be important as they can directly represent themselves at any position in the picture; that is, material information is highly reflected in color and texture, completely presenting the total appearance of items and producing the edges due to the conjunction of different regions. Based on the common knowledge that people identify the material of an object according to its color and texture, this module aggregates these two information as so-called aggregated regional information.
3 Self-adaptive operator in network embedding
3.1 Self-adaptive difference algorithm for X-ray objects
Using signals measured by a detector, computers can produce high-resolution X-ray images that show the internal structure and composition of an object. Based on the X-ray images, security personnel can carry out rapid and accurate identification and judgment. Briefly, the physical principle of X-ray security inspection is to transform the transmitted signal into an image through X-ray irradiation and detection of the detected object, and analyze and judge the image information; thus, the goal of identifying and detecting suspicious objects is achieved.
X-rays have a strong ability to penetrate matter. When they penetrate matter, they interact with atoms, especially electrons, and lose energy. Instead of thinking about how X-rays interact with atoms in matter, we focus on the exponential decay of the intensity of the rays.
The intensity of the ray here is the energy passing through the unit cross-sectional area per unit time. The equation is as follows:
X-ray intensity decay can be used for imaging. The intensity of the X-rays decreases as they pass through a suitcase, and since the contents of the suitcase are not evenly distributed, the intensity of the X-rays that pass through the suitcase from different locations will vary. The following equation shows the decay twice in a row when an X-ray passes through something different in the middle.
In the equation, I0 denotes the incident X-ray intensity, I denotes the X-ray emission intensity after penetrating the material, x is the distance of the X-ray traveling through the object, and μ is the linear attenuation coefficient. This equation shows that X-rays penetrate a material with exponential decay.
So, the information provided by gradients can be informative about the saliency of different features [50]. The directions of difference will also influence the abundance of extracted features. Analysis from the comparative study [51].
In the domain of edge detection, classical traditional operators, such as Robert and Sobel, apply the difference information to extract the abrupt changes in gray-level information from images. Different from the fixed difference operators, the proposed operator allows adjusting by itself through the optimization of SGD (stochastic gradient descent) [52], and the final parameters of the operators are a combination of the initialization difference operator and the increments in different directions.
Under usual conditions, the values of the parameters in trained kernels are typically Gaussian distribution [53], which leads to smoothening of the features in the adjacent areas.
In our model, the differences in every direction of the kernels can be calculated. Meanwhile, the parameters of the multi-oriented difference operators are learnable. The operation process of a self-adaptive difference operator is as follows.
Algorithm 1. The operation process of self-adaptive difference operator
1: Require: an X-ray image x ∈ RC×H×W
2: Ensure: the edge image E of the input image x
3: Generate the four difference edge image En (n = 1,2,3,4) by the self-adaptive difference operator;
4:
5: Generate the edge image E by synthesizing En (n = 1,2,3,4);
6: return E;
In the operation process of a self-adaptive difference operator, for each input sample x ∈ R, the initializations of difference operators are designed as follows:
The initializations of the parameters for the difference operators are done in the manner of the aforementioned designed templates. The four templates are D1, D2, D3, D4. Note that these templates are trainable, and the final values of these templates are more suitable for the difference task. We computed the edge images En (n = 1,2,3,4) in different directions using the trained difference operators and obtained four slightly different feature maps.
The outlines in the four feature maps of a same object were similar, but the arrangements of the pixels were differentiated. We synthesized these feature maps to obtain the final feature map containing various arrangements of the pixels in the outlines. The synthesization was accomplished using the measurement of Euclidean distance [54].
Figure 4 shows the process of feature extraction. The different differences in various directions remain the whole outlines. It is almost the same at the first sight, but we can still find some changes in a smaller field of view: the two small patches indicated by dotted arrows in the picture prove that. Most importantly, these small differences can bring about improvements in performance.
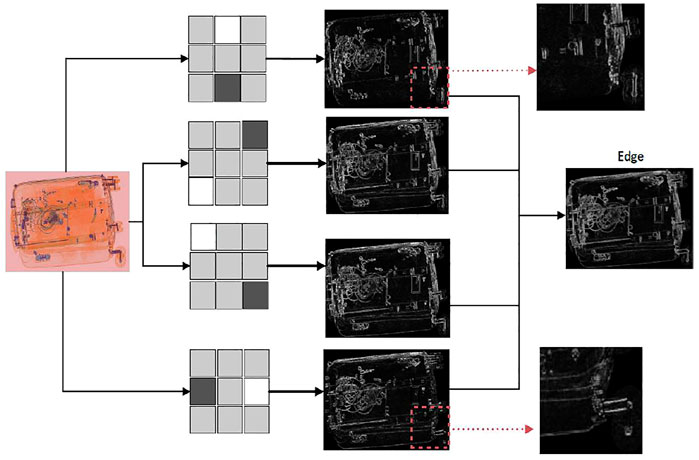
FIGURE 4. Processing of our designed difference operator.
3.2 Self-adaptive pooling algorithm for X-ray object
By detecting the intensity distribution of the transmitted X-ray and converting it into a gray-scale image, we can get an image that can reflect the internal structure of the detected object.
A false-color image is generated by dual-energy X-ray imaging, in which metals, alloys, and hard plastics appear blue, and less dense materials appear green or orange.
If the integrating area in the neighborhood is chosen as C, then I represents the pixels of the input image or feature map. Generally, there are three ways to integrate the feature points. In general pooling, average pooling is better to keep the background by averaging the feature points in the neighborhood. We define function num (⋅), which represents the number of the pixels in the input area, by the following formula:
We define function max (⋅), which represents the maximum value of pixels in the chosen neighborhood. If we replace the previous expression by the newly defined function, the formula can be written as follows:
We reevaluate the numerical distribution of filters mentioned above, for each neighborhood, suppose that the area C is a square and the side length of C is k, then it is obvious that num(C) = k × k:
If P represents the mean filter, Equation 22 can be rewritten as
In order to have a better balance of the input in each neighborhood, we allow the values in P to be adjusted based on the back-propagation gradients when that part is trained. For each channel of the input image, we define mean filters [55] which adjust separately. So, the neighborhood generates three outputs Io1, Io2, Io3. The final output of the neighborhood is calculated as follows:
The factors α, β, γ are learnable based on the back-propagation gradients. We call this operation self-adaptive pooling. The algorithm flowchart is as follows:
Algorithm 2. The operation process of the self-adaptive pooling operator
1: Require: an X-ray image x ∈ RC×H×W
2: Ensure: the pooling image P of the input image x
3: Generate the three pooling image Pn(n = 1,2,3) by the self-adaptive pooling operator;
4:
5: Generate the final pooling image P by synthesizing Pn(n = 1,2,3);
6: return P;
Figure 5 shows the process procedure of SAP. Different channels are processed, and the combination is based on the adaptive algorithm to balance the contribution. Each channel provides the information corresponding to different materials. The pooling operations are not simple to implement or can be used to obtain the maximum value directly. The parameters in the operators are learnable which contribute to the final fusion result, the final fusion result of various materials enlarges the influence of important areas or materials.
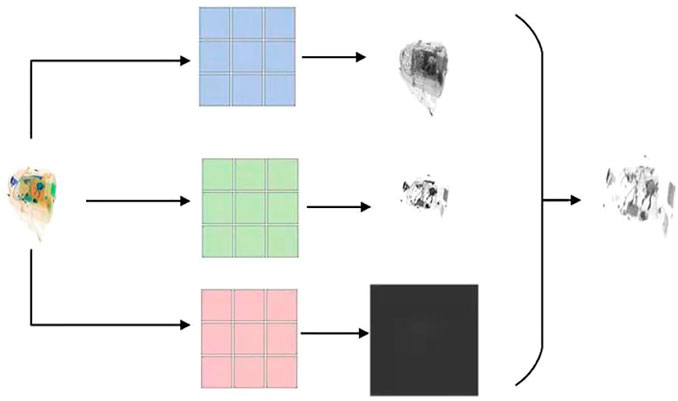
FIGURE 5. Processing of our designed pooling operator.
3.3 Self-attention mask
It is well known that models focus on certain characteristics of the extracted features, or some CNN explainer [56]. At the same time, the initial work in pre-attentive processing identifies basic visual features that capture a viewer’s focus of attention [57]. We designed the self-attention module. While designing attention mechanisms, the attention of different channels and spatial features in a feature map are used to identify the weight of information, which drives the model to focus on the more important information. The attention mechanisms process attention weights for different directions and perform better in computer vision tasks than models lacking these mechanisms.
As is well known, the main role of attention mechanisms [58–63] is to get the most important and useful features by screening through lots of studies. It should be noted that there are some differences between X-ray datasets and other common datasets. In datasets of common visual tasks [64–67], objects in the real world contain rich details and generate perspective projection in the human eyes and photos, whereas in the X-ray datasets there is a lack in details as borders take up more of the influence.
In order to train the light-weight module well and enable the module to focus on the targets we want to detect, we proposed an innovation training strategy (Figure 6).
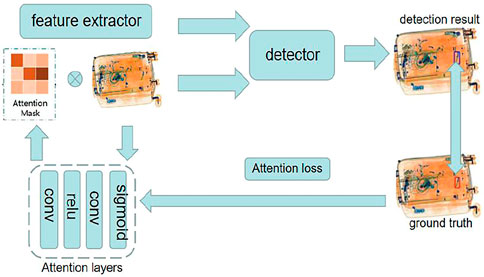
FIGURE 6. Partial supervision for the self-attention mask.
Suppose the input of that module is S, S′ is achieved after the inference of the aforementioned attention module. N is defined as the batch size of training samples, and
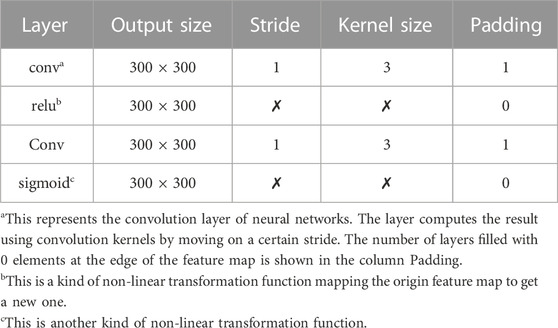
TABLE 1. Architecture of the attention module.
For the attention mask,
F(⋅) returns a map whose shape is the same as the shape of
In reality, adapting the Euclidean distance is not the only way; more importantly, it is not the suitable way. We will discuss this issue in detail in the later experiments. The two kinds of distance in experiments essentially influence the response to the targets at the level of penalty to each pixel except the center point of the object.
Different distances between the coordinate of each element shows how we try to focus the targets. We can see the two kinds of measurements as follows (Figure 7):
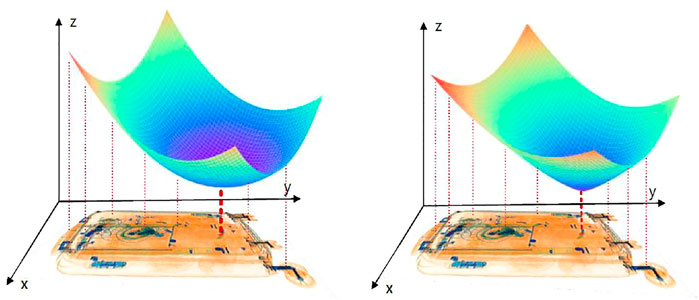
FIGURE 7. Comparison of self-attention masks in different distance measurements.
The Euclidean distance is sharper than the other one in a 3D visualization zone. We will have a clear recognition that Euclidean distance is not a good choice based on the response of our attention layer. Similar to the other attention mechanisms we mentioned, the study has shown that soft-attention mechanism is better not only in value computing but also in the attention mechanism of our task.
The loss of this module will only be calculated in the process of training, when the whole module is in the process of inference, the loss will not be calculated and the operation of the attention module is the all, the operation process is as follow:
Algorithm 3. The operation process of attention module
1: Require: an X-ray image x ∈ RC×H×W; the result of self-adaptive pooling operator P; the result of self-adaptive difference operator E;
2: Ensure: the attention feature map S’ of the input image x;
3: Generate the concatenated S by concatenating X, P, and E;
4: Put S into the attention convolution layer and calculate the output S’;
5: Refine S’ through fs (⋅) return S’;
4 The training process of network embedding
The aforementioned descriptions provide the strength of the module and brief the feature extraction procedure. Our module improves the performance of SSDs (popular detectors based on CNN) in occluded X-ray object detection. Moreover, the module is not only useful but also time-saving in both inference and training. The architecture ERU-SSD is shown in Figure 8.
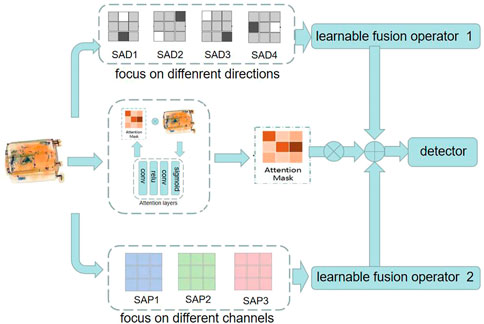
FIGURE 8. Architecture of the unified model.
In the module, back propagation is time-consuming. One of the biggest highlights of the proposed module is that SGD optimization method is used as a role of parameters self-adjustment mostly, the initialization of kernels already stands for the highly effective extractor, the attention mechanism in our module needs few extra parameters.
Our module does not need extra training and supports the end-to-end training mode. All the steps of our algorithm are clear and changeable, which makes the method more flexible. The training process is shown in Algorithm 4.
Algorithm 4. The training process
1: Require: an X-ray image x ∈ RC×H×W;
2: Ensure: trained model;
3: Initialize the four difference operators Dn (⋅), (n = 1,2,3,4);
4: Initialize the pool operator P (⋅);
5: Initialize the attention module A (⋅);
6:
7: Define fd (D1(x),D2(x),D3(x),D4(x)) =
8: Define fe(a) = relu (we⋅a+be);5
9: Define fs(a) = sigmoid(a);
10: Calculate the feature maps Dn(x), (n = 1,2,3,4);
11: Calculate the feature map P(x);
12: Calculate the feature map A(x);
13:
14: for N1 steps do
15: Refine the feature maps Dn(x) through fd (⋅), (n = 1,2,3,4);
16: Refine the feature maps P(x) and A(x) through fe (⋅);
17: end for
18: Generate the concatenated image P by concatenating Dn(x) and P(x), (n = 1,2,3,4);
19: Multiply P with A(x), namely,,P=P×A(x);
20: Refine P through fs (⋅);
21: Put P into detection model and calculate the network output R;
22: Calculate the results of the loss function L (R,G), (G represent the ground-truths corresponding to the image x);
23: Update the parameters of the network by the optimization of SGD; return trained model;
5 Experiments
In this section, we present the extensive experiments conducted to evaluate the model we proposed. In our work, the main aim is to explore a more concise and effective feature extraction mechanism for the detection of occluded prohibited items in X-ray images during security inspection. Only few datasets are open to this kind of research, and there is a lack of concise and effective architectures based on convolutional neural networks. First, we fully analyzed the keys in this task, proposed more flexible and effective extractors that can adjust themselves when they are trained, and also defined the architecture to bring these pieces together. As these extractors complete each other, the designed module works more effectively and efficiently. Second, we performed ablation experiments to completely evaluate the effectiveness of our designed module. Moreover, we verified different ways of calculating the weighted coefficient map. Third, we verified the overall compatibility and effectiveness of our proposed architecture.
Evaluation strategy: All experiments were performed on the OPIXray dataset and trained on the training set in Table 2. Models were tested using the testing set data in Table 2. As for comparing different models and methods in terms of occlusion levels, the models were tested on OL1, OL2, and OL3.
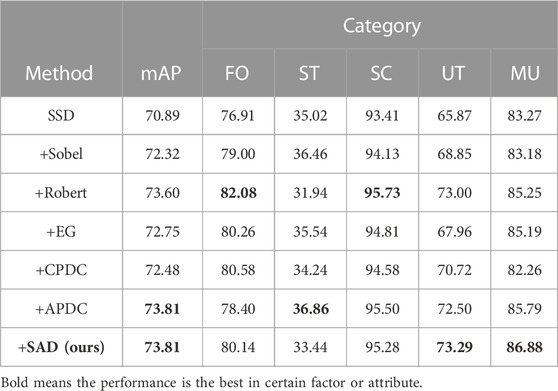
TABLE 2. Performance of SSD with the designed difference operator.
Baseline detail: To make fair comparisons between different models and architectures, we plugged each part into a SSD separately and analyzed the results. Moreover, we fully evaluated the number of parameters in our module and the speed of network training on our model by comparing with the previous model, which is the state of the art in the detection of X-ray objects at various occlusion levels. In the ablation study, we added our module and methods into the SSD one by one and reported the performance of the SSD and the results under different conditions to evaluate the utility of various sub-modules. Lastly, we evaluated the parameters of our model and compared the time consumption of our module with that of the DOAM.
Parameter setting: All through the experiments, the models were optimized using an SGD optimizer with an initial learning rate of 0.0001. The batch size was set to 24, and the momentum and weight decay were set to 0.9 and 0.0005, respectively. We utilized mean average precision (mAP) as the metric to evaluate the performance of the model, and the IOU threshold was set to 0.5. We calculated the AP of each category using the model with the best performance to observe the improvement in different categories. Moreover, to avoid bias in data transformation, no data augmentation technique was used to modify the pixel value of the original image, which led to a better analysis of the impact of our method.
5.1 Comparing with different kinds of difference
We analyzed the difference extractor first. In this aspect, we performed a lot of experiments and reevaluated the influence of difference in the detection task on noisy X-ray images.
The data in Table 2 clearly show that the difference operator, Sobel, greatly influenced the detection result, thus proving the validity and simplicity of the difference algorithm. For a further study, we compared different forms, other difference operators, and the effective module EG was implemented. The results of the experiments revealed that difference operators such as Sobel can significantly improve the performance in this task.
In Table 2, “+Sobel” means the feature map provided for subsequent processing is concatenated by the original input image and the feature is extracted from it using Sobel; the other entries in the table are the same.
Note that “FO,” “ST,” “SC,” “UT,” and “MU” refer to “Folding Knife,” “Straight Knife,” “Scissor,” “Utility Knife,” and “Multi-tool Knife,” respectively. In addition, in the later experiments, “DOAM-T” refers to the model “SSD + DOAM” with traditional training strategy, and “DOAM-O” refers to the model “SSD + DOAM” with over-sampling training strategy. SAD means self-adaptive difference proposed by us.
5.2 Comparing with different kinds of pooling
We compared the variants of pooling and found that soft-pooling and our designed operator in the detector are more flexible while extracting the features of regions. Soft-pooling is similar to softmax, which maps values into a probability space. It is quite suitable for the classification task and for computing the importance when voting is needed, while our task requires more actual region distribution information which is not transformed but extracted or smoothed based on the operator (Table 3).
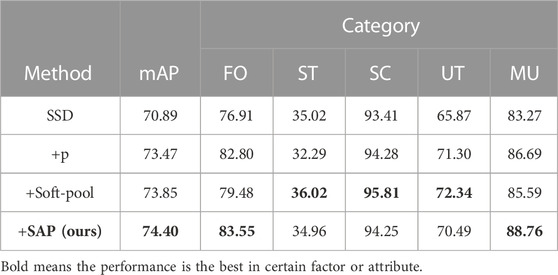
TABLE 3. Performance of SSD with the designed pooling operator.
From the aforementioned experiment, we found that soft-pooling is more flexible than normal pooling, the most obvious reason being that soft-pooling works with more operating procedures, which increases its representation ability when compared with normal pooling.
Similar to the SAD we proposed, SAP is characterized by a direct and brief procedure, so it is clearly more elegant and effective than soft-pooling and can suit this kind of task well depending on the self-adaptive learning mechanism.
5.3 Comparing with other attention mechanisms
We compared three variants of the attention mechanisms, namely, SE, Non-local, and DA (Table 4). Table 2 presents the performances of all models. Note that the attention mask we chose is not based on the Euclidean distance measurement. In our designed module, F (⋅) returns a map whose shape is the same as the input, and F (⋅) refers to the attention layer we designed. The expression of the weighted coefficient map, also regarded as the attention mask, shows its shape in the zone of W (x,y).
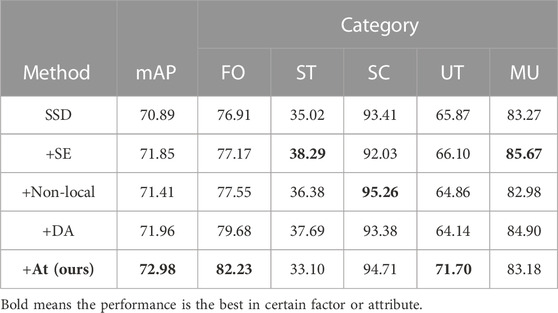
TABLE 4. Comparison of different attention mechanisms.
In the zone of W (x,y), the shape of the following expression is conical:
If we do not use Euclidean distance between the coordinate of each element and the coordinate (xi, yi) as the weighted coefficient, the equation is as follows:
We call the mask based on the aforementioned equation paraboloid mask and conducted it in our experiment. We will provide a detailed representation about the comparison of different masks or the distance measurements in the later experiments.
5.4 Comparing with other architectures
The aforementioned experiments fully proved that the modules we proposed are effective and efficient in the same type comparison. The architecture of the unified model ERU-SSD contains various modules aimed at different aspects. SAP and SAD are the main procedures used to carry out feature extraction before following the detection module. We named the combination of the two as SAPD.
This experiment proves that the extraction mechanism we proposed before the detection module outperforms others; moreover, it can also be seen as the ablation study between the whole model ERU-SSD and the separate module.
Table 5 presents the capability of edge guidance modules and material awareness modules, supporting the specific role of each improvement. “/G” means the neural network layers in the module adopt a gated convolution layer. It is found that a gated convolution layer will weaken the representation of the detection model; on the contrary, the over-sampling strategy will enhance the representation because this training strategy caters to the hard sample requirements. Over-sampling of hard samples is logically useful to a large extent and reasonably effective in improving the performance of the trained model.
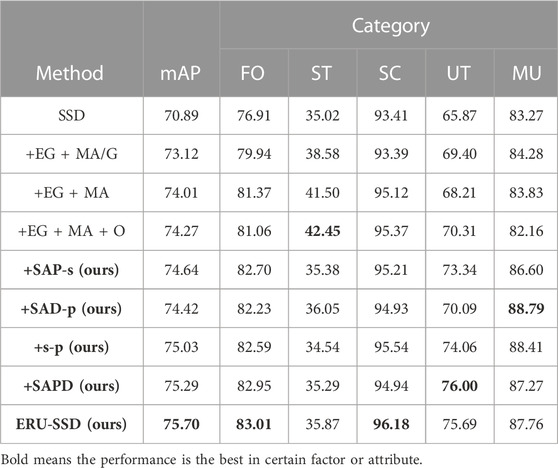
TABLE 5. Performance of SSD with the designed pooling operator.
In addition, the four methods (SAP-s, SAD-p, s-p, and SAPD) in bold in the table are the ablation study of the SAPD. We compared the SAP and SAD separately. “SAP-s” refers to the module combining SAP with average pooling, while “SAD-p” refers to the module combining SAD with sobel. “s-p” means the edge extraction and region extraction are based on the sobel operator and average pooling, both of which are not adjusted when trained. Interestingly, we discovered that unilateral adjustment to these operators will weaken the performance, just like the performance of “SAP-s” and “SAD-p”, is not as good as “s-p.” If we allow the back-propagation gradients to adjust SAP and SAD as we designed, the condition will be changed.
We do abundant comparative experiments about our proposed self-attention mask, attention that, the total loss of the task is designed as
We compared the two attention masks, and the results are as follows (Table 6):
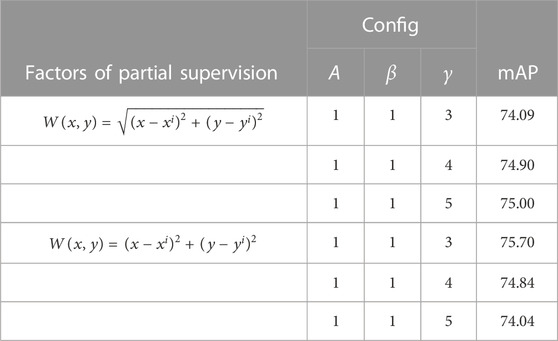
TABLE 6. Influence of the two attention masks under loss function terms with different coefficients.
If we choose the SSD as the detection module and use the attention mask we proposed, the ERU-SSD can be conducted.
Note that the ratio between the loss of attention masks and the other losses during training was chosen as 3. Without other data augmentation manners and auxiliary means, our methods outperformed others. The detection results of our model are shown in Figure 9.
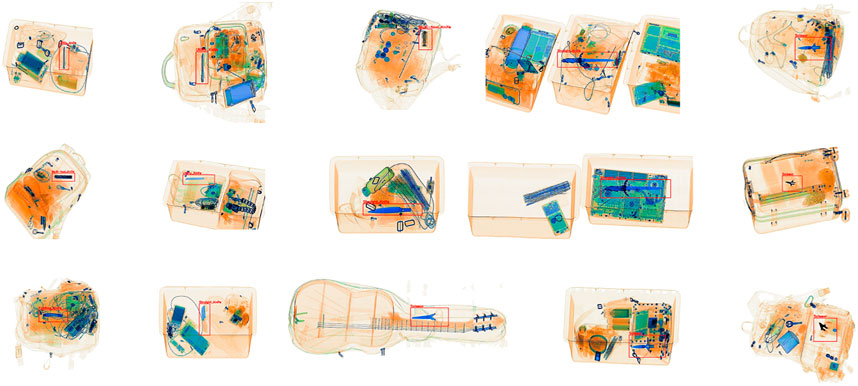
FIGURE 9. Detection results.
5.5 Comparing time consumption in training and inference
Our method is superior to others in performance: the key is to be able to effectively control the size of the model and also be better than others in training and inference.
From the perspective of the work mechanisms, our feature extractor is much simpler than the previous modules containing enough variations. Because of the change in adaptive mechanisms in training, the extractor is flexible and simple. Furthermore, partial supervision exists only in the process of training; during inference, computation exists only in the attention layer.
The training set contains 7,109 images, the set for evaluation contains 1,776 images, and our batch size is 24. For 10 iterations in the condition of GTX1080, the time consumption of “SSD + DOAM” is 4.1778 s, whereas the time consumption of our method is only 0.2472 s, which is significantly less than that of SSD + DOAM. In order to be fully trained and obtain well-performing weights, we trained every model mentioned in the experiments for 67 epochs.
6 Conclusion
In this paper, we presented the network embedding inspired by high-quality operators, which are easily trained and more flexible than others, mainly focusing on occluded prohibited item detection during security inspection. In addition, we introduced abundant analysis and discussed the mechanisms of these operators to know how they work. We combined the deep learning model and the network embedding we proposed and named it ERU, which simultaneously leverages the different appearance information (shape and material) of items. ERU helps the training process refine feature maps for the general detectors, enhancing the performance of the detectors. The self-attention module we designed based on the partial supervision mechanism makes the model learn to put more emphasis on the key areas when the whole detector is in the process of training, which is more important for performing this special task. The innovative ERU-SSD outperforms DOAM-O in both efficiency and mAP on OPIXray. To the best of our knowledge, this is the first work using representation learning with the partial supervision mechanism for prohibited item detection, which might provide deep learning a new way to solve the occlusion problem in noisy X-ray images. We hope that our contributions can promote the development of prohibited item detection in noisy X-ray images. Moreover, the low training expenses make it easier to be trained on a lighter computing device. However, the pattern of the noisy X-ray images cannot be generalized under different imaging conditions and characteristics of objects. In practice, the algorithm needs to be designed according to the actual situation as a targeted solution.
Data availability statement
The Dataset analyzed in this study are subject to the following licenses/restrictions: was supported by the State Key Lab of Software Development Environment (SKLSDE-2020ZX-06). Requests to access these datasets should be directed to Xianglong Liu, eGxsaXVAbmxzZGUuYnVhYS5lZHUuY24=.
Author contributions
JR performed the experiments and the scheme design. PQ performed the experiments. GZ performed the experiments and code review. ML provided foundation support. JZ and QB guided the thesis writing. ZP provided foundation support and guidance in writing. All authors contributed to the article and approved the submitted version.
Funding
This work was supported by the Natural Science Foundation of Sichuan Province of China (Grant No. 2022NSFSC40574) and partially supported by the National Natural Science Foundation of China (Grant Nos. 61775030, 61571096, and 62101529).
Conflict of interest
The authors declare that the research was conducted in the absence of any commercial or financial relationships that could be construed as a potential conflict of interest.
Publisher’s note
All claims expressed in this article are solely those of the authors and do not necessarily represent those of their affiliated organizations, or those of the publisher, the editors, and the reviewers. Any product that may be evaluated in this article, or claim that may be made by its manufacturer, is not guaranteed or endorsed by the publisher.
References
1. Perozzi B, Al-Rfou R, Skiena S (2014).Deepwalk: Online learning of social representations. ACM Proceedings of the 20th ACM SIGKDD international conference on Knowledge discovery and data mining. August 2014.
2. Tang J, Qu M, Wang M, Zhang M, Yan J, Mei Q (2015).Line: Large scale information network embedding. ACM Proceedings of 24th International Conference on World Wide Web. May 2015
3. Cao S, Lu W, Xu Q (2015). p. 891–900.Grarep: Learning graph representations with global structural information. ACM Proceedings of the 24th ACM International on Conference on Information and Knowledge Management. October 2015
4. Grover A, Leskovec J. node2vec: Scalable feature learning for networks (2016). arXiv:1607.00653v1.
5. Yang C, Sun M, Liu Z, Tu C. Fast network embedding enhancement via high order proximity approximation[C]. Int Jt Conf Artif Intelligence (2017) 17:3894–900.
6. Mery D, Riffo V, Zscherpel U, Mandragon G, Lillo I, Zuccar I, et al. GDXray: The database of X-ray images for nondestructive testing[J]. J Nondestructive Eval (2015) 34(4):1–12. doi:10.1007/s10921-015-0315-7
7. Keller JM, Gray MR, Givens JA. A fuzzy K-nearest neighbor algorithm. IEEE Transactions Systems, Man, cybernetics (1985) 15(4):580–5. doi:10.1109/tsmc.1985.6313426
8. Cherkassky V, Ma Y. Practical selection of SVM parameters and noise estimation for SVM regression. Neural networks (2004) 17(1):113–26. doi:10.1016/s0893-6080(03)00169-2
9. Yang Y, Newsam S. (2010). Bag-of-visual-words and spatial extensions for land-use classification[C]. IEEE Proceedings of the 18th SIGSPATIAL international conference on advances in geographic information systems. p. 270–9.
10. Windhager F, Federico P, Schreder G, Glinka K, Dork M, Miksch S, et al. Visualization of cultural heritage collection data: State of the art and future challenges. IEEE Trans visualization Comput graphics (2018) 25(6):2311–30. doi:10.1109/TVCG.2018.2830759
11. Miao C, Xie L, Wan F, et al. (2019). Sixray: A large-scale security inspection x-ray benchmark for prohibited item discovery in overlapping images[C]. IEEE Proceedings of the IEEE/CVF Conference on Computer Vision and Pattern Recognition. p. 2119–28.
12. Abiodun OI, Jantan A, Omolara AE, Dada KV, Mohamed NA, Arshad H. State-of-the-art in artificial neural network applications: A survey. Heliyon (2018) 4(11):e00938. doi:10.1016/j.heliyon.2018.e00938
13. Choo S, Nam CS. Detecting human trust calibration in automation: A convolutional neural network approach[J]. IEEE Trans Human-Machine Syst (2022) 63. doi:10.1177/1071181319631298
14. Haroon U, Ullah A, Hussain T, et al. A multi-stream sequence learning framework for human interaction recognition[J]. IEEE Trans Human-Machine Syst (2022) 52:1. doi:10.1109/THMS.2021.3138708
15. Khushaba RN, Al-Timemy AH, Samuel OW, Scheme E. Myoelectric control with fixed convolution-based time-domain feature extraction: Exploring the spatio–temporal interaction[J]. IEEE Trans Human-Machine Syst (2022) 52:1247. doi:10.1109/THMS.2022.3146053
16. Zhang J, Sun G, Zheng K, Mazhar S, Fu X, Li Y, et al. Ssgnn: A macro and microfacial expression recognition graph neural network combining spatial and spectral domain features[J]. IEEE Trans Human-Machine Syst (2022) 52:747. doi:10.1109/THMS.2022.3163211
17. Lee TH, Kim S, Kim T, Kim J, Lee H. Virtual keyboards with real-time and robust deep learning-based gesture recognition[J]. IEEE Trans Human-Machine Syst (2022) 52:725–35.
18. Kotas MP, Piela M, Contreras-Ortiz SH Modified spatio-temporal matched filtering for brain responses classification. IEEE Trans Human-Machine Syst (2022) 52:677–86. doi:10.1109/THMS.2022.3168421
19. Voulodimos A, Doulamis N, Doulamis A, Protopapadakis E. Deep learning for computer vision: A brief review[J]. Comput intelligence Neurosci (2018) 2018. doi:10.1155/2018/7068349
20. Tao R, Wei Y, Li H, Liu A, Ding Y, Qin H, et al. Over-sampling de-occlusion attention network for prohibited items detection in noisy X-ray images[J] (2021). arXiv preprint arXiv:2103.00809.
21. Mikolov T, Chen K, Corrado G, Dean J Efficient estimation of word representations in vector space. In: NIPS’13 (2013). p. 3111–9.
22. Perozzi B, Al-Rfou R, Skiena S Deepwalk: Online learning of social representations. In: KDD’14 (2014). p. 701–10.
23. Grover A, Leskovec J node2vec: Scalable feature learning for networks. In: KDD’16 (2016). p. 855–64. doi:10.1145/2939672.2939754
24. Tajbakhsh N, Shin JY, Gurudu SR, Hurst RT, Kendall CB, Gotway MB, et al. Convolutional neural networks for medical image analysis: Full training or fine tuning?[J]. IEEE Trans Med Imaging (2016) 35(5):1299–312. doi:10.1109/tmi.2016.2535302
25. LeCun Y, Bengio Y, Hinton G. Deep learning. nature (2015) 521(7553):436–44. doi:10.1038/nature14539
26. Liu W, Anguelov D, Erhan D, Szegedy C, Reed S, Fu CY, et al. Ssd: Single shot multibox detector[C]. In: European conference on computer vision. Cham: Springer (2016). p. 21–37.
27. Fattal E, Baer R, Kosloff R. Phase space approach for optimizing grid representations: The mapped Fourier method. Phys Rev E (1996) 53(1):1217–27. doi:10.1103/physreve.53.1217
28. Hubel DH, Wiesel TN. Receptive fields and functional architecture of monkey striate cortex. J Physiol (1968) 195(1):215–43. doi:10.1113/jphysiol.1968.sp008455
29. Chaple GN, Daruwala RD, Gofane MS (2015). Comparisions of Robert, Prewitt, Sobel operator based edge detection methods for real time uses on FPGA[C]. IEEE Proceeding of the 2015 International Conference on Technologies for Sustainable Development (ICTSD). p. 1–4.
30. Ahmed AS. Comparative study among Sobel, Prewitt and Canny edge detection operators used in image processing[J]. J Theor Appl Inf Technol (2018) 96(19):6517–25.
31. Su Z, Liu W, Yu Z, Hu D, Liao Q, Tian Q, et al. (2021). Pixel difference networks for efficient edge detection[C]. IEEE Proceedings of the IEEE/CVF International Conference on Computer Vision. p. 5117–27.
32. Yu Z, Zhao C, Wang Z, Su Z, Qin Y, Li X, et al. (2020). Searching central difference convolutional networks for face anti-spoofing[C]. IEEE Proceedings of the IEEE/CVF Conference on Computer Vision and Pattern Recognition. p. 5295–305.
33. Otter R. The multiplicative process. Ann Math Stat (1949) 20(2):206–24. doi:10.1214/aoms/1177730031
34. Nagi J, Ducatelle F, Di Caro GA, Ciresan D, Meier U, Giusti A, et al. (2011). Max-pooling convolutional neural networks for vision-based hand gesture recognition[C]. IEEE Proceeding of the 2011 IEEE international conference on signal and image processing applications (ICSIPA). p. 342–7. November 2011. Kuala Lumpur, Malaysia
35. Yang J, Xie F, Fan H, Jiang Z, Liu J. Classification for dermoscopy images using convolutional neural networks based on region average pooling. IEEE Access (2018) 6:65130–8. doi:10.1109/access.2018.2877587
36. Schnier T, Gero JS. Learning genetic representations as alternative to hand-coded shape grammars[M]. In: Artificial intelligence in Design’96. Dordrecht: Springer (1996). p. 39–57.
37. Kulkarni P, Jurie F, Zepeda J, Perez P, Chevallier L. Spleap: Soft pooling of learned parts for image classification[C]. In: European conference on computer vision. Cham: Springer (2016). p. 329–45.
38. Hecht-Nielsen R Theory of the backpropagation neural network[M]. In: Neural networks for perception. Academic Press (1992). p. 65–93.
39. Levin D. Development of non-linear transformations for improving convergence of sequences. Int J Comput Maths (1972) 3(1-4):371–88. doi:10.1080/00207167308803075
40. Bruna J, Zaremba W, Szlam A, LeCun Y Spectral networks and locally connected networks on graphs. In: Iclr (2014).
41. Defferrard M, Bresson X, Vandergheynst P Convolutional neural networks on graphs with fast localized spectral fifiltering. In: NIPS (2016).
42. Duvenaud DK, Maclaurin D, Iparraguirre J, Bombarell R, Hirzel T, Aspuru-Guzik A, et al. Convolutional networks on graphs for learning molecular fifingerprints. In: NIPS (2015).
43. Kipf TN, Welling M Semi-supervised classifification with graph convolutional networks. In: Iclr (2016).
44. Niepert M, Ahmed M, Kutzkov K (2016).Learning convolutional neural networks for graphs. Proceedings of the 33 rd International Conference on Machine Learning. New York, NY, USA: ICML.
45. Kipf TN, Welling M Variational graph auto-encoders. In: NIPS workshop on bayesian deep learning (2016).
46. He X, Yan S, Hu Y, Niyogi P, Zhang H Face recognition using laplacianfaces. IEEE Trans Pattern Anal Machine Intelligence (2005) 27(3):328–40. doi:10.1109/tpami.2005.55
47. Dong Y, Chawla N, Swami A metapath2vec: Scalable representation learning for heterogeneous networks KDD’17, 135–144[Faloutsos, Faloutsos, and Faloutsos 1999] Faloutsos, M; Faloutsos, P; and Faloutsos, C 1999 On power-law relationships of the internet topology. COMPUTCOMMUN REV (2017) 29:251–62.
48. Tang J, Qu M, Wang M, Zhang M, Yan J, Mei Q Line: Large-scale information network embedding. In: WWW’15 (2015). p. 1067–77.
49. Renshuai T, Yanlu W, Hainan L, Aishan L, Yifu D, Haotong Q, et al. Over-sampling de-occlusion attention network for prohibited items detection in noisy X-ray images (2021). arXiv preprint arXiv:2103.00809.
50. Wexler J, Pushkarna M, Bolukbasi T, Wattenberg M, Viegas F, &Wilson J. The what-if tool: Interactive probing of machine learning models. IEEE Trans Visualization Comput Graphics (2019) 1:56–65. doi:10.1109/tvcg.2019.2934619
51. Ojala T, Pietikäinen M, Harwood D. A comparative study of texture measures with classification based on featured distributions. J Pattern Recognition (1996) 29(1):51–9. doi:10.1016/0031-3203(95)00067-4
52. Bottou L. In: Neural networks: Tricks of the trade. Berlin, Heidelberg: Springer (2012). p. 421–36.Stochastic gradient descent tricks[M]
53. Goodman NR Statistical analysis based on a certain multivariate complex Gaussian distribution (an introduction). Ann Math Stat (1963) 34(1):152–77. doi:10.1214/aoms/1177704250
54. Wang L, Zhang Y, Feng J. On the Euclidean distance of images. IEEE Trans pattern Anal machine intelligence (2005) 27(8):1334–9. doi:10.1109/TPAMI.2005.165
55. Zhang X, Xiong Y. Impulse noise removal using directional difference based noise detector and adaptive weighted mean filter. IEEE Signal Processing Letters (2009) 16(4):295–8. doi:10.1109/lsp.2009.2014293
56. Wang ZJ, Turko R, Shaikh O, Park H, Das N, Hohman F, et al. CNN explainer: Learning convolutional neural networks with interactive visualization. IEEE Trans Visualization Comput Graphics (2020) 27(2):1396–406. doi:10.1109/TVCG.2020.3030418
57. Healey CG, Enns JT Attention and visual memory in visualization and computer graphics. IEEE Trans Visualization Comput Graphics (2012) 18(7):1170–88. doi:10.1109/tvcg.2011.127
58. Fukui H, Hirakawa T, Yamashita T, Fujiyoshi H (2019). Attention branch network: Learning of attention mechanism for visual explanation[C]. IEEE Proceedings of the IEEE/CVF conference on computer vision and pattern recognition. p. 10705–14.
59. Yan C, Tu Y, Wang X, Zhang Y, Hao X, Zhang Y, et al. Stat: Spatial-temporal attention mechanism for video captioning[J]. IEEE Trans multimedia (2019) 22(1):229–41. doi:10.1109/TMM.2019.2924576
60. Niu Z, Zhong G, Yu H. A review on the attention mechanism of deep learning. Neurocomputing (2021) 452:48–62. doi:10.1016/j.neucom.2021.03.091
61. Choi E, Bahadori MT, Sun J, Kulas J, Schuetz A, Stewart WF. Retain: An interpretable predictive model for healthcare using reverse time attention mechanism. In: Advances in neural information processing systems (2016). p. 29.
62. Liu G, Guo J. Bidirectional LSTM with attention mechanism and convolutional layer for text classification. Neurocomputing (2019) 337:325–38. doi:10.1016/j.neucom.2019.01.078
63. Firat O, Cho K, Bengio Y. Multi-way, multilingual neural machine translation with a shared attention mechanism. arXiv preprint arXiv:1601.01073, 2016.
64. Guo Y, Liu Y, Oerlemans A, Lao S, Wu S, Lew MS. Deep learning for visual understanding: A review. Neurocomputing (2016) 187:27–48. doi:10.1016/j.neucom.2015.09.116
65. Zhang Q, Zhu SC. Visual interpretability for deep learning: A survey. Front Inf Technol Electron Eng (2018) 19(1):27–39. doi:10.1631/fitee.1700808
66. Belouadah E, Popescu A, Kanellos I. A comprehensive study of class incremental learning algorithms for visual tasks. Neural Networks (2021) 135:38–54. doi:10.1016/j.neunet.2020.12.003
Keywords: deep learning, representation learning, object detection, X-ray security inspection, combination
Citation: Rao J, Qin P, Zhou G, Li M, Zhang J, Bao Q and Peng Z (2023) Combination of deep learning with representation learning in X-ray prohibited item detection. Front. Phys. 11:1174220. doi: 10.3389/fphy.2023.1174220
Received: 26 February 2023; Accepted: 09 May 2023;
Published: 21 June 2023.
Edited by:
Feng Xu, Nanjing University of Posts and Telecommunications, ChinaCopyright © 2023 Rao, Qin, Zhou, Li, Zhang, Bao and Peng. This is an open-access article distributed under the terms of the Creative Commons Attribution License (CC BY). The use, distribution or reproduction in other forums is permitted, provided the original author(s) and the copyright owner(s) are credited and that the original publication in this journal is cited, in accordance with accepted academic practice. No use, distribution or reproduction is permitted which does not comply with these terms.
*Correspondence: Qiliang Bao, Y29udHJvbEBpb2UuYWMuY24=; Zhenming Peng, em1wZW5nQHVlc3RjLmVkdS5jbg==