- Jiangsu Key Laboratory of Networked Collective Intelligence, School of Mathematics, Southeast University, Nanjing, China
Vital nodes identification is the problem of identifying the most significant nodes in complex networks, which is crucial in understanding the property of the networks and has applications in various fields such as pandemic controlling and energy saving. Traditional methods mainly focus on some types of centrality indices, which have restricted application cases. To improve the flexibility of the process and enable simultaneous multiple nodes mining, a deep learning-based vital nodes identification algorithm is proposed in this study, where we train the influence score of each node by using a set of nodes to approximate the rest of the network via the graph convolutional network. Experiments are conducted with generated data to justify the effectiveness of the proposed algorithm. The experimental results show that the proposed method outperforms the traditional ways in adaptability and accuracy to recover the dynamical process of networked system under different classes of network structure.
1 Introduction
The last decade has witnessed great advances in complex networks from diverse branches of science. In complex networks, elements like nodes and edges have explicit functions, which arouses increasing interest among researchers in the last decade. A typical problem in this field is known as vital nodes identification, which uncovers the properties of nodes that contain the most significant information in the network. As the nodes in the network have different numbers of connections, distances from each other, their abilities in affecting other nodes and the whole network differ to a large extent. Among all the nodes in a network, there exist some nodes containing relatively more information about the network, thus reaching the best recovery of the network when some data are missing, which we call vital nodes. Due to the nice properties of vital nodes, this problem has practical applications in various domains. Firstly, vital nodes identification helps in identifying critical locations in transportation networks such as airports, train stations, and bus terminals, improving the overall resilience of the network. Secondly, it can also identify critical components of power grids, such as transformers and substations, which are important for maintaining the stability and reliability of the grid. Thirdly, vital nodes identification does help in identifying influential individuals in social networks, such as key opinion leaders and social hubs. Understanding the role of these individuals can help in designing effective marketing campaigns and social interventions. In addition, by identifying vital nodes, such as individuals or locations that are likely to play a significant role in the transmission of infectious diseases, effective strategies for disease control and prevention can be designed.
However, the method to identify these vital nodes is not trivial due to the diverse criteria for quantifying vital nodes. Therefore, it is impossible to find a universal indicator that best defines the significance of a node. Moreover, most known methods only deal with individual vital nodes, rather than a set of nodes, which lack real-world applications. Therefore, identifying a set of influential nodes is a significant yet challenging problem.
The traditional approaches mostly identify the vital nodes by some defined centrality indices. Up to now, many classical indices have been proposed which can be mainly separated into two categories, structural centralities including degree centrality, LocalRank [1], K-shell [2], eccentricity [3], closeness centrality [4] betweenness centrality [5], and iterative refinement centralities including eigenvector centrality [6], PageRank [7], etc. However, centrality is only capable of identifying one node at a time, which lacks practical application. To enable multiple nodes identification simultaneously, we found the solutions to influence maximization problems (IMP) can be applied to our problem. Solutions to IMP identify a set of vital nodes subject to the global maximal influence of the nodes on the whole network, however, these methods also suffer from time complexity and high computational costs. To improve the generality and simplify the process, along with the current prosperity of machine learning, algorithms based on machine learning were proposed. Recently, a machine learning-based approach was invented [8], which shows improved adaptability to various settings and dynamics compared to the previous methods. However, the approximation ability of support vector machines (SVM) involved in it is limited, and it does not specifically deal with graph data.
Inspired by the learning-based method and the better ability of graph convolutional networks (GCN) to deal with graph data, we proposed a deep learning-based, data-driven approach. Deep learning-based methods are rarely applied in vital nodes identification before. The mainstream approaches to the problem are mainly composed of centrality-based methods or influence maximization algorithms. However, a deep learning-based method does provide a powerful and flexible approach to this problem, with potential advantages in accuracy, scalability, adaptability. Firstly, a deep learning-based method leverages complex nonlinear relationships in the network data to identify vital nodes, with greater accuracy than traditional methods. Secondly, a deep learning-based method can handle large-scale complex networks with millions of nodes and edges, which would be challenging or impossible for other methods. Also, a deep learning-based method can adapt to changes in the network structure over time, making them more suitable for dynamic networks. In our model, the score of each node that reflects its importance is to be learned, which implements the encoder. During each update, we use the selected temporary vital nodes to restore the original network by GCN, which serves as the decoder. The training consists of two main parts: top-k transformation and data restoration. In the top-k transformation part, we apply a differentiable top-k algorithm [9] to select the most significant nodes of a specified number, which supports the backpropagation.
2 Related work
In this section, we present some related studies in vital nodes identification from the literature. We first review the classical algorithms based on centralities that identify a single node at a time. On the basis of that, to enable the identification of multiple vital nodes at a time, we review the solutions to influence maximization problems (IMP). To improve the generality for various conditions and cut down the computational cost, an algorithm based on machine learning was introduced, which inspired the invention of our method.
2.1 Centrality-based algorithms
The benchmark centralities can be categorized into two types, structural centralities and iterative refinement centralities [10].
2.1.1 Structural centralities
Structural centralities are the most fundamental indices which utilize the structural information without considering any dynamical processes. Because the importance of a node implies its ability to impact the behaviors of its neighbors, the most direct algorithm is to count the number of neighbors as the index of significance, which is called degree centrality. Degree centrality performs well due to its simplicity and low computational complexity. However, the degree centrality sometimes lacks accuracy because of the limited information. Therefore, Chen et al. [1]presents an improved algorithm, LocalRank, which takes in the information of the fourth-order neighbors of each node. The LocalRank algorithm comes in a reduced complexity than degree centrality but is limited to certain circumstances. Moreover, Kitsak et al. [2] argued that the location of a node rather than its neighbors is more significant to its influence, thus proposing coreness obtained by K-shell decomposition to be a more accurate centrality.
The above three indices are neighborhood-based centralities, however, information dissemination should also be considered in the identification of vital nodes. Since a node that potentially spreads the information faster and further is more vital, the distances between a vital node and its neighbors are expected to be shorter, resulting in a better path of propagation. Hage et al. [3] proposed a path-based centrality named Eccentricity centrality (EC). The eccentricity of a node vi is defined as the maximal distance of all the shortest paths to other nodes. However, eccentricity centrality is quite sensitive to unusual paths. Then, closeness centrality was proposed to address this problem. It is defined as the inverse of the average distance from node vi to other nodes, thus summarizing the properties of all the distances. However, when it comes to dynamic large-scale networks, methods based on closeness centrality tend to be time-consuming and have high computational complexity. Salavati et al. [11]proposed an improved closeness centrality which mainly considers the local structure of nodes. In this algorithm, a set of the most influential nodes for each community are selected, with and without considering the interconnection between communities, respectively. Afterward, the final vital nodes are obtained among the candidates by sorting and ranking according to closeness centrality. To reach a more comprehensive state, the potential power of a node to control the information flow should also be counted, that is how betweenness centrality was proposed. The betweenness centrality of a node i is the summation of the proportion of the number of paths that pass through node i among all the shortest paths between any other two nodes in the network.
2.1.2 Iterative refinement centralities
To better study the structural properties, iterative refinement centralities were proposed which utilize the dynamical processes and iterative methods along with the structural information. They have improved performance by considering the mutual enhancement effect between a node and its neighbors, the most representative examples among which are eigenvector centrality and PageRank. The eigenvector centrality of a node i is in relation to the summation of the eigenvector centralities of all connected nodes, which takes the influence of neighbors into consideration. Moreover, the index can be applied to more complex graphs as well. Tudisco et al. [12]performed a vital nodes mining operation based on eigenvalue centrality and showed that the approach can also be extended at little cost to the general hypergraphs. As a variant of eigenvector centrality mentioned above, PageRank has famous applications for website ranking. PageRank conducts random walking on the network and calculates PR values of nodes till they converge. Inspired by this, Liu et al. [13]proposed an improved version called Edge-Centrality-Preferential Ranking (ECP-Rank), which considered the tendentiousness of the random walker in the real world. In this method, the possibility of a random walker’s movement from one node to another is proportional to the centrality score of the corresponding edge assigned by a link prediction index, which results in higher accuracy in real-world problems. Therefore, the improved algorithm is a hybrid strategy combining both edge centrality and vertex centrality, outperforming the traditional ones.
The centralities discussed above are only capable to identify one node at a time, which lacks practical application. The following review of IMP satisfies our need to identify multiple nodes at a time.
2.2 Influence maximization problems
Instead of directly choosing k most influential individual nodes to form the target set, which may result in inefficiency when nodes of the highest degrees cluster in the network, influence maximization problems (IMP) focus on multiple influential nodes in the network, whose solutions can be applied to identifying vital nodes. It is first formulated by Kempe et al. in 2003 [14] as a combinatorial optimization problem and was originally raised as the task to identify a subset of nodes in a network, the influence of which reach the most number of nodes in the network. The influence here refers to anything that can be propagated through connected nodes, such as information, behaviors, etc. The problem has various applications in viral marketing, preventing disease spreading, and so on. Unlike some methods based on centralities that only identify one node at a time, IMP aims to find a k sized set of nodes (the seed set) with the maximum influence spread, which is represented by the influence function σ(⋅). However, the IMP is NP-hard under diffusion models such as IC, LT, TR, CT, etc., and existing methods are mainly categorized into greedy-based algorithms, heuristic-based algorithms, and community-based algorithms, which are discussed in detail below.
Greedy-based algorithms are mostly used in hard optimization problems, which are based on general greedy algorithms in the earliest stage. Some of the examples are General Greedy [14], CELF [15], StaticGreedy [16]and SMG [17]. The main idea of the greedy algorithm is to repeat Monte Carlo simulation to calculate the influence speed. In each round of the simulation, we find the most influential node and add it to the optimal set (the seed set), then find the node with the next greatest marginal influence and repeat the process till k nodes are found. In most cases, greedy algorithms provide accurate approximations. Based on this, Tang et al. [18]proposed an improved strategy for influence maximization which conducts discrete particle swarm optimization based on the topology of the network.
On the other side, an abundance of heuristic algorithms has been designed, which yield near-optimal results of hard optimization problems at a relatively high speed compared to greedy algorithms. Some of the examples are High Degree [14], VoteRank [19], LIR [20], HybridRank [21]. The main idea is to study the topological features of the graph to identify seed nodes. Based on this, He et al. [22]proposed a 3-hop heuristic algorithm for influential maximization for opinion formation (IMOF) in social networks. Recently, Zhang et al. [23]proposed a heuristic leader fake labeling mechanism for IMP which generates node labels to help select vital nodes. The method shows high efficiency over some latest heuristic IMP algorithms.
However, greedy-based algorithms are time-consuming to reach an accurate result, especially in large-scale networks with a large propagation probability. On the other side, heuristic algorithms suffer from great memory costs and risk falling into local optimal points. To confront this, meta-heuristic algorithms were proposed, which yield locally optimal solutions in various networks. Algorithms as SA [24], DPSO [25], GWIM [26] are some examples. The main idea is using expected diffusion value as a cost function with less complexity and initializing population with candidate nodes, together with some discretization rules and operators [27]. Tang et al. [28] supported the efficiency of meta-heuristics by designing a discrete shuffled frog-leaping algorithm based on swarm intelligence.
To further improve the scalability of various types of graphs, community-based algorithms have been presented to tackle IMP, which is based on the common interests between nodes in each community. Some of the examples are CGA [29], CoFIM [30], C2IM [31], ComBIM [32]. The main idea is to eliminate unsuitable communities to reduce computational costs. Inspired by this, Huang et al. [33] proposed a new community-based method and applied it to viral marketing. Their innovative point is to combine conventional community detection and influence diffusion modeling to improve quality.
2.3 Learning-based method
Although IMP aims to identify multiple nodes at a time, it suffers from high computational costs and limit on specific settings and dynamics. To reach higher adaptability to various conditions, the growing power of machine learning can be applied. Recently, Rezaei et al. [8] proposed a machine learning-based, data-driven approach to vital nodes identification, which trains the model where a small portion of nodes predicts the rest of the nodes with support vector regression machine (SVM) with RBF kernel. It reaches more adaptability to changing dynamic parameters, has stable performance across different influence probabilities, and high uniqueness of ranking. However, SVM has limited performance on approximation and does not specifically deal with graph data. Therefore, in view of the excellent ability of GCN to handle graph data and the greater power of deep learning, we combine deep learning and GCN to design our model.
3 Methodology
Inspired by the advantages and defects of the above methods, we proposed a novel deep learning-based algorithm for mining multiple vital nodes. The encoder focuses on a learnable parameter containing the scores of all the nodes which reflect their influence on the network. The corresponding nodes of the top k scores are considered the temporary vital nodes, which are extracted by a differentiable top-k algorithm. The decoder is implemented by GCN, which restores the missing information based on the selected temporary vital nodes. Then we train the model by minimizing the reconstruction error of approximating the original data by the generated data. The proposed algorithm consists of two parts: Spatio-temporal data acquisition and vital nodes selection, which can be further elaborated into two stages: top-k transformation, and data restoration. To better explain the process, we list the symbols used in our algorithm in Table 1.
3.1 Preparation
We use a graph G(V, E) to denote the network, where V is the set of nodes, and E is the set of edges. V* represents the temporary set of vital nodes, and the adjacency matrix A shows the connection between nodes, i.e., the element of A is 1 if the two nodes are connected, and 0 otherwise. We assume there are N nodes in the network, n out of which are vital nodes. We use a m × 1 vector
If we combine Xi of all the nodes, we can get a N × m × L tensor, denoted as X,
Since a node is unable to impact an unconnected node, in order to look into the relationship between the variance of one particular set of nodes and the feature of other nodes, we need to observe the changes in the feature of the network in a period of time. Starting from time t, when assuming the observation interval is l, we can define the score tensor of all nodes observed in t to t + l as follows:
Further, we can denote the version with only the vital nodes as follows:
We notice that if there exists a set of nodes whose features effectively indicate those of other nodes in the network, then we can draw the conclusion that the certain set of nodes includes more information about the network than other random nodes. In other words, the changes in features of the other nodes in the network have the most correlation with a certain set of nodes. Therefore, these particular nodes are the most influential in the network, called the vital nodes. Let
3.2 Spatio-temporal data acquisition
The acquisition of spatio-temporal data can be separated into two scenarios, one with observed data and one not. When the observed data is available, we only need to split the observed data into L sections. Otherwise, if we only have access to the topology of the network without the corresponding observed data, we can apply the dynamical model in complex networks to generate the observed data. Here is a brief introduction to the dynamical model in complex networks:
Assume that the eigenvector of node i is
where f determines the intrinsic dynamics of the node, which is the evolution regularity of the network where there is no connected node for node i or the adjacency matrix for node i is A = O. g denotes the contribution of each edge, which is the coupling between different nodes. Based on this, we can choose suitable functions f and G to generate the data in the network for further vital nodes mining according to the type of the network or the problem we are looking at. For example, if we are to study the possible group of vital spreaders in some kind of epidemic, then we can generate the data with the epidemic model of the network.
3.3 Vital nodes selection
Vital nodes selection comes in two separate stages: top-k transformation implemented in the encoder, and data restoration, which serves as the decoder.
The node selection is conducted on a set of n-dimensional vectors, each element within which represents the score of the corresponding node, where a higher score indicates a greater significance of the node. Throughout the experiments, we found that the choice of the initial node scores does not affect the final convergence, therefore, the choice can be random. Then we select the temporary vital nodes with the top scores, whose information is preserved while all others are ignored. Afterward, the topological information concerning the connections in the network and the attribute information concerning the choice of vital nodes are utilized to restore the original data, which are compared to the real data to calculate the reconstruction error. Last, we use backward propagation to do the training. During the training process, each score is updated in every iteration, giving higher scores to the more influential nodes, till the scores converge. Then the n nodes which score the most are considered the n most significant nodes in the network. Figure 1 shows the framework of node selection. The top-k transformation and data restoration stages are discussed in detail below.
3.3.1 Top-k transformation stage
During the top-k transformation stage, we aim to restore the ignored data with only the information of the temporary vital nodes, which involves locating the top scores of nodes by top-k algorithms. To screen the required data, We transform X(t) as below:
where ⊙ denotes the element-wise multiplication of two matrices. The process above which preserves the information of only the vital nodes is named top-k transformation, which is supported by top-k algorithms.
However, the normal top-k operation is neither differentiable nor continuous, which results in the problem in the above transformation that the derivative of almost every point is zero, in other words, the transformation is not differentiable on most objectives, hence there are no gradients passed into the backward propagation for the training process. This results in the failure to update each node’s score. Therefore, we adopt the differentiable top-k algorithm proposed by Xie et al. [9]. The differentiable top-k algorithm is an approach that enables the selection of the top k elements of a vector in a differentiable manner. In the proposed approach, the differentiable top-k algorithm is used to identify the most important nodes in a graph, and to remove information about the non-critical nodes. This is achieved by mapping the scores of the nodes to a number close to 1 if they belong to the top k scores, and close to 0 otherwise. By multiplying the information of the nodes with their scores, the algorithm retains the information of the current critical nodes and removes the information of other nodes.
The main advantage of the differentiable top-k algorithm over traditional approaches is its differentiability. Unlike traditional top-k algorithms that are non-differentiable, the differentiable top-k algorithm can be used in deep learning models without affecting their backpropagation.
With this algorithm, we can adjust the above transformation by turning the score of node i into
Algorithm 1. A differentiable Top-k algorithm.
Require:
1:
2: μ = 1N/N
3: v = [k/N, (N − k)/N]T
4:
5:
6: q = [1/2,1/2]T
7: m ← M
8: while m ≠ 0 do
9: p = μ/(Gq), q = v/(GTP)
10: m ← m − 1
11: end while
12: Γ = diag(p) ⊙ G ⊙ diag(q)
13:
Let
Therefore,
3.3.2 Data restoration stage
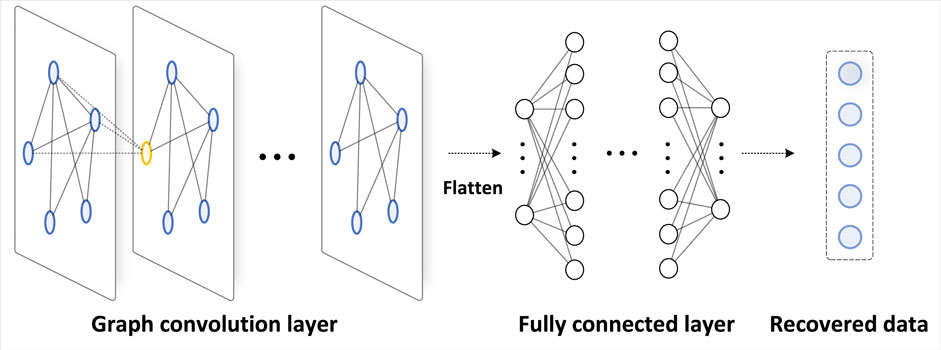
To do data restoration, we use GCN to approximate the data of the entire network X(t) based on
Figure 2 illustrates the design of GCN in our work. The detailed design of GCN structure is included in the experimental settings part.
4 Experiments and results
In this section, we conduct a comprehensive evaluation of the proposed model for vital nodes mining. For the first part, we provide our experimental settings. For the second part, we present the experimental results with comparisons to other state-of-art methods.
4.1 Experimental settings
Our experiments are conducted on three types of networks: scale-free network (generated by the Barabási–Albert model) [34], small-world network (generated by the Watts and Strogatz model) [35], and random network (generated by the Erdős–Rényi model) [36].
In our experiments, we adopted the SIR (Susceptible-Infected-Recovered) model to generate the dynamic data, which is a widely-used epidemiological model for the spread of infectious diseases. The model has three main parameters: the infection rate β, the recovery rate γ, and the initial number of infected individuals.
In our experiments, we set the infection rate β to 0.02 and the recovery rate γ to 0.01, based on previous studies on similar diseases and to reflect a realistic scenario. The initial number of infected individuals is randomly chosen from a uniform distribution between 1% and 5% of the total population. The process is illustrated as follows:
si, xi, and ri are defined as the possibility of node i being in the susceptible, infected, and recovered states, respectively. Aij represents the adjacency matrix of the network. The evolution of si is manipulated by the equation as follows:
Meanwhile, xi and ri satisfy the equation as follows:
The data set has a length of 500, eighty percent out of which is the training set while the rest is the testing set.
As for restoring the data, we designed a GCN model, which consists of five layers: four layers of graph convolution and one layer of fully connected layers. The graph convolution layers are used to extract features from the input, while the fully connected layer maps these features to the final output.
To activate each layer, we use the rectified linear unit (ReLU) activation function. ReLU is a popular choice for deep learning models because of its simplicity and effectiveness in preventing the vanishing gradient problem.
To optimize the model, we use the Adam algorithm, which is a widely used optimization algorithm for deep learning. We set the learning rate of Adam to 0.001, which is a commonly used value for training deep learning models. During the training process, we did not use regularization techniques such as L2 regularization or dropout.
In order to demonstrate the advantages of the proposed method over other traditional methods, we conduct vital nodes mining with various indices under the same setting, including random choice, degree centrality, betweenness centrality, k-shell, and closeness centrality. The setting is repeated for every method involved in our experiments. We introduce the settings for each type of network below.
4.1.1 Scale-free network
We first generate the scale-free network by Barabási–Albert model [36]. To be specific, we start with a connected network with m0 nodes, then we add one node at a time and connect it to m existing nodes, where m ≤ m0. We add two connections at a time and the possibility of connecting a new node to an existing node i is denoted as Πi, which has the relationship with degree ki of node i as follows:
As mentioned in Section III, if we only have the topology of a graph without the corresponding data, we apply coupled SIR model to generate the data.
In this experiment, we conduct two controlled variable experiments. Firstly, we fix the number of vital nodes to be identified and vary the total number of nodes. Secondly, we fix the total number of nodes and vary the number of vital nodes to be identified. For the first part, we set three scenarios where the total number of nodes is 20, 30 and 50, respectively. Then we aim to identify 2 nodes in each scenario. For the second part, we focus on a graph with 30 nodes, while the number of vital nodes to be identified is 1,2, and 3, respectively.
These specific scenarios result from the following considerations. Firstly, the complexity should be kept under control. Complex networks are characterized by non-trivial topologies and intricate interconnections between nodes. As the number of nodes in a network increases, its complexity grows exponentially. Secondly, performance matters. The performance of methods depends on the size of the network, the sparsity of the data, and the quality of the available information. In general, more nodes and more data improve the accuracy, however, beyond a certain point, the improvement in performance diminishes, and the computational cost and the risk of overfitting increase. Thirdly, the scale should not be too small as well, as a moderate number of nodes serve as representative samples of the data and the networks. It helps ensure that the experiments represent the underlying network structures and data distributions. As for the number of vital nodes to be selected, we keep it small because we want to maximize the superiority of the proposed method, as a larger portion of selected nodes results in similar accuracy. In summary, we choose the number of nodes we used in experiments to balance the trade-off between complexity, performance, and generalizability. These scenarios (N = 20, N = 30, N = 50, and n = 1, n = 2, n = 3) ensure that the experiments are feasible, statistically significant, and representative of the underlying structures and patterns.
4.1.2 Small-world network
Firstly, we generate a small-world network by the Watts and Strogatz (WS) model [35]. The process is introduced as follows.
Given a cyclic nearest-neighbor coupling network containing N nodes, where each node is connected to each of the K/2 nodes adjacent to its left and right, and K is an even number. Then, we reconnect each of the original edges in the network randomly with probability p, i.e., leave one endpoint of each edge unchanged and take the other endpoint as a randomly chosen node in the network instead. Also, there must be no overlapping edges or self-loops. In our experiment, N = 4 and p = 0.5.
With the graph at hand, we then generate the data with the same dynamical model as in the previous experiment, the coupled SIR model. The scale of the data set remains the same, with the training set taking up eighty percent of the total data set length of 500. Then we conduct controlled variable experiments on the network with the same settings as on scale-free networks.
4.1.3 Random network
We first construct a random network G(N, M) based on Erdős–Rényi (ER) model. The construction is specified as follows. Firstly, the graph is initialized with N given nodes and M edges to be added. Then we randomly select a pair of different nodes that are not connected by an edge and add an edge between the pair. This step is repeated until M edges are added between different pairs. After that, we apply the same dynamical model as the previous two experiments to generate the data. The settings for the controlled variable experiments are the same as well, which is captioned in the table of experiment results. Figure 3 shows the generated graph with 30 nodes, under three types of networks respectively.
4.2 Experiment results and comparisons
In this subsection, we give the result of the experiments and the comparisons between different methods. The evaluation of accuracy is based on mean squared error (MSE), which is the data shown in the table. In the table, N denotes the total number of nodes in the network and n represents the number of vital nodes to be chosen. We choose MSE over other measures here because MSE is sensitive to both large and small errors, as it squares the differences between the predicted and actual values. Also, MSE is a differentiable function, which means it can be used in optimization algorithms to minimize the error between the predicted and actual values. This makes it useful in machine learning applications, where the goal is often to find the best set of parameters that minimize the error between the predicted and actual values. In addition, MSE is robust to outliers, meaning that it is less affected by extreme values in the data.
4.2.1 Experiment results on scale-free networks
As mentioned in the experimental settings, we conduct two controlled variable experiments on the scale-free networks. Firstly, we aim to identify two vital nodes out of three networks whose total number of nodes is 20, 30, and 50, respectively, which is shown in Table 2.
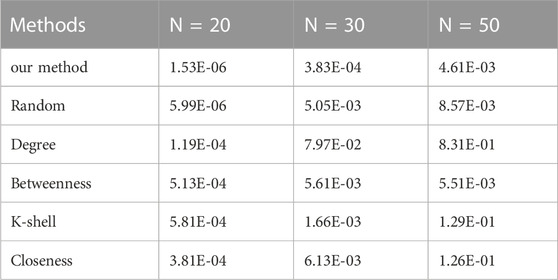
TABLE 2. The reconstruction error (MSE) comparison on a scale-free network using various methods (n = 2).
Secondly, we fix the total number of nodes in the network as 30 and conduct the identification for 1, 2, and 3 vital nodes, respectively. Figure 4 and Figure 5 show the result of node selection when n = 2 and n = 3, where red nodes represent vital nodes. The reconstruction errors are shown in Table 3.
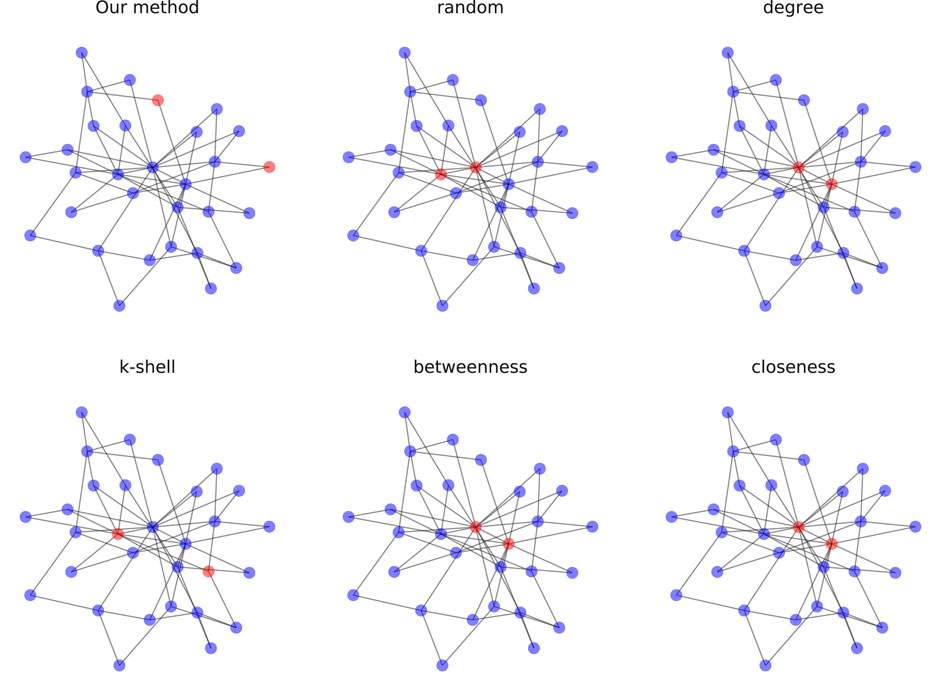
FIGURE 4. Selection of 2 vital nodes on scale-free networks (N = 30) where red nodes are labeled as vital nodes.
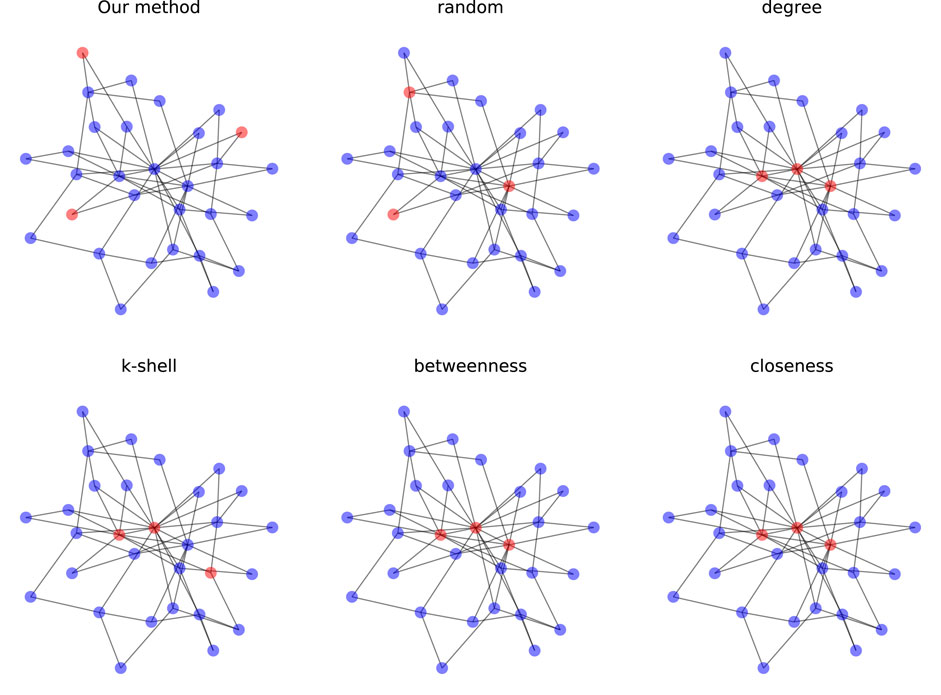
FIGURE 5. Selection of 3 vital nodes on scale-free networks (N = 30) where red nodes are labeled as vital nodes.
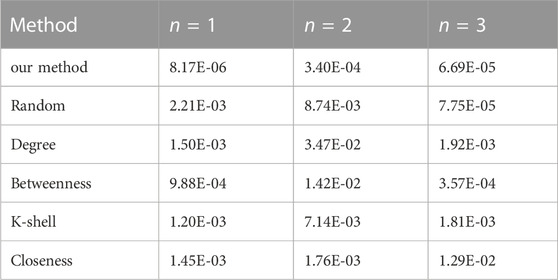
TABLE 3. The reconstruction error (MSE) comparison on a scale-free network using various methods (N = 30).
In both figures, the results with the tested centralities algorithms are the same, except for K-shell being a bit different. Also, the vital nodes for these algorithms are clustered and located in the center of the graph. However, in our method, the network of the vital nodes is quite sparse, where vital nodes have relatively larger distances from each other and locate at the periphery of the graph. This difference shows the great discrepancy between identifying one node and multiple nodes at a time. Because centralities algorithms rank all the nodes based on their individual influence, simply choosing the top few nodes provides no guarantee that the joint influence of these nodes is still maximal in the network. Also, the identified vital nodes tend to cluster as neighboring nodes have similar structural properties, which results in the loss of overall information. In comparison, our method focuses on the joint influence of the selected nodes, maximizing the control of the vital nodes over the whole network. To be more specific, the nodes we selected may not be the most influential nodes individually, but they reach the maximal influence when combined, which is valid for real-life applications.
As can be seen from the table, the proposed method outperforms all other methods in accuracy in every scenario.
4.2.2 Experiment results on small-world networks
For small-world networks, we conduct similar experiments to test the performance of the proposed method. Table 4 shows the error of conducting various approaches to identify two vital nodes from different scales of small-world networks.
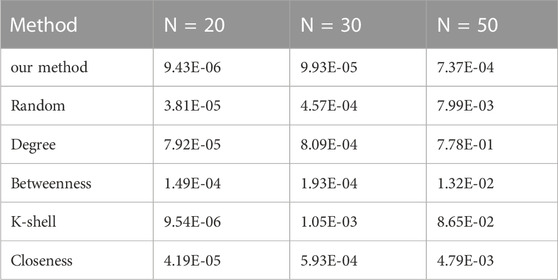
TABLE 4. The reconstruction error (MSE) comparison on a small-world network using various methods (n = 2).
Table 5 shows the error of conducting various approaches to identify different vital nodes from a small-world network with 30 nodes in total.
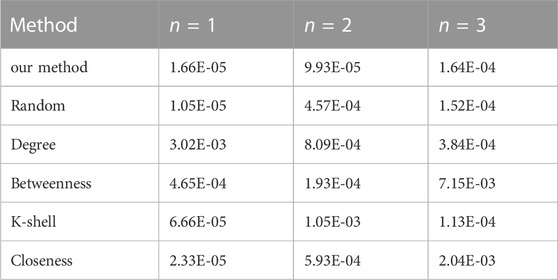
TABLE 5. The reconstruction error (MSE) comparison on a small-world network using various methods (N = 30).
As the table demonstrates, on small-world networks, the proposed method has noticeably better performance in accuracy than other tested methods in most scenarios.
4.2.3 Experiment results on random networks
For random networks, we repeat the experiments to test the performance of the proposed method. Table 6 shows the error of conducting various approaches to identify two vital nodes from different scales of small-world networks.

TABLE 6. The reconstruction error (MSE) comparison on a random network using various methods (n = 2).
Table 7 shows the error of conducting various approaches to identify different vital nodes from a random network with 30 nodes in total.
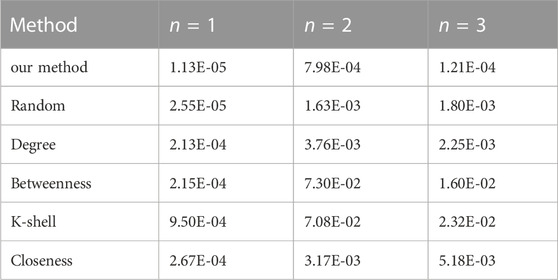
TABLE 7. The reconstruction error (MSE) comparison on random network using various methods (N = 30).
The data serves as strong evidence that the proposed method has much higher accuracy than the other traditional methods on random networks, which is consistent with the previous results on other types of networks.
In summary, the proposed method shows more adaptability to various types of networks and requirements. It also reaches higher accuracy compared to the state-of-art methods tested in our paper, though the choice of vital nodes differs a lot due to the focus on maximizing the joint influence.
5 Discussion
Vital node mining has attracted much attention in many research fields. Traditional strategies based on centralities face challenges in generality and time complexity. In this paper, we propose a novel deep learning-based algorithm that identifies multiple vital nodes simultaneously. In the proposed algorithm, we first generate the spatio-temporal data by dynamical model, then apply our vital nodes selection model to them. In the node selection process, we use a differentiable top-k algorithm to screen the information of the temporary vital nodes. Then we adopt GCN to restore the rest of the information and conduct backward propagation to obtain the final vital nodes set. Experiments on generated data show that our method outperforms other state-of-the-art methods, especially in adaptability and accuracy. Therefore, the presented algorithm serves as an effective way to identify vital nodes in networks, which has wide applications in transportation, power grids, social networks, disease transmission prevention, etc. In the follow-up work, we will improve the efficiency of our method and explore more applications on real networks.
Data availability statement
The original contributions presented in the study are included in the article/Supplementary Materials, further inquiries can be directed to the corresponding authors.
Author contributions
JF, XJ, QS, DC, and WY designed and performed the work. JF and XJ both contributed to the writing of the manuscript. All authors contributed to the article and approved the submitted version.
Funding
This work is supported by the National Natural Science Foundation of China under Grants Nos. 62233004, 62273090, 62073076, the Fundamental Research Funds for the Central Universities under Grant 2242023K40010, and the Jiangsu Provincial Key Laboratory of Networked Collective Intelligence under Grant No. BM2017002.
Conflict of interest
The authors declare that the research was conducted in the absence of any commercial or financial relationships that could be construed as a potential conflict of interest.
Publisher’s note
All claims expressed in this article are solely those of the authors and do not necessarily represent those of their affiliated organizations, or those of the publisher, the editors and the reviewers. Any product that may be evaluated in this article, or claim that may be made by its manufacturer, is not guaranteed or endorsed by the publisher.
References
1. Chen D, Lü L, Shang MS, Zhang YC, Zhou T. Identifying influential nodes in complex networks. Physica a: Stat Mech its Appl (2012) 391:1777–87. doi:10.1016/j.physa.2011.09.017
2. Kitsak M, Gallos LK, Havlin S, Liljeros F, Muchnik L, Stanley HE, et al. Identification of influential spreaders in complex networks. Nat Phys (2010) 6:888–93. doi:10.1038/nphys1746
3. Hage P, Harary F. Eccentricity and centrality in networks. Social networks (1995) 17:57–63. doi:10.1016/0378-8733(94)00248-9
4. Freeman LC. Centrality in social networks conceptual clarification. Soc networks (1978) 1:215–39. doi:10.1016/0378-8733(78)90021-7
5. Freeman LC. A set of measures of centrality based on betweenness. Sociometry (1977) 40:35–41. doi:10.2307/3033543
6. Bonacich P. Some unique properties of eigenvector centrality. Soc networks (2007) 29:555–64. doi:10.1016/j.socnet.2007.04.002
7. Brin S, Page L. The anatomy of a large-scale hypertextual web search engine. Comp networks ISDN Syst (1998) 30:107–17. doi:10.1016/s0169-7552(98)00110-x
8. Rezaei AA, Munoz J, Jalili M, Khayyam H. A machine learning-based approach for vital node identification in complex networks. Expert Syst Appl (2023) 214:119086. doi:10.1016/j.eswa.2022.119086
9. Xie Y, Dai H, Chen M, Dai B, Zhao T, Zha H, et al. Differentiable top-k with optimal transport. Adv Neural Inf Process Syst (2020) 33:20520–31.
10. Lü L, Chen D, Ren XL, Zhang QM, Zhang YC, Zhou T. Vital nodes identification in complex networks. Phys Rep (2016) 650:1–63. doi:10.1016/j.physrep.2016.06.007
11. Salavati C, Abdollahpouri A, Manbari Z. Ranking nodes in complex networks based on local structure and improving closeness centrality. Neurocomputing (2019) 336:36–45. doi:10.1016/j.neucom.2018.04.086
12. Tudisco F, Higham DJ. Node and edge nonlinear eigenvector centrality for hypergraphs. Commun Phys (2021) 4:201–10. doi:10.1038/s42005-021-00704-2
13. Liu M, Ma Y, Cao Z, Qi X. Ecp-rank: A novel vital node identifying mechanism combining pagerank with link prediction index. Physica A: Stat Mech Its Appl (2018) 512:1183–91. doi:10.1016/j.physa.2018.08.042
14. Kempe D, Kleinberg J, Tardos É. Maximizing the spread of influence through a social network. In: Proceedings of the ninth ACM SIGKDD international conference on Knowledge discovery and data mining; August 24-27, 2003; Washington, DC (2003). p. 137–46.
15. Leskovec J, Krause A, Guestrin C, Faloutsos C, VanBriesen J, Glance N. Cost-effective outbreak detection in networks. In: Proceedings of the 13th ACM SIGKDD international conference on Knowledge discovery and data mining; August 12-15, 2007; San Jose, CA (2007). p. 420–9.
16. Cheng S, Shen H, Huang J, Zhang G, Cheng X. Staticgreedy: Solving the scalability-accuracy dilemma in influence maximization. In: Proceedings of the 22nd ACM international conference on Information & Knowledge Management; October 27-November 1, 2013; San Francisco, CA (2013). p. 509–18.
17. Heidari M, Asadpour M, Faili H. Smg: Fast scalable greedy algorithm for influence maximization in social networks. Physica A: Stat Mech its Appl (2015) 420:124–33. doi:10.1016/j.physa.2014.10.088
18. Tang J, Zhang R, Yao Y, Yang F, Zhao Z, Hu R, et al. Identification of top-k influential nodes based on enhanced discrete particle swarm optimization for influence maximization. Physica A: Stat Mech its Appl (2019) 513:477–96. doi:10.1016/j.physa.2018.09.040
19. Zhang JX, Chen DB, Dong Q, Zhao ZD. Identifying a set of influential spreaders in complex networks. Scientific Rep (2016) 6:27823–10. doi:10.1038/srep27823
20. Liu D, Jing Y, Zhao J, Wang W, Song G. A fast and efficient algorithm for mining top-k nodes in complex networks. Scientific Rep (2017) 7:43330–8. doi:10.1038/srep43330
21. Ahajjam S, Badir H. Identification of influential spreaders in complex networks using hybridrank algorithm. Scientific Rep (2018) 8:11932–10. doi:10.1038/s41598-018-30310-2
22. He Q, Wang X, Huang M, Lv J, Ma L. Heuristics-based influence maximization for opinion formation in social networks. Appl Soft Comput (2018) 66:360–9. doi:10.1016/j.asoc.2018.02.016
23. Zhang C, Li W, Wei D, Liu Y, Li Z. Network dynamic gcn influence maximization algorithm with leader fake labeling mechanism. IEEE Trans Comput Soc Syst (2022) 1–9. doi:10.1109/tcss.2022.3193583
24. Jiang Q, Song G, Gao C, Wang Y, Si W, Xie K. Simulated annealing based influence maximization in social networks. In: Twenty-fifth AAAI conference on artificial intelligence; August 7–11, 2011; San Francisco, CA (2011).
25. Gong M, Yan J, Shen B, Ma L, Cai Q. Influence maximization in social networks based on discrete particle swarm optimization. Inf Sci (2016) 367:600–14. doi:10.1016/j.ins.2016.07.012
26. Zareie A, Sheikhahmadi A, Jalili M. Identification of influential users in social network using gray wolf optimization algorithm. Expert Syst Appl (2020) 142:112971. doi:10.1016/j.eswa.2019.112971
27. Aghaee Z, Ghasemi MM, Beni HA, Bouyer A, Fatemi A. A survey on meta-heuristic algorithms for the influence maximization problem in the social networks. Computing (2021) 103:2437–77. doi:10.1007/s00607-021-00945-7
28. Tang J, Zhang R, Wang P, Zhao Z, Fan L, Liu X. A discrete shuffled frog-leaping algorithm to identify influential nodes for influence maximization in social networks. Knowledge-Based Syst (2020) 187:104833. doi:10.1016/j.knosys.2019.07.004
29. Wang Y, Cong G, Song G, Xie K. Community-based greedy algorithm for mining top-k influential nodes in mobile social networks. In: Proceedings of the 16th ACM SIGKDD international conference on Knowledge discovery and data mining; July 24--28, 2010; Washington, DC (2010). p. 1039–48.
30. Shang J, Zhou S, Li X, Liu L, Wu H. Cofim: A community-based framework for influence maximization on large-scale networks. Knowledge-Based Syst (2017) 117:88–100. doi:10.1016/j.knosys.2016.09.029
31. Singh SS, Kumar A, Singh K, Biswas B. C2im: Community based context-aware influence maximization in social networks. Physica a: Stat Mech its Appl (2019) 514:796–818. doi:10.1016/j.physa.2018.09.142
32. Banerjee S, Jenamani M, Pratihar DK. Combim: A community-based solution approach for the budgeted influence maximization problem. Expert Syst Appl (2019) 125:1–13. doi:10.1016/j.eswa.2019.01.070
33. Huang H, Shen H, Meng Z, Chang H, He H. Community-based influence maximization for viral marketing. Appl Intelligence (2019) 49:2137–50. doi:10.1007/s10489-018-1387-8
34. Barabási AL, Bonabeau E. Scale-free networks. Scientific Am (2003) 288:60–9. doi:10.1038/scientificamerican0503-60
35. Watts DJ, Strogatz SH. Collective dynamics of ‘small-world’networks. Nature (1998) 393:440–2. doi:10.1038/30918
Keywords: vital nodes identification, complex networks, deep learning, graph convolutional network, network recovery
Citation: Fu J, Jiang X, Shao Q, Chen D and Yu W (2023) Identifying vital nodes in recovering dynamical process of networked system. Front. Phys. 11:1167585. doi: 10.3389/fphy.2023.1167585
Received: 16 February 2023; Accepted: 25 May 2023;
Published: 05 June 2023.
Edited by:
Jianxi Gao, Rensselaer Polytechnic Institute, United StatesReviewed by:
Bin-Bin Hu, Nanyang Technological University, SingaporeBowen Xu, Northwestern Polytechnical University, China
Copyright © 2023 Fu, Jiang, Shao, Chen and Yu. This is an open-access article distributed under the terms of the Creative Commons Attribution License (CC BY). The use, distribution or reproduction in other forums is permitted, provided the original author(s) and the copyright owner(s) are credited and that the original publication in this journal is cited, in accordance with accepted academic practice. No use, distribution or reproduction is permitted which does not comply with these terms.
*Correspondence: Duxin Chen, MTAxMDEyMzg0QHNldS5lZHUuY24=; Wenwu Yu, d3d5dUBzZXUuZWR1LmNu
 Jiale Fu
 Xiaoya Jiang
 Qi Shao

