- 1Department of Systems Innovation, Graduate School of Engineering, The University of Tokyo, Tokyo, Japan
- 2School of Science, Aalto University, Espoo, Finland
- 3Mathematics and Informatics Center, The University of Tokyo, Tokyo, Japan
Indirect reciprocity is a type of social dynamics in which the attitude of an individual toward another individual is either cooperative or antagonistic, and it can change over time through their actions and mutual monitoring. This opinion dynamics is found to be frustrating in certain edge density regimes on random graphs when all the components adopt the Kandori rule, which is one of the norms of indirect reciprocity. In this study, we conducted an exhaustive analysis of so-called “leading-eight” norms of indirect reciprocity dynamics and found that three of them (the Kandori and other two rules) keep the opinion dynamics frustrated on random graphs. We investigated the frustrated opinion dynamics of these three norms on real acquaintance networks and observed that the degree of frustration of the system can be inferred when the network properties such as the number of triangular connections and number of quads are properly taken into account. This study also reveals that the closeness centrality of a triangular representation is a good predictor of the degree of local frustration. Furthermore, it is also found that better prediction is achieved when we do not consider all the reachable triads in the calculation of a focal triad’s closeness centrality. This result suggests that it is sufficient to predict the opinion dynamics by considering only the proximity triads within a certain observation radius from that triad. This finding may facilitate the analysis of real-world cooperative relationships consisting of a vast number of triads.
1 Introduction
Social relations are characterized by being of either cooperative (friendly) or antagonistic (unfriendly) nature. However, it can also happen that friends turn to foes or foes to friends [1], i.e., an individual network link changes from positive to negative or negative to positive, respectively. Hence, understanding the temporal evolution of such a behavior change process is essential for gaining a deeper insight into the functions of real social networks. For this purpose, the approach of agent-based modeling has turned out to be very versatile.
One of the earlier models on how people change their attitude toward others was based on indirect reciprocity [2]; [3], as it is commonly observed in human behavior and is closely related to the evolution of cooperation in a human society [4]. In this model, people change their attitude (of either liking or disliking) through their actions and observation of the actions of others. A typical example of such dynamics is as follows: first, people cooperate with only those they like. Second, they get to like those who cooperate with those whom they like and do not cooperate with those whom they dislike. The rule for determining the action of the agent (whether she/he cooperates or not) is called the action rule, and the rule for updating one’s opinion on others (like or dislike) is called the assessment rule. The set of rules that determine social dynamics is called norms. Among various possible norms, Ohtsuki et al. found that certain eight norms can maintain stable cooperation against minor invasions (i.e., invasions with a small population, for which both the change in the relative populations of resident individuals and the interactions among invaders, e.g., by benefitting each other, can be neglected) and named them the “leading-eight” norms [3]; [5]. We refer to them as L1–L8 in the following sections, and the action rules and assessment rules of these norms are shown in Tables 1, 2, respectively. The assessment rules are dependent on the context, i.e., the donor’s reputation, the recipient’s reputation, and whether the donor cooperates (C) or defects (D) with the recipient.
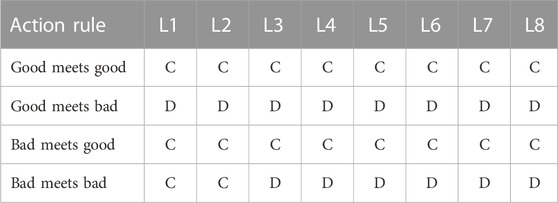
TABLE 1. Action rules of the “leading-eight” norms such that they define the donor’s action whether she or he will cooperate (C) with or defect (D) with the recipient. The action of the donor depends on the recipient’s reputation, and in the case of some norms, it also depends on the donor’s reputation.
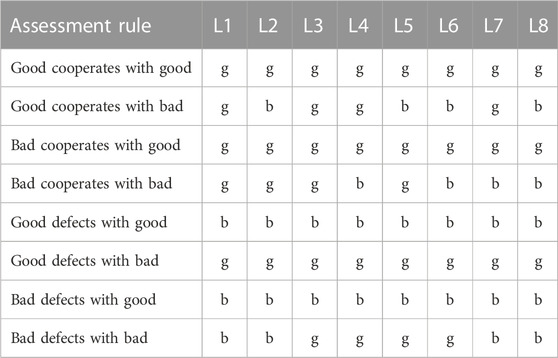
TABLE 2. Assessment rules of the “leading-eight” norms, determining whether a donor is assessed as good (g) or bad (b). The assessment depends on the context: the donor’s reputation, the recipient’s reputation, and the donor’s action toward the recipient.
Despite the importance of indirect reciprocity, the dynamics of social networks induced by indirect reciprocity have not been fully understood yet. Previous studies have focused on the case of fully connected networks (i.e., systems in which all people know each other) [6]; [7], well-mixed random networks [8], or fixed random graphs of acquaintances [9]. In the study on fully connected networks, Oishi et al. found that indirect reciprocity can result in the split of society into clusters, only within which people are cooperative [6]. Moreover, in the study on fixed random graphs, it was found that the density of social networks drastically changes the structure of friendship and enmity [9].
Real social networks are known to have different properties from random graphs, e.g., broad degree distribution (including scale-free [10]), degree–degree correlation (assortativity), and higher probability of forming triangles (clustering [11]) [12], [13]; [14]; [15]. Therefore, we focus on the dynamics of indirect reciprocity in real social networks to test whether there is a relationship between the network structure and the pattern of being friendly or hostile. More specifically, we focus on predicting the dynamics by network centrality. The idea of applying centrality to human communication has a long history [16], but sometimes, the calculation of some centrality measures turns out to be problematic, especially when applied to large networks. To ensure that our results can be applied even when analyzing realistic multiperson cooperative data, we also attempt to compute predictive quantities for focal sub-graphs by only considering a subset of the network to obtain the predictiveness of a sufficient degree.
This paper is organized as follows: the model is covered in Section 2. This is followed by the Result section. Finally, in the Discussion section, we summarize the results of this study and discuss their implications for gaining further understanding of the complexities of opinion dynamics in social networks.
2 The model
Let us consider a non-directed network of agents G = (V, E), where V = 1, … , N is the set of agents or network nodes and E is the set of links or network edges eij ∈ E between agents i and j, meaning that they know each other. We denote the number of edges as Nedge. Here, the structure of the network is assumed not to change in time, i.e., being static, while the agents have their opinion about their neighbors and change it in time, i.e., being dynamic. We denote the opinion of the agent i about the agent j as σij. If the agent i likes the agent j at time step t, then σij(t) = 1, but if the agent i dislikes j, then σij(t) = −1. The opinions do not need to be reciprocal so that i may dislike j even if j likes i.
The time evolution of the model is set in such a way that at each time step, two neighboring agents are randomly chosen (i.e., random link sampling), one as the donor and the other as the recipient. In the system, the population adopts the same moral being one of the leading-eight norms x ∈ {L1, L2, L3, L4, L5, L6, L7, L8}, and the action of the donor d to a recipient r is determined as follows:
where ax(σdd, σdr) is the action function that returns 1 for cooperation and −1 for declining to cooperate. The value the action function ax(σdd, σdr) returns corresponds to the a(σdd, σdr) of the column x ∈ {L1, L2, L3, L4, L5, L6, L7, L8} in Table 1, with replacing C by 1 and D by −1 (or as is explicitly shown in Supplementary Table S1).
The action of the donor, either to cooperate (adr(t) = 1) or not to cooperate (adr(t) = −1), is observed by the donor (him- or herself), the recipient, and the common acquaintances (common neighbors in the graph) of the donor and the recipient. Here, the third party is called the observer, as depicted in Figure 1A. The agents other than the donor, the recipient, and the observers do not update their opinions (Figure 1B) since they do not observe the transactions. However, other settings are also possible. For example, one can assume that the agents who know the donor but do not know the recipient can still observe the transactions and update their opinions of the donor.
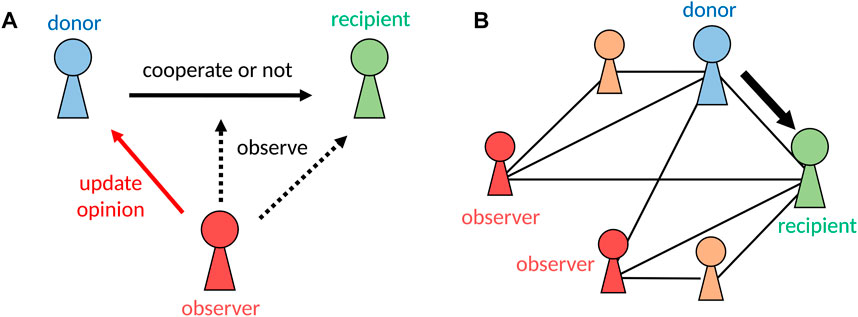
FIGURE 1. Schematics of the model. (A) Donor, recipient, and a third-party observer. (B) Observers in a network. The non-labeled neighboring agents (colored orange) do not observe the exchange between the donor and recipient because they are connected to only one of the pairs.
The opinion of an observer o about the donor is updated as follows:
where vx(σod, σor, adr) is the assessment function, which returns 1 for assessing good and −1 for assessing bad. The values of the assessment function vx(σod, σor, adr) returns correspond to the (g or b) of the column x ∈ {L1, L2, L3, L4, L5, L6, L7, L8} in Table 2, with replacing g by 1 and b by −1 (or as is explicitly shown in Supplementary Table S2).
The agents’ initial opinions are drawn independently at random from an even distribution of opinions, i.e., {− 1, + 1}, where −1 corresponds to an antagonistic or unfriendly opinion and +1 corresponds to a cooperative or friendly opinion (i.e., liking or disliking, respectively).
3 Numerical results
3.1 Norms for frustrated opinion dynamics
First, we investigate all the “leading-eight” norms to find out if there are other norms than the Kandori rule, which do not relax to the absorbing states, i.e., the dynamics is frustrated. For this, we define a parameter that characterizes the distance of a configuration of the system from an absorbing state. In the following sections, we call this parameter imbalance according to the convention that the triad relation is balanced if that relation is stable under social dynamics and imbalanced if that relation can be altered [17]; [18]; [19]; [20]; [21]; [22].
In our model, for all the “leading-eight” norms,
is 1 if the opinion of an observer o toward the donor d will not change after a donation game between the donor d and recipient r, and −1 if the opinion will be flipped. Because the choice of the donor and recipient in each round of game is random, then the function
represents the probability of the relation to be flipped after a game played in a triad τ of three agents i, j, and k. Therefore, we call ϕx the local imbalance. Note that by definition,
takes the value 0.
We have simulated all the “leading-eight” norms on random graphs of 50 nodes and varied the edge density from 0.1 to 1.0 with an interval of 0.1. Note that the system size is chosen so that it is large enough for our analysis, and the computational cost remains feasible. In the previous paper [9], we found that the time taken to reach an absorbing state diverges exponentially with the number of nodes N, when a small system is in the frustrated phase. On the basis of the finite-size-scaling analysis, we have shown that N = 50 is enough to determine the state of a larger system. We have found that only three norms make the system frustrated. In Figure 2, we show an example of random graph results averaged over 20 independent runs when the edge connection probability is 0.5. In this figure, one can confirm that on the random graphs, only the norms L2, L5, and L6 (Kandori rule) do not relax to the absorbing states. From now on, we focus on these three norms.
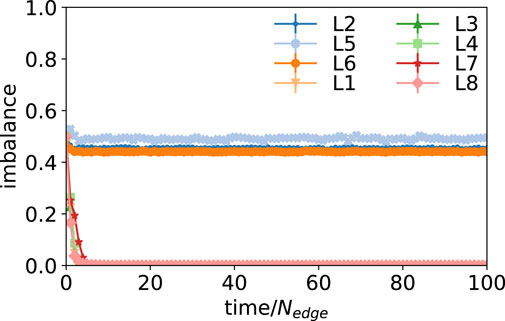
FIGURE 2. Temporal evolution of imbalance under the “leading-eight” norms, for the system of 50 nodes and edge connection probability of 0.5. The results are averaged over 20 independent runs, and the standard error bars are smaller than the symbols. Only the norms L2, L5, and L6 (Kandori) stay frustrated, i.e., the system does not reach an absorbing state.
3.2 Acquaintance network
The acquaintance network we investigated is a part of the network that is reconstructed from the human mobile-phone call detail record data [23], [24] consisting of 351,299 nodes and 434,083 edges. Each node represents a person, and a pair of people who have made at least one mutual call is considered acquaintances forming a social link. In this study, we treat this network as an unweighted network. We also treat the networks as fixed networks. This is because opinion dynamics can be drastically different depending on the density of the links [6] and on whether an edge is randomly rewired or not [9]. Therefore, the dynamics would turn out to be different if one updates the network by rewiring the links or by adding a random link at a time. The dynamics of such a system would be more complicated, for the understanding of which one needs to consider dynamics of fixed networks.
Before conducting numerical simulations, we first map the network into a triangular network representation since the triangular connections are already known to be important for the opinion dynamics [9]. In this representation, nodes represent triads in the original representation, and edges represent triads’ connections formed by sharing edges between triads. Note that sharing nodes between triads does not necessarily constitute a connection. An edge must be shared for the nodes to be considered connected. In this network, we detect 1,632 percolated clusters which include at least two triads. These clusters are triangularly percolated clusters, meaning that every triad shares at least one edge with another triad and can be regarded independent in the present indirect reciprocal model (Supplementary Section S4). This step is equivalent to k-clique community detection, commonly proposed to detect overlapping communities [25] with k = 3. The distribution of the clusters (i.e., the number of nodes and triads) is shown in Supplementary Figure S3. The characteristics of some clusters and the original network are shown in Table 3. In the following section, we focus on only four clusters, i.e., clusters 1, 2, 3, and 9, of which the first three clusters are the largest in terms of the number of nodes. When measured by the number of triads or the number of the triads’ connections, clusters 1, 2, and 9 are the three largest clusters.
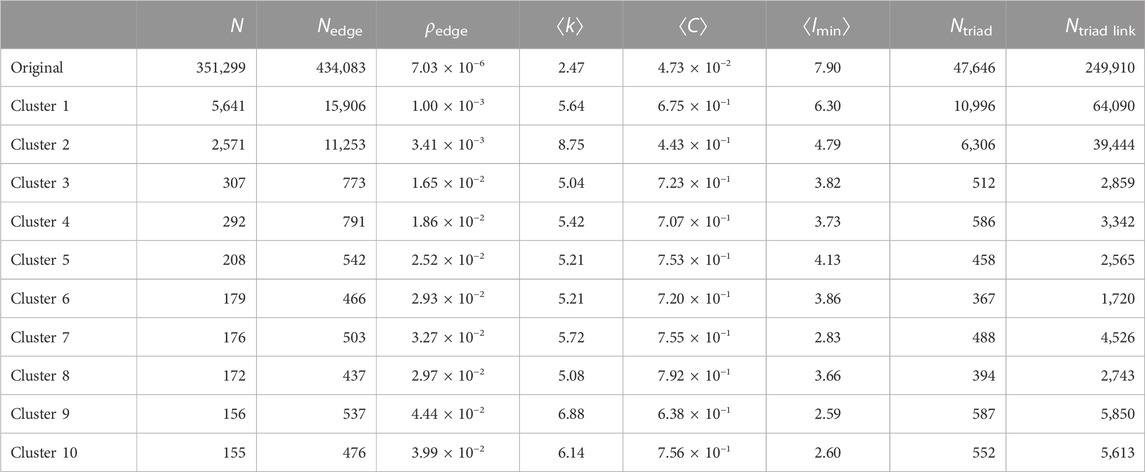
TABLE 3. Number of nodes (N), number of edges (Nedge), edge density (ρedge), average degree (⟨k⟩), average clustering (⟨C⟩), average shortest path length (⟨lmin⟩), number of triads (Ntriad), number of triads’ connections (Ntriad link) of the original network, and the 10 largest clusters in the real acquaintance network are shown here.
3.3 Comparison with random graphs
In this subsection, we focus on the Kandori rule (L6) and examine whether the opinions in the system eventually become fixed, as was found in the case of fully connected networks [6], or fluctuate, as was found in the non-complete random graphs [9]. Figure 3 shows the time evolution of the imbalances for L6 on clusters 1, 2, 3, and 9. The results are averaged over 100 independent replications. As shown in Figure 3, on these four clusters, absorbing states are never reached and the system stays frustrated.
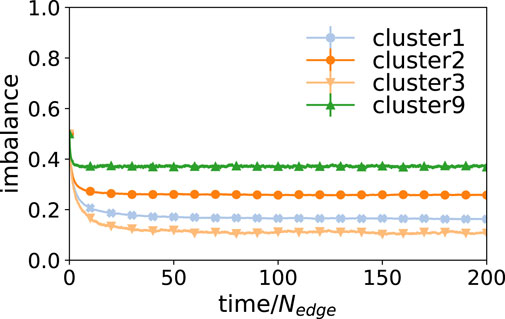
FIGURE 3. Time series of the imbalance for norm L6 on clusters 1, 2, 3, and 9 taken from the real acquaintance network. Averages and standard errors are calculated from 100 independent runs. The standard errors are smaller than the symbols. Absorbing states can never be reached in these large clusters.
Then, we compare these imbalances with the results of the random graphs in the study by [9] (Figure 5). They pointed out that the direct parameters for the imbalances are the motifs such as triad (Figure 4A), truss (Figure 4B), or quad structures (Figure 4C). We compare the imbalances of the clusters with the random graphs whose numbers of motifs are expected to be the same as those in the clusters. In addition to these motifs, we also compare the random graphs whose number of edges in the triangular representation (i.e., number of triad pairs that share edges) is expected to be the same as that of the clusters. How the expected number of motifs is calculated in the random graphs is presented in the Supplementary Section S5.

FIGURE 4. Schematics of the higher-order motifs that play critical roles in the opinion dynamics. (A) Triad, (B) truss, and (C) quad.
In Figure 5, we observe that although the number of any motifs does not predict the imbalances in the real clusters, the imbalance in the real clusters is between the imbalances of the random graphs generated according to the number of triads and the random graphs generated according to the number of quads. This suggests that the frustrated opinion dynamics are determined neither by the edge density nor the number of edges but by the number of these higher-order motifs or the connections among them, as pointed out by [9].
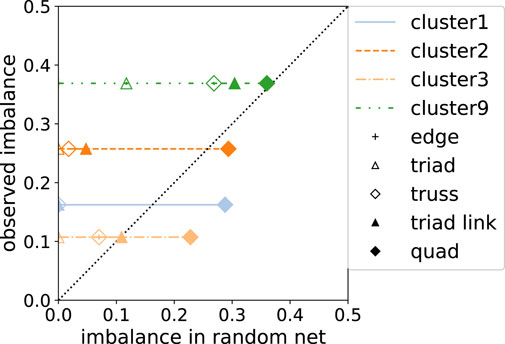
FIGURE 5. Comparison of the imbalance for norm L6, on clusters in the real acquaintance network with the imbalances of Erdős–Rényi random graphs. The vertical axis represents the observed imbalance on clusters 1, 2, 3, and 9 of the acquaintance network. The horizontal axis shows the imbalances on random graphs whose number of nodes is the same as that in each cluster. The edge densities in the random graphs are chosen for each motif so that the graph has the same expected number of that motif with the target cluster. Each symbol corresponds to a different motif. The black dotted line is the guide to the eye for the case where the imbalance on the cluster and the imbalance on the random graphs with the same density of the motif for that symbol are the same. All the imbalances are observed at a time step of 200 × Nedge. The standard errors are smaller than the symbols.
3.4 Relationship between the local network structure and local instability
In this section, we investigate the correlations between the frustrated opinion dynamics and the local structure of the networks, namely, centralities. First, we look for network centrality suitable for predicting the time average of the local imbalance ϕx. We have found that the closeness centrality [26] of the triangular network representation is calculated as
where Ntriad, n(τ), and d(τ, υ) stand for the number of triads in the network, the number of reachable triads from the triad τ, and the distance between triad τ and triad υ, respectively, predicting the opinion dynamics well. Figure 6 shows the correlation between the closeness centrality and the local imbalance. The closeness centrality shows a high correlation with local imbalance for the L6 norm in every cluster (Spearman’s rank correlations in clusters 1, 2, 3, and 9 are 0.59, 0.81, 0.93, and 0.92, respectively. Pearson product correlations in clusters 1, 2, 3, and 9 are 0.61, 0.77, 0.92, and 0.95, respectively). As this centrality measure corresponds to the inverse of average distance from the focal triad to the neighboring triads, the result we obtained suggests that a triad fluctuates more in its opinions when there are more triads in its vicinity.
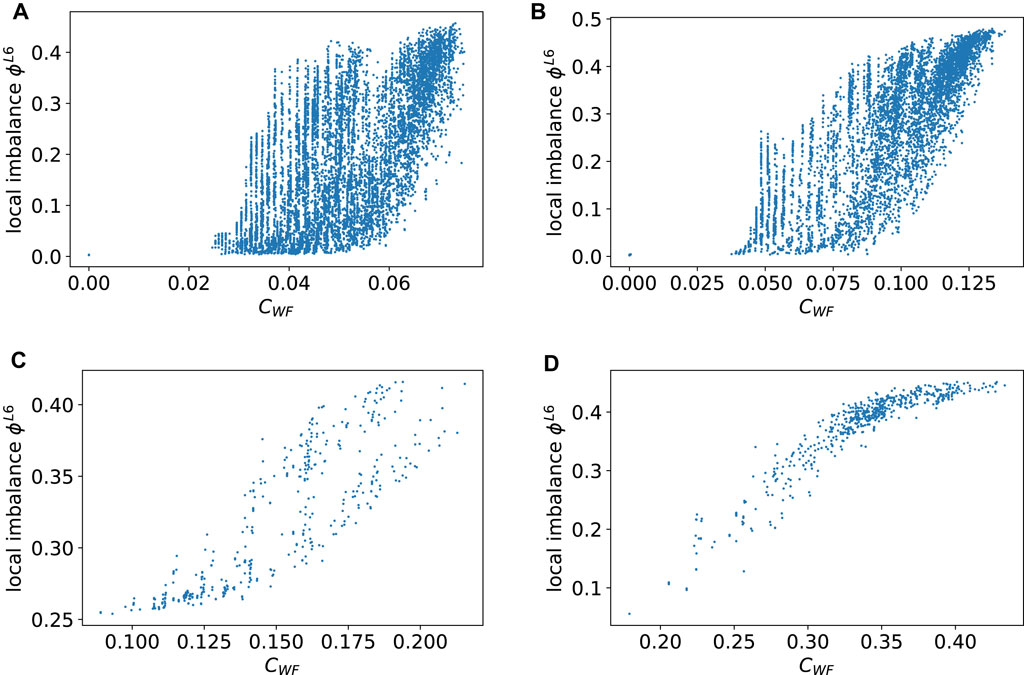
FIGURE 6. Scatter plot between the closeness centrality and the local imbalance for norm L6 in the clusters (A) 1, (B) 2, (C) 3, and (D) 9. The closeness centrality CWF(τ) shows high correlations with the local imbalance ϕL6(τ).
Next, we study how far triads affect the local imbalance of a focal triad. To evaluate this, we introduce a characteristic that is denoted by the following equation:
where l is the observation radius from the focal triad τ to consider for the calculation of the characteristics and nl(τ) is the number of triads that can be reached within the network diameter l from the triad τ. If l = ∞, this property is exactly the same as the closeness centrality calculated in Eq. 6. By varying the parameter l, we can see which observation radius l is sufficient to predict the opinion dynamics in a realistic network. Figure 7 shows Spearman’s rank correlation coefficient between
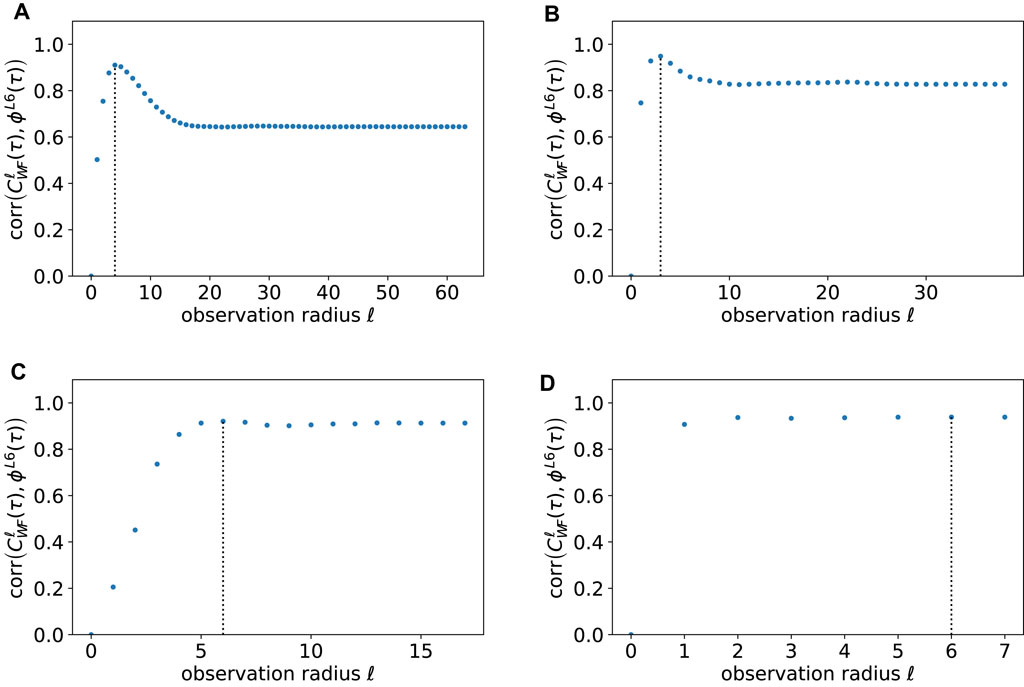
FIGURE 7. Spearman’s rank correlation coefficient between the closeness centrality
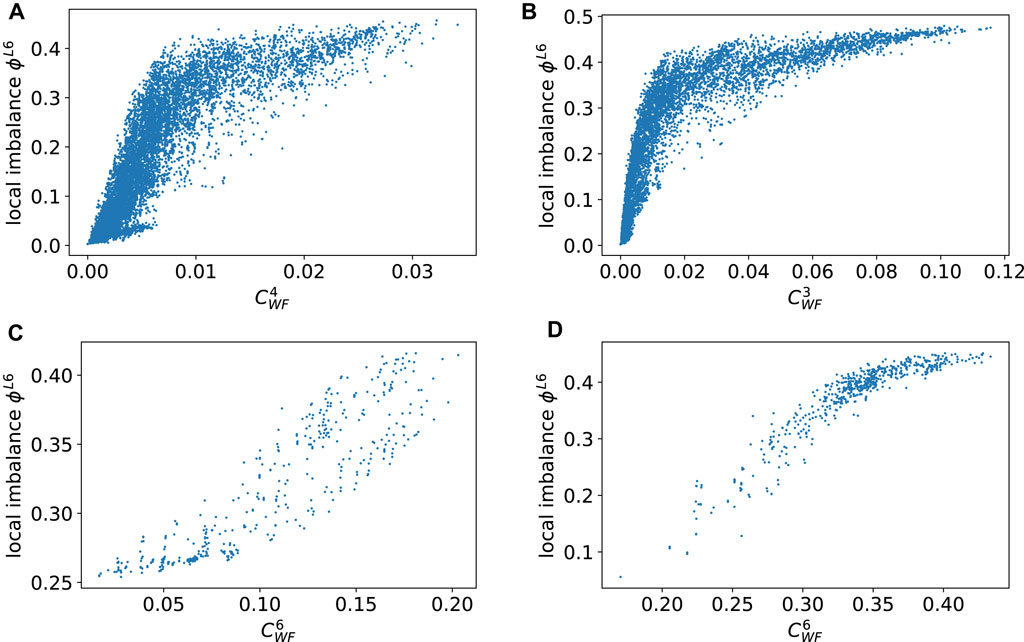
FIGURE 8. Spearman’s rank correlation between the closeness centrality
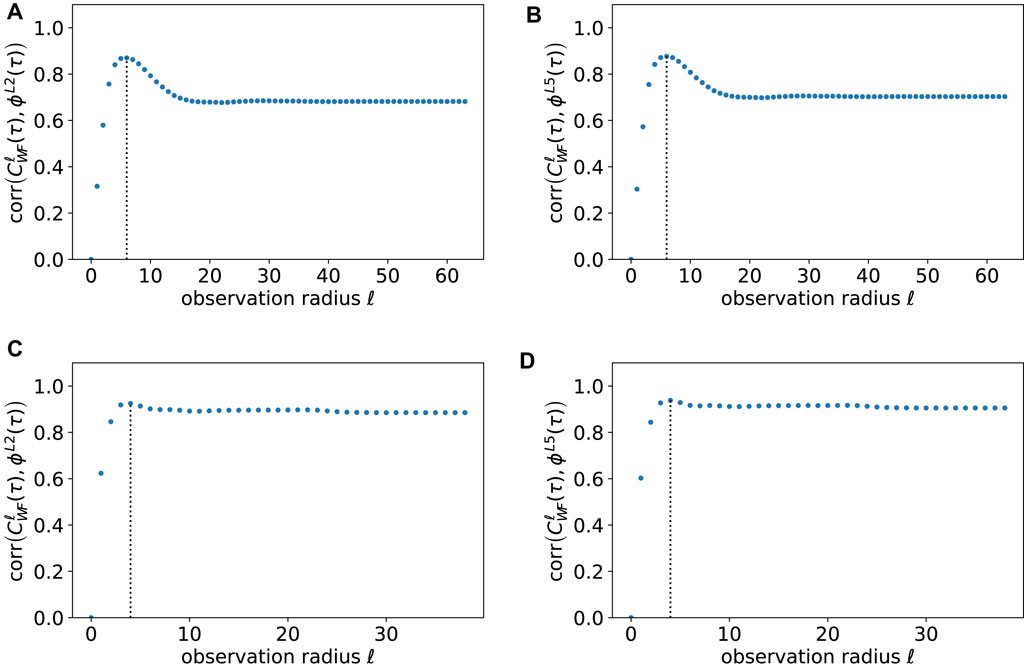
FIGURE 9. Spearman’s rank correlation coefficient between the closeness centrality
4 Discussion
In earlier studies [3]; [5]; [8], it was pointed out that the “leading-eight” norms are the most prominent norms. In the present study, we show that among these, there are only three norms, i.e., L6, L2, and L5, that cannot reach absorbing states, i.e., the states in which all the opinions become fixed. This takes place not only for random graphs but also for the real large acquaintance-based social network, when the edge density is in the middle range.
We first examined whether the clusters we found by mapping the real acquaintance network to a triangular representation are able to reach an absorbing state and, if not, how far they are from absorbing states. This was performed by using a generalized order parameter imbalance introduced previously by [9]. The results showed that the clusters that should be in the absorbing states, as inferred from the number of nodes and edges, stay in the non-absorbing states. On this basis, we suggest that the distance of these clusters from the absorbing states can be inferred if the network properties such as the number of triangular connections and number of quads are properly taken into account.
In this study, we have also found that the closeness centrality in the triangular network representation predicts well which parts of the network are frustrated. Furthermore, we have found that better prediction is achieved when we do not consider all the reachable triads when calculating the closeness centrality of the focal triad. In addition, it has turned out that in order to predict the dynamics, it is sufficient to consider only the proximity triads within a certain observation radius from the focal triad. This suggests that there is an optimal observation radius for predicting the dynamics of the model on networks.
We find that simply considering adjacent triads within an observation radius of 3–6 yields good predictions of the dynamics of focal triads in case of general cooperation dynamics. This could constitute a decisive advantage when analyzing cooperation dynamics in the real-world social networks. In the future, it would be interesting to set up a large-scale human experiment (e.g., [27]) to collect and analyze empirical data for a deeper insight into real social dynamics. Nevertheless, our main result of discovering a good measure for finding a locally frustrated opinion area in the social network paves the way for such more indirect testing with empirical data. Also, in the case of adopting the donation game under certain payoff conditions, the imbalance is highly correlated with the lower average fitness of the agents. This means that local regions with higher imbalance are more prone to invasions (for example, against unconditional defectors). Our findings on the correlation between the local structure and the imbalance is, therefore, also relevant to the evolutionary dynamics of cooperation.
It is not clear why we can observe an optimal radius for predicting the opinion dynamics in networks. It is natural to assume that the closeness centrality can give, at best, a good approximation of the dynamics of opinion in social networks due to the influence of triads further away from a focal triad being small. However, this influence can be very subtle and dependent upon the structure of the network under consideration. Therefore, investigating the relationship between the optimal observation radius for calculating the closeness centrality and the local imbalance in various other network structures, i.e., realistic networks or random graphs, would provide us an insight into the nature and a theoretical explanation for this relationship.
Data availability statement
The data analyzed in this study are subjected to the following licenses/restrictions: the original dataset comprises call detail records of individuals whose actual identities are not known but addressed by uniquely hashed identifiers by the service provider. Thus, the dataset is fully anonymized before being provided to us. Each record in this dataset pertains to a call in which two individuals participated, and the record contains the precise time and duration of the call. The metadata also include age and gender information of each anonymized subscriber. In addition, we had to sign a non-disclosure agreement for not to share the original data. However, we will share the processed aggregated data with the reviewers for all the users included in this study, needed to fully reproduce our results if they ask for them. Requests to access these datasets should be directed to a2ltbW8ua2Fza2lAYWFsdG8uZmk=.
Author contributions
DK performed the simulation and network analysis. All the authors conceived the model and the analysis and wrote the manuscript. All authors contributed to the article and approved the submitted version.
Conflict of interest
The authors declare that the research was conducted in the absence of any commercial or financial relationships that could be construed as a potential conflict of interest.
Publisher’s note
All claims expressed in this article are solely those of the authors and do not necessarily represent those of their affiliated organizations, or those of the publisher, the editors, and the reviewers. Any product that may be evaluated in this article, or claim that may be made by its manufacturer, is not guaranteed or endorsed by the publisher.
Supplementary material
The Supplementary Material for this article can be found online at: https://www.frontiersin.org/articles/10.3389/fphy.2023.1166219/full#supplementary-material
References
1. Harrigan NM, Labianca GJ, Agneessens F. Negative ties and signed graphs research: Stimulating research on dissociative forces in social networks. Soc Networks (2020) 60:1–10. doi:10.1016/j.socnet.2019.09.004
2. Nowak MA, Sigmund K. Evolution of indirect reciprocity by image scoring. Nature (1998) 393:573–7. doi:10.1038/31225
3. Ohtsuki H, Iwasa Y. How should we define goodness?—Reputation dynamics in indirect reciprocity. J Theor Biol (2004) 231:107–20. doi:10.1016/j.jtbi.2004.06.005
4. Nowak MA. Five rules for the evolution of cooperation. science (2006) 314:1560–3. doi:10.1126/science.1133755
5. Ohtsuki H, Iwasa Y. The leading eight: Social norms that can maintain cooperation by indirect reciprocity. J Theor Biol (2006) 239:435–44. doi:10.1016/j.jtbi.2005.08.008
6. Oishi K, Shimada T, Ito N. Group formation through indirect reciprocity. Phys Rev E (2013) 87:030801. doi:10.1103/physreve.87.030801
7. Isagozawa A, Shirakura T, Tanabe S. Instability of group formation through indirect reciprocity under imperfect information and implementation error (2016). arXiv preprint arXiv:1603.04945.
8. Hilbe C, Schmid L, Tkadlec J, Chatterjee K, Nowak MA. Indirect reciprocity with private, noisy, and incomplete information. Proc Natl Acad Sci (2018) 115:12241–6. doi:10.1073/pnas.1810565115
9. Oishi K, Miyano S, Kaski K, Shimada T. Balanced-imbalanced transitions in indirect reciprocity dynamics on networks. Phys Rev E (2021) 104:024310. doi:10.1103/physreve.104.024310
10. Barabási A-L, Albert R. Emergence of scaling in random networks. science (1999) 286:509–12. doi:10.1126/science.286.5439.509
11. Watts DJ, Strogatz SH Collective dynamics of ‘small-world’networks. nature (1998) 393:440–2. doi:10.1038/30918
12. Onnela J-P, Saramäki J, Hyvönen J, Szabó G, Lazer D, Kaski K, et al. Structure and tie strengths in mobile communication networks. Proc Natl Acad Sci (2007) 104:7332–6. doi:10.1073/pnas.0610245104
13. Onnela J-P, Saramäki J, Hyvönen J, Szabó G, De Menezes MA, Kaski K, et al. Analysis of a large-scale weighted network of one-to-one human communication. New J Phys (2007) 9:179. doi:10.1088/1367-2630/9/6/179
14. Toivonen R, Kovanen L, Kivelä M, Onnela J-P, Saramäki J, Kaski K. A comparative study of social network models: Network evolution models and nodal attribute models. Social networks (2009) 31:240–54. doi:10.1016/j.socnet.2009.06.004
15. Fisher DN, Silk MJ, Franks DW. The perceived assortativity of social networks: Methodological problems and solutions. Cham: Springer International Publishing (2017). p. 1–19. doi:10.1007/978-3-319-53420-6_1
16. Freeman LC. Centrality in social networks conceptual clarification. Soc networks (1978) 1:215–39. doi:10.1016/0378-8733(78)90021-7
17. Heider F. Attitudes and cognitive organization. J Psychol (1946) 21:107–12. doi:10.1080/00223980.1946.9917275
18. Antal T, Krapivsky PL, Redner S. Social balance on networks: The dynamics of friendship and enmity. Physica D: Nonlinear Phenomena (2006) 224:130–6. doi:10.1016/j.physd.2006.09.028
19. Szell M, Lambiotte R, Thurner S. Multirelational organization of large-scale social networks in an online world. Proc Natl Acad Sci (2010) 107:13636–41. doi:10.1073/pnas.1004008107
20. Leskovec J, Huttenlocher D, Kleinberg J. Signed networks in social media. In: Proceedings of the SIGCHI conference on human factors in computing systems (2010). p. 1361–70.
21. Nishi R, Masuda N. Dynamics of social balance on temporal networks (2014). arXiv preprint arXiv:1403.4891.
22. Minh Pham T, Kondor I, Hanel R, Thurner S. The effect of social balance on social fragmentation. J R Soc Interf (2020) 17:20200752. doi:10.1098/rsif.2020.0752
23. Monsivais D, Ghosh A, Bhattacharya K, Dunbar RI, Kaski K. Tracking urban human activity from mobile phone calling patterns. PLoS Comput Biol (2017) 13:e1005824. doi:10.1371/journal.pcbi.1005824
24. Monsivais D, Bhattacharya K, Ghosh A, Dunbar RI, Kaski K. Seasonal and geographical impact on human resting periods. Scientific Rep (2017) 7:10717. doi:10.1038/s41598-017-11125-z
25. Palla G, Derényi I, Farkas I, Vicsek T. Uncovering the overlapping community structure of complex networks in nature and society. nature (2005) 435:814–8. doi:10.1038/nature03607
26. Wasserman S, Faust K. Social network analysis: Methods and applications. Cambridge University Press (1994).
Keywords: cooperation, social networks, indirect reciprocity, frustration, social balance, centrality, agent-based model
Citation: Kuroda D, Kaski K and Shimada T (2023) Frustrated opinion dynamics on real networks and its predictors. Front. Phys. 11:1166219. doi: 10.3389/fphy.2023.1166219
Received: 15 February 2023; Accepted: 26 April 2023;
Published: 17 May 2023.
Edited by:
Hui-Jia Li, Beijing University of Posts and Telecommunications (BUPT), ChinaReviewed by:
Zoran Levnajic, Faculty of Information Studies Novo mesto, SloveniaJinlong Ma, Hebei University of Science and Technology, China
Copyright © 2023 Kuroda, Kaski and Shimada. This is an open-access article distributed under the terms of the Creative Commons Attribution License (CC BY). The use, distribution or reproduction in other forums is permitted, provided the original author(s) and the copyright owner(s) are credited and that the original publication in this journal is cited, in accordance with accepted academic practice. No use, distribution or reproduction is permitted which does not comply with these terms.
*Correspondence: Takashi Shimada, c2hpbWFkYUBzeXMudC51LXRva3lvLmFjLmpw
 Daichi Kuroda1
 Kimmo Kaski
 Takashi Shimada