 Guangbo Liang
 Xiaodong Cui2*
 Peican Zhu
95% of researchers rate our articles as excellent or good
Learn more about the work of our research integrity team to safeguard the quality of each article we publish.
Find out more
ORIGINAL RESEARCH article
Front. Phys. , 17 March 2023
Sec. Social Physics
Volume 11 - 2023 | https://doi.org/10.3389/fphy.2023.1164847
This article is part of the Research Topic Impacts of Heterogeneity on Biological Complex Systems View all 7 articles
Since the birth of human beings, the spreading of epidemics such as COVID-19 affects our lives heavily and the related studies have become hot topics. All the countries are trying to develop effective prevention and control measures. As a discipline that can simulate the transmission process, complex networks have been applied to epidemic suppression, in which the common approaches are designed to remove the important edges and nodes for controlling the spread of infection. However, the naive removal of nodes and edges in the complex network of the epidemic would be practically infeasible or incur huge costs. With the focus on the effect of epidemic suppression, the existing methods ignore the network connectivity, leading to two serious problems. On the one hand, when we remove nodes, the edges connected to the nodes are also removed, which makes the node is isolated and the connectivity is quickly reduced. On the other hand, although removing edges is less detrimental to network connectivity than removing nodes, existing methods still cause great damage to the network performance in reality. Here, we propose a method to measure edge importance that can protect network connectivity while suppressing epidemic. In the real-world, our method can not only lower the government’s spending on epidemic suppression but also persist the economic growth and protect the livelihood of the people to some extent. The proposed method promises to be an effective tool to maintain the functionality of networks while controlling the spread of diseases, for example, diseases spread through contact networks.
For the convenience of investigating practical systems, they are usually modeled as complex networks, such as biology, ecology, physics and medicine [1–8]. The abbreviated complex network usually consists of nodes and edges which represent individuals and connections among individuals, respectively. With these complex network models, various phenomena can be revealed through studying the properties of nodes, edges and communities. Among existing studies, the determination of edge/node importance is of great significance which can provide valuable guidance in addressing practical problems. For instance, in the aviation network, the nodes correspond to the important airports and the related studies are critical.
Since the birth of network science, scholars devote to studying the heterogeneity of nodes. Various approaches are presented to measure the importance of nodes, such as degree centrality [9,10], betweenness centrality [11,12], eigenvector centrality [13], k-shell [14], etc. According to node degree centrality [9], we can obtain the number of routes for each airport in an aviation network; thus, airports with more routes are of higher importance. Furthermore, scholars also considered the problem of edge importance and different approaches are presented, including WERA-KPath (WKP) [15], edge betweenness centrality (EBC) [16,17], Link Importance (LI) [18], Nearest-neighbor edge centrality [19], etc. The above methods can be effectively applied to address practical problems, such as community detection [20–22], virus/information diffusion [23–27].
In recent years, many infectious diseases spread globally, countries around the world are actively looking for effective countermeasures to suppress epidemic. Studying heterogeneity of nodes and edges may play an important role in reducing virus impact. For example, nodes and edges to be removed in aviation networks corresponds to airports to be isolated and routes to be canceled, respectively. With these measures, some undesired effects might be limited. However, removing nodes has a more serious impact on the connectivity of the network than removing edges; furthermore, greater cost and impact might also be incurred in practice. To achieve the purpose of effectively suppressing epidemic and protecting network connectivity simultaneously, we propose a method EBD to measure edge importance through combining edge degree centrality and edge betweenness centrality. After that, extensive experiments are conducted to verify its effectiveness.
The reminder of our work is organized as follows: In Section 2, some existing edge importance methods are reviewed. Then, in Section 3, our proposed method is explained explicitly while the difference between our method and existing ones are presented. Later, extensive experiments are conducted with the obtained results being provided in Section 4. The performance of our method is compared to that of existing ones with sufficient discussions. Eventually, Section 5 concludes this work with some future research directions being provided.
Firstly, we suppose a complex network is formulated as G(V, E), where V and E stand for the node set and edge set, respectively,
In [28], Freeman presents the node betweenness centrality, and then Girvan and Newman extend the definition of betweenness centrality from nodes to edges [16]. Later, Newman implements it in [17]. The concept of edge betweenness centrality indicates that the edges which are more important than the others are likely to be central. We use CB to denote quantitative value of edge importance which is defined as:
where e ∈ E, Sij represents the number of shortest paths from node i to node j and sij(e) indicates the number of the shortest paths from node i to node j which pass through edge e. If there exists no path linking i and j, we set
De Meo et al. apply Random-Walk to measure edge importance [15]. A total of m − 1 rounds of loops are carried out with performing 10 Random-Walk in each loop from a random node (m indicates the number of edges in the network). Then, the number of times for each edge being traversed will be recorded. After that, the edge importance sequence is sorted in descending order according to the recorded traversal times (i.e., CW).
Aiming to suppress epidemic effectively under SIS model, Joan T. Matamalas et al. propose a method for assessing the importance of edges during the spreading process, called Link Importance (LI) [18]. Specifically, they first define a model named ELE which is similar as the SIS model. Through the ELE model, they conduct the disease spreading process until the system converges to a steady state. Then, if nodes i and j are directly connected, they can obtain the probability P(ϖi = S, ϖj = I) (i.e., the probability of node i is susceptible and node j is infectious) which is represented by Φij, and the probability P(ϖi = ϖj = I) (given by
where Iij stands for the importance of edge eij and A represents the adjacency matrix of network G. According to Eq. 2, after a node being infected by its neighbors, we can effectively evaluate the extent of the impact being applied on neighboring nodes by the newly infected node. For instance, we assume that two nodes being connected by an edge eij are in different states, i.e., susceptible and infectious, respectively. When the susceptible node is infected by an infectious one, if the newly affected node has a larger number of neighbors, the authors suppose it will infect more nodes.
According to the analysis of existing studies, EBC tends to achieve better effect of spreading control compared with the others; however, greater damage will be incurred to network connectivity. WKP has high randomness; hence, it is not effective in spreading control and network connectivity protection. LI can protect network connectivity well, but the effect of spreading control is worse than that of EBC. In summary, existing methods cannot achieve excellent performance in both epidemic suppression and network connectivity protection. However, both aspects are of great significance. Taking the aviation network as an example, on the one hand, it is necessary to suppress epidemic to reduce the spreading range; thus, it is very important to reduce the necessary overhead as much as possible. On the other hand, to meet the requirements of world-wide transportation, it is also of great significance to ensure the accessibility between countries. Therefore, we propose a method (being denoted as EBD) which is effective in spreading control and protecting network connectivity simultaneously.
In this work, we propose a new method to measure the importance of edges through combining degree centrality and EBC. With our proposed approach, we can control the spreading phenomena and protect the network connectivity effectively after removing some of the most important edges.
In this paper, we adopt the widely utilized SIS model to simulate the spreading process. Accordingly, each node can be either in a state of S (susceptible) or I (infectious). The node in the I state can infect the neighboring nodes in the S state with probability μ, while the node in the I state can recover with probability γ, the overall state transition process can be depicted as in Figure 1. According to [29], we can derive the epidemic threshold λc (i.e., if μ/γ > λc, the virus will spread forever; otherwise, the virus will disappear quickly) in degree uncorrelated networks which is provided as:
where
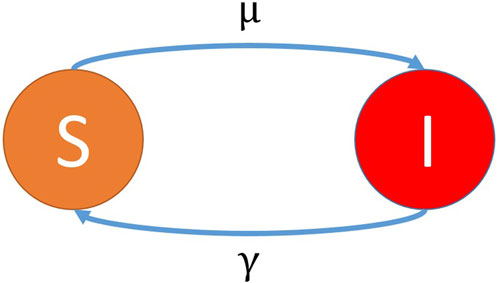
FIGURE 1. Illustration of the adopted SIS model.
According to the definition of λc, it is obvious that we can control the virus spreading process through increasing the epidemic threshold. After a theoretical analysis, we find that when we remove an edge (eij ∈ E, i, j ∈ V),
As in Eq. 4, we find that a larger (ki + kj) usually indicates a larger
where υM and σM represent the average value and standard deviation of ki × kj in all edges, respectively; υA and σA stand for the average value and standard deviation of ki + kj in all edges, respectively; υ and σ are used to normalize ki + kj and ki × kj. As in Eq. 5, we find that the influence of the two aspects in the MA can be adjusted by changing η and we set η = {0, 0.2, 0.4, 0.6, 0.8, 1}. Finally, we repeatedly remove the edge with the largest MA for different η. Then, we obtain the fraction of infectious nodes Iprop in steady state by simulating the SIS model after every 0.04m edges are removed in usAir97 network. The experimental results are shown in Figure 2. According to Figure 2, we find that when the fraction of removed edges is less than 0.45, the effect of spreading control becomes better when a smaller η is adopted. However, there are many nodes that are infected in all η. Then, when 0.65 > β > 0.45, large η leads to better effect of spreading control and small spread range of virus. In addition, the effect of spreading control for the scenario of η = 0 is much worse than that for η = 1 when 0.65 > β > 0.45. Note that, since the lines in Figure 2 are relatively dense, the error bars are not provided. Moreover, the maximum standard deviation of the data points on each line in Figure 2 is in [0.03, 0.04]. From above analysis, compared with ki + kj, the adoption of ki × kj can achieve the purpose of reducing the epidemic on a large scale while removing fewer edges. Therefore, we adopt
to represent the importance of edge, where CD(est) represents degree centrality of edge est.

FIGURE 2. The effect of different values of η on epidemic suppression. We show the faction of infectious nodes in steady state (Iprop), as a function of the fraction of removed edges (β) in usAir97 network (μ = 0.06, γ = 0.4), where the numbers in the legend represent the values of η. Note that, the value of each point is the result of averaging 100 simulated values of Iprop.
In addition to the spreading ability of edges, we also consider the effect of edge removal on network connectivity when studying the edge sorting algorithm. Generally speaking,

FIGURE 3. An example showing the effect of removing edges on network connectivity. (A) shows the initial network which consists of 9 nodes and 12 edges. The thickness of these colored solid lines corresponds to the CD of the edge, the derived set according to CD in descending order is
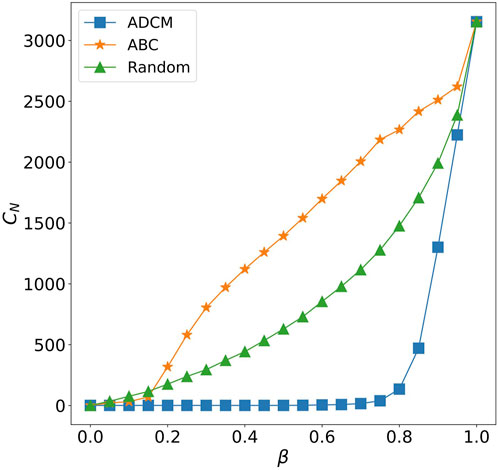
FIGURE 4. The effect of edge removing on network connectivity based on different methods. We show the number of connected components (CN), as a function of the faction of removed edges (β) in the Global airline network. We compare three different approaches: ADCM, ABC and Random.
From another perspective, since infectious diseases always originate from one or a few people, the spreading range is usually limited in the connected components where the seed nodes are located in. Therefore, when some edges are removed, the method which dismantles the network into many connected components is effective in epidemic suppression, while CD is less effective in epidemic suppression (the corresponding experimental results will be provided in Section 4). To solve this problem, it is necessary to find a method that incorporates CD to increase the effect of epidemic suppression when fewer edges are removed. Furthermore, individual aggregation is a common phenomenon in practical networks. For example, in the aviation network, there are close connections between airports belonging to the same country, but fewer routes between airports in different countries; this results in the fact that modules are usually connected by few edges. According to [31], edges with higher CB are usually the links connecting different modules. Therefore, removing edges with high CB first can quickly decompose the network into small connected components. Figure 4 also shows that EBC-based ABC can quickly decompose the network into many connected components.
Based on the above discussions, we propose our method EBD through combining EBC (CB) with CD and a new edge importance evaluation index CBD is defined as:
where e is an element from the edge set E and α stands for an adjustable parameter (α ∈ [0, 1]). Since CD and CB belong to different orders of magnitude (e.g., CD(e58) = 16 and CB(e58) = 0.25 in Figure 3A), these two indicators should be normalized before fusion. In this paper, we adopt the max normalization (i.e.,
In this article, we dynamically update CBD to derive the edge importance ranking sequence (i.e., SBD). The updating processes are provided as:
• Step 1: Initialization, we select a complex network G(V, E) and set an empty edge ranking sequence SBD = {};
• Step 2: Calculate CBD of each edge in the current network G according to Eq. 7;
• Step 3: Remove the edge with the largest CBD from G (if there exist multiple edges with same CBD, we will randomly select one and then remove it); then, the removed edge is added to the end of sequence SBD;
• Step 4: If there still exist edges in G, we need to go back to Step 2;
• Step 5: Determine the edge importance ranking sequence SBD.
Through the above steps, an edge ranking sequence sorted in declining order according to the edge importance index CBD will be obtained
To evaluate the performance of our proposed method, some baselines are adopted, including ADCM, Random, WKP, ABC and LI. For ADCM, we need to repeatedly remove the edge eij with the largest ki × kj from the remaining network (here, ki indicates the degree of node i). As to Random, we randomly remove edges. For WKP, we need to repeatedly remove the edge with the largest CW from the remaining network. For ABC [32], we repeatedly remove the edge with the largest CB from the remaining network. As to LI, the edge with the largest Iij is repeatedly removed from the remaining network. Similarly, in our approach, we continuously remove the edge with the largest EBD from the remaining network.
In the following experiments, we mainly consider seven practical networks including usAir97 (UA) [33], Global airline (GA), Facebook combined (FC) [34], Ca netscience (CN) [33], Soc hamsterster (SH) [33], ca CondMat (CC) [33] and email EU (EE) [33]. The UA network is a small aviation network which is constructed based on the US aviation network in 1997 (nodes and edges stand for airports and routes, respectively). The GA network is obtained from OpenFlights (https://openflights.org), in which airports are denoted by nodes and airlines between airports are captured by the corresponding edges. As to FC, it consists of “circles” (or “friends lists”) from Facebook, the data is collected from survey participants using this Facebook app (nodes stand for Facebook users, if two users are friends then we need to add an edge between them). CN and CC denote collaborative networks of researchers (nodes stand for researchers, if two researchers have collaboration on articles, then an edge need to be added between them). As to SH, it indicates a social network (nodes stand for people, if two people are friends, an edge exists between them). EE is an email network (nodes stand for email users, if two users are contacted by an email, then an edge exists between them). Table 1 illustrates the characteristics of the adopted networks, where n, m,
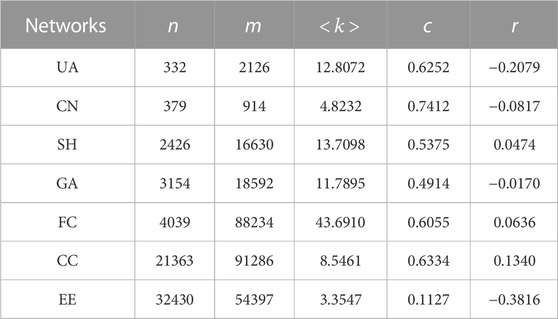
TABLE 1. Seven practical networks used for experimental analysis.
To evaluate the performance, two indicators are adopted (i.e., Iprop and CN). Firstly, we utilize the proportion of infectious nodes in stable state (Iprop) to stand for the effect of epidemic suppression. Here, the SIS model is considered; with the provided network topology, we can simulate the spreading phenomena accordingly. Certain number of iterations of the SIS model will result in a steady number of infectious and susceptible nodes in the network. Smaller Iprop indicates the method is more effective in epidemic suppression. Secondly, as in Section 3, we also consider network connectivity after removing edges. Same as Figure 4, we consider the number of connected components in the network (CN) to evaluate the performance of different methods.
A small CN indicates that the corresponding method is less harmful to network connectivity. Like epidemic suppression, network connectivity also possesses great practical significance. For example, the aviation network is decomposed into many connected components due to epidemic suppression, which leads to a large number of routes that have been eliminated must be added back to the aviation network if there is an emergency situation that necessitates traveling from one connected component to another. However, if there are few connected components in the network, then only a few routes need to be added. To sum up, when we remove the same number of edges, the smaller the values of Iprop and CN, the better the performance of the method.
To evaluate the performance of EBD, the corresponding results are compared with those obtained by ADCM, random, WKP, ABC and LI. Firstly, we use the comparison methods and our method to obtain the edge importance sequence, respectively. Secondly, we remove edges according to these edge importance sequences respectively. We remove the edges at a certain portion (i.e., 4%) each time until all edges are removed and simulate 100 times using SIS model. Finally, we calculate the average Iprop and standard deviation of 100 simulation results after each removing. Note that when we simulate the propagation process through the SIS model, we randomly select only one node as the seed node initially, and the number of iterative times is large enough for the system to converge. The means of calculating CN is provided as follows: we remove the top 0.04m edges until all edges are removed according to edge importance sequence and calculate CN per time.
Based on the above preparation, we first study the effect of different values of α on our method in the GA network, as the results are shown in Figure 5. According to Figure 5, given the same number of edges are removed, with the increase of α, Iprop decreases continuously, in contrast to the constant increase of CN. In addition, the standard deviation remains relatively stable and does not exhibit significant change. Thus, these results confirm our assumption. With the increase α, the effect of betweenness centrality increases gradually leading to the network connectivity is more severely destroyed and enhancing epidemic suppression effectiveness when a few edges are removed. Controlling the spread of virus is relatively effective when α = 0.5, and network connectivity is not significantly affected. When α is less than 0.5, even though network connectivity protection is improved, epidemic suppression is ineffective; when α is greater than 0.5, the effect of epidemic suppression becomes better, but network connectivity cannot be protected. As we normalize CB and CD before the fusion process, the above phenomena can be explained as follows. Firstly, when α is greater than 0.5, EBC dominates EBD. Furthermore, since EBC selects the most central edge to remove, the network will be quickly decomposed into a number of small connected components which leads to better performance in epidemic suppression at a cost of sacrificing connectivity protection. Secondly, when α is less than 0.5, ADCM dominates EBD. As ADCM selects the edge with the largest degree multiplication for removal, EBD with small α has an advantage of connectivity protection at a cost of sacrificing epidemic suppression when some edges are removed. Note that since increasing the epidemic threshold is the starting point of ADCM, when α decreases, fewer edges need to be removed to total epidemic control which means Iprop → 0. Thus, we set α = 0.5 to achieve a trade-off between the two aspects.
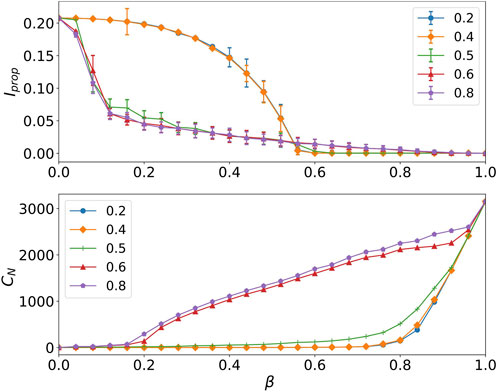
FIGURE 5. The effect of different values of α on network connectivity and epidemic suppression. We show the spread range (Iprop) and the number of connected components (CN), as a function of the faction of removed edge (β) in GA network, where the numbers in the legend represent the values of α. The error bars of all points are shown in the top plot.
In the following experiments, we set α = 0.5 in Eq. 7. In Figure 6, Figure 7 and Table 2, EBD achieves better performance at epidemic suppression and protection of network connectivity. According to Figure 6 and Table 2, we can carefully make the following conclusions. Firstly, the performance of EBD with α = 0.5 in epidemic suppression is better than that of LI, WKP, ADCM and Random, which proves the efficiency of our proposed method. Secondly, the error bar of EBD falls within the acceptable range (the maximum standard deviations of EBD in FC, GA, CN, SH, EE and CC are 0.012, 0.015, 0.011, 0.025, 0.022 and 0.027, respectively) which demonstrates the effectiveness of results. Finally, according to Figure 7, when α = 0.5 in EBD, it has a good effect in protecting network connectivity while the other methods with similar effects in protecting connectivity, are much worse than EBD at epidemic suppression. The authors of the LI method emphasize the advantages of connectivity protection at the cost of losing epidemic suppression. Our method has both the above advantages.
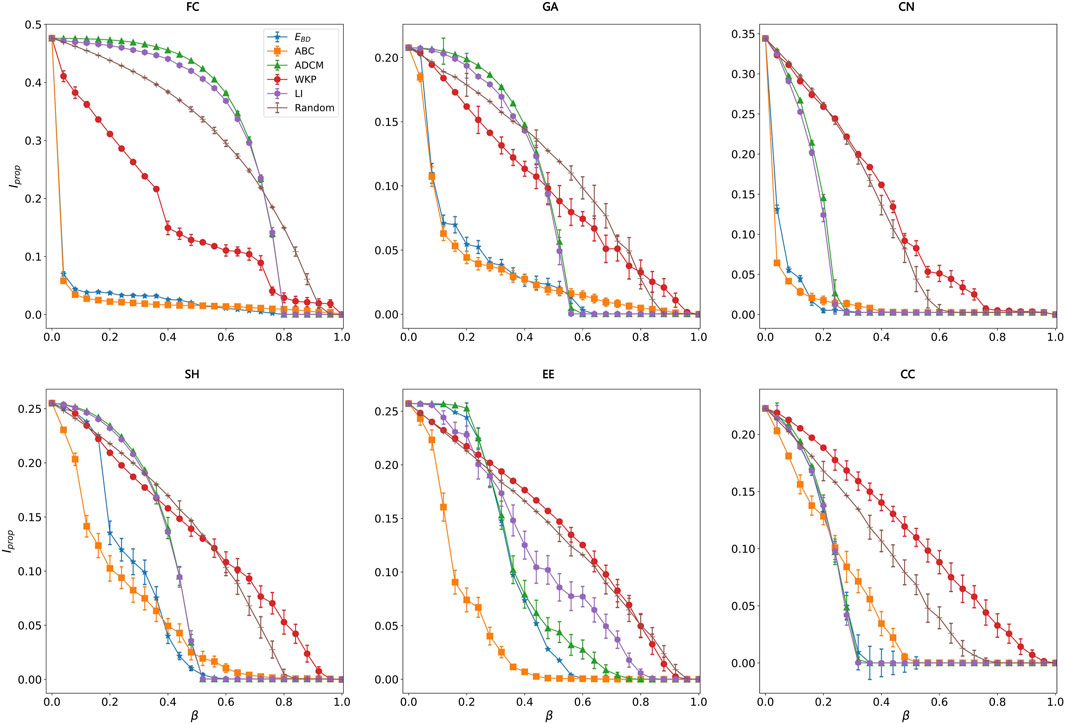
FIGURE 6. Performance of our method EBD (α =0.5) and the others in epidemic suppression with experiments being conducted on six practical networks (i.e., FC, GA, CN, SH, EE and CC). The vertical axis represents the proportion of infectious nodes (i.e., Iprop) in the stationary state and the horizontal axis represents the proportion of edges being removed (i.e., β), the error bars are displayed at each point. Note that, μ =0.06 and γ =0.5 in GA, FC and SH, μ =0.2 and γ =0.5 in CN and EE, μ =0.06 and γ =0.4 in CC.
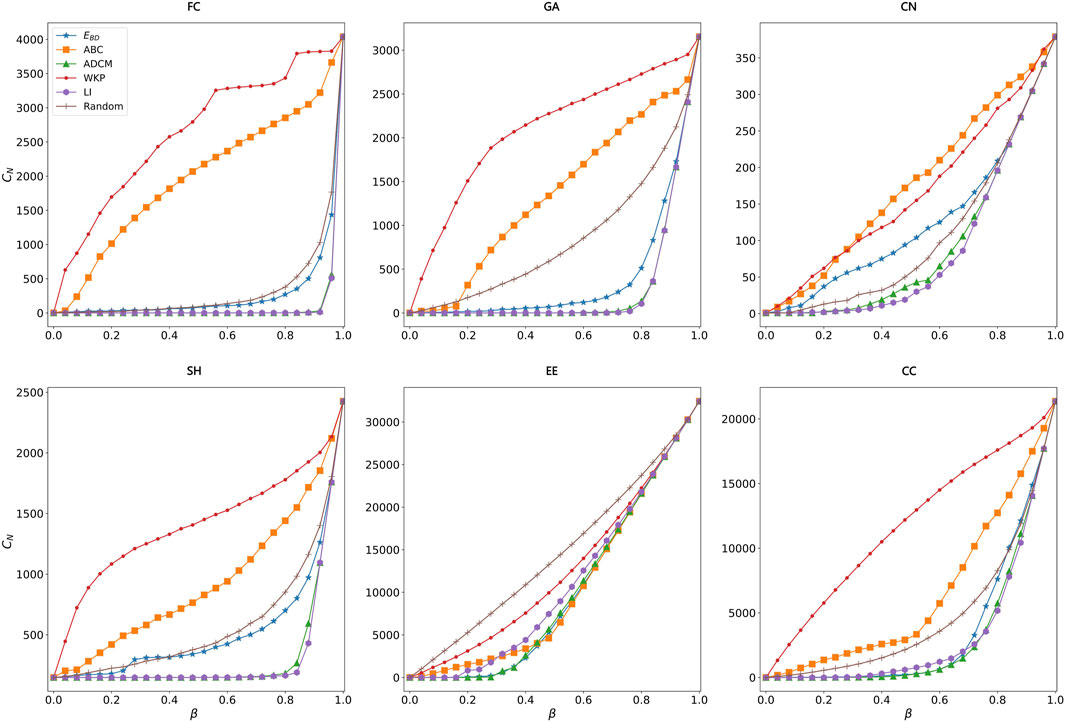
FIGURE 7. Performance comparison of our method EBD (α =0.5) and the others in preserving connectivity. Here, six networks (i.e., FC, GA, CN, SH, EE and CC) are considered. The vertical axis represents the number of connected components (CN) in current network, and the horizontal axis represents β which means the proportion edges being removed in the network.
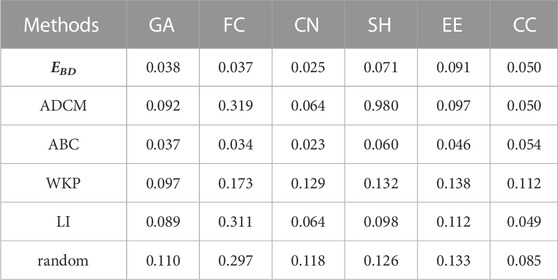
TABLE 2. Average Iprop in different networks. The obtained numbers represent the average value of ordinates of points on the same line in Figure 6.
In addition to the practical networks, we also conduct experiments on generated networks (i.e., BA and ER networks). As shown in Figure 8, we find that the performance of our proposed method in epidemic suppression seems to be similar as three methods (i.e., ABC, ADCM and LI) which is much better than the others. In the ER network, since the properties of all edges are relatively comparable, the performance of these methods in epidemic suppression are similar.

FIGURE 8. Performance comparison of our method EBD (α =0.5) and the other methods in epidemic suppression. We show the spread range (Iprop), as a function of the faction of removed edge (β) in two generated networks (BA network and ER network). For BA network, the number of nodes equals to 5,000 and the corresponding average degree is 6; as to ER network, the number of nodes is 5,000 and the average degree is 12. For both networks, the recovery probability γ is set to 0.5; the infectious probability μ is assigned to 0.2 and 0.06 for BA and ER networks, respectively.
In the BA network, we design a sequence similarity verification experiment to explore the potential power of the proposed method in epidemic suppression. Furthermore, we adopt Jaccard index [35] to reflect the correlations between edge ranking sequences derived by different methods. The specific calculation steps of Jaccard index are as follows. Firstly, the correlation between two sequences is calculated as:
where a indicates a parameter (a ∈ [0, 1]), S1(a) and S2(a) represent the sets formed by the first a × m elements of sequence S1 and sequence S2, respectively. Then, we calculate the correlation for the whole sequence:
where 100 indicates that we divide the sequence into 100 short sequences of the same length, incrementally calculate the correlation of the sequences, and eventually obtain the average. According to Eq. 8 and Eq. 9, we conduct some experiments. As shown in Figure 9, the Jaccard indexes between our method and ABC, ADCM, and LI in the BA network are all greater than 0.79, which reveals the edge sequence obtained by our method is similar to those obtained by the other methods. Therefore, the four methods can achieve good performance in epidemic suppression.
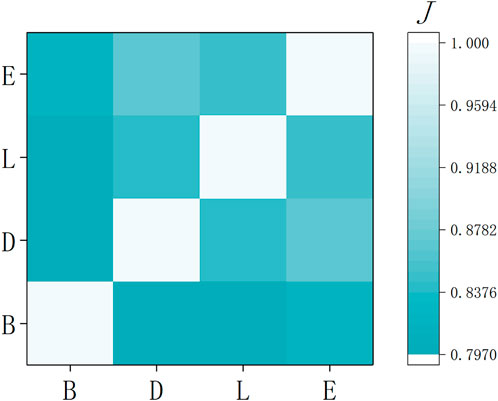
FIGURE 9. The correlation heat map for the four indices of edge importance over BA network. Here, B, D, L and E represent ABC, ADCM, LI and EBD, respectively.
In summary, we propose a method to rank edges according to the degree of the connected nodes and betweenness centrality of the edge. From the perspectives of epidemic suppression and connectivity protection, we first consider using the product of the degrees of the two nodes to increase epidemic threshold and protect network connectivity. However, when some portion of edges are removed, it has bad effect on epidemic suppression. Here, we propose a new method (i.e., EBD) combined with EBC to eliminate the bad effect. The experiments demonstrate that the proposed approach achieves better results compared with the other methods when some edges are removed. Furthermore, our method can not only protect the connectivity of networks, but also possess much better epidemic suppression effects. In the future, we will study and expand our method in other spread models (e.g., SIR and SEIR) or other types of networks (e.g., time-varying network and double-layer network) to increase the universality of our method.
Publicly available datasets were analyzed in this study. This data can be found here: https://networkrepository.com, https://openflights.org, http://snap.stanford.edu/data/.
GL wrote the original manuscript. XC and PZ proposed the idea, supervised the research work, and revised the manuscript. GL and PZ discussed and analyzed the results.
This work was supported in part by the National Key R&D Program of China (No. 2020AAA0107704), National Natural Science Foundation of China (Grant Nos. 62073263, 62003273), Natural Science Basic Research Program of Shaanxi (Program No. 2020JQ-217), Key Research and Development Program of Shaanxi Province (Grant No. 2022KW-26), Technological Innovation Team of Shaanxi Province (Grant No. 2020TD-013).
The authors declare that the research was conducted in the absence of any commercial or financial relationships that could be construed as a potential conflict of interest.
All claims expressed in this article are solely those of the authors and do not necessarily represent those of their affiliated organizations, or those of the publisher, the editors and the reviewers. Any product that may be evaluated in this article, or claim that may be made by its manufacturer, is not guaranteed or endorsed by the publisher.
1. Boccaletti S, Latora V, Moreno Y, Chavez M, Hwang DU. Complex networks: Structure and dynamics. Phys Rep (2006) 424:175–308. doi:10.1016/j.physrep.2005.10.009
2. Arenas A, Díaz-Guilera A, Kurths J, Moreno Y, Zhou C. Synchronization in complex networks. Phys Rep (2008) 469:93–153. doi:10.1016/j.physrep.2008.09.002
3. Heckmann T, Schwanghart W, Phillips JD. Graph theory—Recent developments of its application in geomorphology. Geomorphology (2015) 243:130–46. doi:10.1016/j.geomorph.2014.12.024
4. Baronchelli A, Ferrer-i Cancho R, Pastor-Satorras R, Chater N, Christiansen MH. Networks in cognitive science. Trends Cogn Sci (2013) 17:348–60. doi:10.1016/j.tics.2013.04.010
5. Barabási A-L, Gulbahce N, Loscalzo J. Network medicine: A network-based approach to human disease. Nat Rev Genet (2011) 12:56–68. doi:10.1038/nrg2918
6. Li J, Sun G, Jin Z. Interactions of time delay and spatial diffusion induce the periodic oscillation of the vegetation system. Discrete and Continuous Dynamical Systems-B (2022) 27:2147–72. doi:10.3934/dcdsb.2021127
7. Sun G, Zhang H, Song Y, Li L, Jin Z. Dynamic analysis of a plant-water model with spatial diffusion. J Differential Equations (2022) 329:395–430. doi:10.1016/j.jde.2022.05.009
8. Li J, Sun G, Guo Z. Bifurcation analysis of an extended klausmeier–gray–scott model with infiltration delay. Stud Appl Maths (2022) 148:1519–42. doi:10.1111/sapm.12482
9. Christley RM, Pinchbeck G, Bowers RG, Clancy D, French NP, Bennett R, et al. Infection in social networks: Using network analysis to identify high-risk individuals. Am J Epidemiol (2005) 162:1024–31. doi:10.1093/aje/kwi308
10. Pastor-Satorras R, Vespignani A. Immunization of complex networks. Phys Rev E (2002) 65:036104. doi:10.1103/PhysRevE.65.036104
11. Zhang H, Li K, Fu X, Wang B. An efficient control strategy of epidemic spreading on scale-free networks. Chin Phys Lett (2009) 26:068901. doi:10.1088/0256-307X/26/6/068901
12. Newman ME. A measure of betweenness centrality based on random walks. Social Networks (2005) 27:39–54. doi:10.1016/j.socnet.2004.11.009
13. Bonacich P. Some unique properties of eigenvector centrality. Soc Networks (2007) 29:555–64. doi:10.1016/j.socnet.2007.04.002
14. Kitsak M, Gallos LK, Havlin S, Liljeros F, Muchnik L, Stanley HE, et al. Identification of influential spreaders in complex networks. Nat Phys (2010) 6:888–93. doi:10.1038/nphys1746
15. De Meo P, Ferrara E, Fiumara G, Ricciardello A. A novel measure of edge centrality in social networks. Knowledge-Based Syst (2012) 30:136–50. doi:10.1016/j.knosys.2012.01.007
16. Girvan M, Newman ME. Community structure in social and biological networks. Proc Natl Acad Sci (2002) 99:7821–6. doi:10.1073/pnas.122653799
17. Newman ME, Girvan M. Finding and evaluating community structure in networks. Phys Rev E (2004) 69:026113. doi:10.1103/PhysRevE.69.026113
18. Matamalas JT, Arenas A, Gómez S. Effective approach to epidemic containment using link equations in complex networks. Sci Adv (2018) 4:eaau4212. doi:10.1126/sciadv.aau4212
19. Bröhl T, Lehnertz K. A straightforward edge centrality concept derived from generalizing degree and strength. Scientific Rep (2022) 12:4407–12. doi:10.1038/s41598-022-08254-5
20. Aghaalizadeh S, Afshord ST, Bouyer A, Anari B. A three-stage algorithm for local community detection based on the high node importance ranking in social networks. Physica A: Stat Mech its Appl (2021) 563:125420. doi:10.1016/j.physa.2020.125420
21. El Kouni IB, Karoui W, Romdhane LB. Node importance based label propagation algorithm for overlapping community detection in networks. Expert Syst Appl (2020) 162:113020. doi:10.1016/j.eswa.2019.113020
22. Wang Z, Hou D, Gao C, Huang J, Xuan Q, Castellanos FX, et al. Cerebro-cerebellar dysconnectivity in children and adolescents with attention-deficit/hyperactivity disorder. Proc ACM Web Conf (2022) 61:1372–84. doi:10.1016/j.jaac.2022.03.035
23. Liu J, Ren Z, Guo Q. Ranking the spreading influence in complex networks. Physica A: Stat Mech its Appl (2013) 392:4154–9. doi:10.1016/j.physa.2013.04.037
24. Wang Z, Jusup M, Shi L, Lee J-H, Iwasa Y, Boccaletti S. Exploiting a cognitive bias promotes cooperation in social dilemma experiments. Nat Commun (2018) 9:2954. doi:10.1038/s41467-018-05259-5
25. Wang Z, Wang C, Gao C, Li X, Li X. An evolutionary autoencoder for dynamic community detection. Sci China Inf Sci (2020) 63:212205–16. doi:10.1007/s11432-020-2827-9
26. Zhu P, Cheng L, Gao C, Wang Z, Li X. Locating multi-sources in social networks with a low infection rate. IEEE Trans Netw Sci Eng (2022) 9:1853–65. doi:10.1109/TNSE.2022.3153968
27. Li Q, Cheng L, Wang W, Li X, Li S, Zhu P. Influence maximization through exploring structural information. Appl Maths Comput (2023) 442:127721. doi:10.1016/j.amc.2022.127721
28. Freeman LC. A set of measures of centrality based on betweenness. Sociometry (1977) 40:35–41. doi:10.2307/3033543
29. Pastor-Satorras R, Vespignani A. Epidemic dynamics in finite size scale-free networks. Phys Rev E (2002) 65:035108. doi:10.1103/PhysRevE.65.035108
30. Van Mieghem P, Stevanović D, Kuipers F, Li C, Van De Bovenkamp R, Liu D, et al. Decreasing the spectral radius of a graph by link removals. Phys Rev E (2011) 84:016101. doi:10.1103/PhysRevE.84.016101
31. Ferreira SC, Castellano C, Pastor-Satorras R. Epidemic thresholds of the susceptible-infected-susceptible model on networks: A comparison of numerical and theoretical results. Phys Rev E (2012) 86:041125. doi:10.1103/PhysRevE.86.041125
32. Wang S, Gong M, Liu W, Wu Y. Preventing epidemic spreading in networks by community detection and memetic algorithm. Appl Soft Comput (2020) 89:106118–8. doi:10.1016/j.asoc.2020.106118
33.[Dataset] Rossi RA, Ahmed NK. The network data repository with interactive graph analytics and visualization. Proc AAAI Conf Artif Intelligence (2015) 29. doi:10.1609/aaai.v29i1.9277
34. Leskovec J, Mcauley J. Learning to discover social circles in ego networks. Adv Neural Inf Process Syst (2012) 25:1–9.
Keywords: complex networks, epidemic suppression, network connectivity, edge importance, network science
Citation: Liang G, Cui X and Zhu P (2023) An effective method for epidemic suppression by edge removing in complex network. Front. Phys. 11:1164847. doi: 10.3389/fphy.2023.1164847
Received: 13 February 2023; Accepted: 06 March 2023;
Published: 17 March 2023.
Edited by:
Xiaoming Zheng, Central Michigan University, United StatesReviewed by:
Yilun Shang, Northumbria University, United KingdomCopyright © 2023 Liang, Cui and Zhu. This is an open-access article distributed under the terms of the Creative Commons Attribution License (CC BY). The use, distribution or reproduction in other forums is permitted, provided the original author(s) and the copyright owner(s) are credited and that the original publication in this journal is cited, in accordance with accepted academic practice. No use, distribution or reproduction is permitted which does not comply with these terms.
*Correspondence: Xiaodong Cui, eGlhb2RvbmcuY3VpQG53cHUuZWR1LmNu; Peican Zhu, ZXJpY2NhbkBud3B1LmVkdS5jbg==
Disclaimer: All claims expressed in this article are solely those of the authors and do not necessarily represent those of their affiliated organizations, or those of the publisher, the editors and the reviewers. Any product that may be evaluated in this article or claim that may be made by its manufacturer is not guaranteed or endorsed by the publisher.
Research integrity at Frontiers
Learn more about the work of our research integrity team to safeguard the quality of each article we publish.