 Yao Qu
 Yong-Ou Zhang
 Yi-Fan Li
 Tao Zhang2
94% of researchers rate our articles as excellent or good
Learn more about the work of our research integrity team to safeguard the quality of each article we publish.
Find out more
ORIGINAL RESEARCH article
Front. Phys., 07 April 2023
Sec. Physical Acoustics and Ultrasonics
Volume 11 - 2023 | https://doi.org/10.3389/fphy.2023.1163148
This article is part of the Research TopicUltrasound Micromanipulations and Ocean Acoustics: From Human Cells to Marine StructuresView all 11 articles
As one of the three major noise sources of submarines, flow-induced noise plays a key role for the stealth capability of submarines. Several research studies based on experiment or simulation have evaluated the sound radiation from the scale model; however, it is still a great challenge to efficiently evaluate the flow-induced noise of a large-scale prototype. In order to solve this problem, the flow-induced noise of different scale submarines is analyzed, and both the similarity law and the scale effect are discussed in the dimensionless frequency St = 10–1089. The fully appended DARPA SUBOFF, a famous benchmark submarine model, is used in our research. The relationship between the sound power, scale variables, and the speed and scale variables is obtained using the Buckingham Pi theorem. Then, the sound pressure level and the sound power level of the SUBOFF, with the scale ratio of 1:24 and 1:48 and the speed of 2, 4, and 8 m/s, are calculated based on the large-eddy simulation (LES)/Lighthill hybrid method. Finally, the scale effect between a hypothetical prototype (actually, a benchmark SUBOFF model with a scale ratio of 1:8) and its scale models are discussed at the same speed. The numerical results show that the submarine’s sound power level conforms to the similarity relationship of dipole source within the cut-off frequency St = 100. The error of the sound power level is about 20 lg (
There are three main radiated noise sources in submarines, ships, and airplanes, including mechanical noise, propeller noise, and hydrodynamic/aerodynamic noise. Among them, hydrodynamic and aerodynamic noises are divided into flow-induced noise (rigid wall) and flow-excited noise (elastic wall) [1]. The generation mechanism of various noise sources has been comprehensively discussed by scholars. However, due to the large size for those vehicles, noise assessment of the prototype has always been a challenge.
For most studies, noise assessment of the full-scale model is usually based on experiments, for example, measuring different submarines’ noise through sea trial [2], monitoring hydrodynamic noise generated by different merchant ships on the fixed channel [3], and determining the location of aerodynamic noise source when the aircraft takes off and lands on both sides of the airport runway [4]. Although the experiment can obtain accurate values under actual conditions, it is greatly affected by environmental conditions and consumes considerable manpower and financial resources. Evidently, it is difficult to carry out experiments for many design studies.
At present, the main solution is to extrapolate from scale model results to prototype, which requires the similarity law in advance. The International Towing Tank Conference (ITTC) paid attention to similarity studies of the ship noise in previous conferences such as the hydrodynamic noise [5] and propeller noise [6]. During the last decades, there were abundant experimental research studies on similarity of the propeller noise. Lee et al. [7] first verified the similarity law of the propeller tonal noise. Based on the conclusion proposed by the ITTC in 1987, Tani et al. [8] developed and tested a similarity relationship of four conventional propellers of different scales in the cavitation test tunnel. Park et al. [9] established a novel similarity law to estimate propeller tip vortex cavitation noise and obtained more consistent prediction than the results of ITTC. In addition, some scholars also conducted experiments on similarity studies of the flow-induced noise. Arakeri et al. [10] found a similarity law where the flow-induced noise of the axisymmetric body was proportional to the seventh power of inflow velocity. Based on the same simplified landing gear model, Xing et al. [11] obtained the sound pressure level spectrums of the flow-induced noise at different speeds and then normalized the amplitude according to the dipole characteristics and the frequency according to the Helmholtz similarity. The low-speed results are in good agreement with those of high speed, which verified that the acoustic source type of the landing gear is dipole in the low-frequency range.
With the development of computational fluid dynamics and the improvement of computer performance, the numerical prediction method has become a mainstream method [12, 13]. The Lighthill acoustic analogy and the Ffowcs Williams and Hawkings (FW-H) are the main numerical methods for predicting radiated noise. Yang et al. [14] calculated a non-cavitating propeller noise of three different scale models by using the large-eddy simulation (LES)/Lighthill hybrid method and found that the scale effect increased with the increase of the scale ratio. Bosschers et al. [15] proposed a semi-empirical method to predict the hull pressure fluctuation and radiated noise caused by propeller tip vortex cavitation noise, and they compared the predicted results with the measured results using the boundary element method. In the anechoic chamber wind tunnel, Li et al. [16] verified that the frequencies of the different scale cylinders satisfy the similarity of the Strouhal number, and they studied the similarity in different media based on the FW-H numerical method. There were abundant numerical calculations to discuss the submarine performance under small-scale models, including resistance characterization [17], flow characterization [18], radiated noise [19], and self-noise [20]. As for the full-scale model, Sezen et al. [21] analyzed the scale effect of the submarine’s hydrodynamic performance based on the Reynolds-averaged Navier–Stokes (RANS) method.
As one can notice, under the general computing resource, most of the numerical methods adopted by scholars only studied the small-scale model. Numerical calculation of the full-scale submarines mainly focused on hydrodynamic performance such as drag and self-propulsion characteristics instead of the radiated noise performance. The radiated noise characteristics of the full-scale model can be effectively obtained by studying the acoustic similarity law. To the best of the authors’ knowledge, there are few open research studies on the similarity law of submarine’s radiated noise. Moreover, the reduction technology of mechanical noise and propeller noise (non-cavitating) has relatively matured [22, 23]. On this basis, this study is to analyze the similarity of submarine’s flow-induced noise based on the numerical method.
In order to achieve the aforementioned outlined objectives, the fully appended SUBOFF (a benchmark submarine) is selected as the research object, which is fully and deeply submerged by water (i.e., ignoring the influence of wave resistance and free surface on sound propagation). Due to the limitation of computer resources, the similarity of the sound pressure level (SPL) and the sound power level (SWL) in the low-frequency range St = 10–1089 is discussed based on the LES/Lighthill hybrid method. This study is organized as follows: Section 2 introduces numerical methods and numerical models. In Section 3, the similarity conditions and the relationship of the far-field unsteady sound pressure are presented. The obtained similarity laws of the SPL and SWL are verified in Section 4. Section 5 discusses the scale effect of different scale models and the conclusion is included in Section 6.
There are two main calculation methods for flow-induced noise: direct method and hybrid method. The direct method is based on the compressible Navier–Stokes equations to calculate the sound pressure field in the whole fluid domain. The hybrid method decouples the flow field and acoustic field for calculation, which ignores the influence of flow on sound propagation. The former is quite difficult for calculating the large-scale and complex models. This paper adopted the LES/Lighthill hybrid method, which had been proved to be effective in predicting flow-induced noise [24, 25].
Figure 1 presents the common flow chart of the coupling algorithm in predicting the submarine’s flow-induced noise. First, the SST k-ω turbulence model was used to calculate the steady flow field. Based on the initial steady results, the LES turbulence model was used to predict the transient flow field and then obtain the converged velocity results. The wall-adapting local eddy-viscosity model (WALE) was selected as the sub-grid model. Then, the unsteady results were interpolated to the acoustic grids after DFT transformation. Finally, the acoustic field was calculated based on the variational Lighthill equation under the volume integral [26]. In the flow field calculation of this study, the second-order scheme was used for spatial discretization, velocity pressure coupling algorithm, for the SIMPLEC algorithm, and the convection scheme was the central difference scheme.
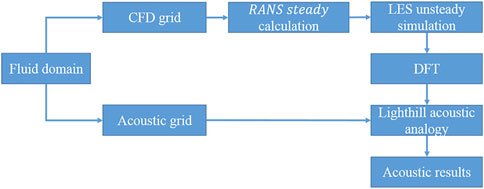
FIGURE 1. Flow chart of the flow-induced noise prediction.
A well-known benchmark submarine model named SUBOFF (no propeller) which was introduced by the Defense Advanced Research Projects Agency (DARPA) was selected in this study [27]. The geometric model is shown in Figure 2, the prototype length L = 104.544 m, maximum diameter D = 12.192 m, sail height H = 4.944 m, and the surface area S = 3656 m2.
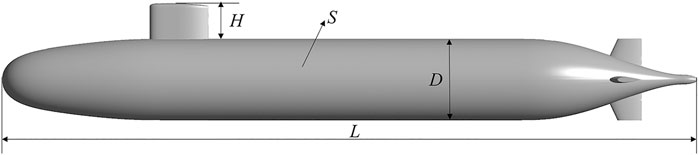
FIGURE 2. Geometric model of DARPA SUBOFF.
The computational domain of the flow field was established around the SUBOFF to calculate different scale model, as shown in Figure 3A. Numerical analysis was performed using the Cartesian coordinate system with the origin at the top of the SUBOFF head. The diameter of the cylinder in the fluid domain was 11D. The upstream of the domain was extended to 0.92 L from the apex of the SUBOFF head, and the downstream of the domain was extended to 3.58 L from the apex of the SUBOFF tail. The inlet boundary condition was identified as velocity inlet, and the outlet boundary condition was defined as pressure outlet. In order to satisfy the kinematic boundary condition, the cylindrical wall was defined as symmetry, and the submarine shell was defined as no-slip wall.
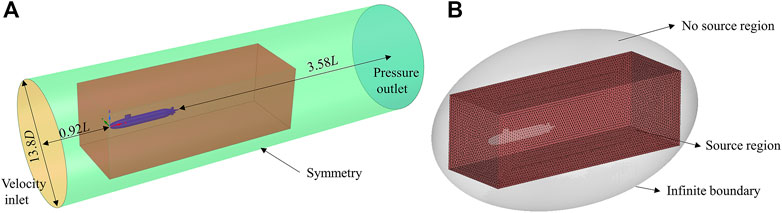
FIGURE 3. Computational domains and boundary conditions of (A) flow field and (B) acoustic field.
Acoustic calculation needs to establish an independent numerical model, as shown in Figure 3B. The acoustic field was divided into source region, no-source region, and infinite element boundary. The source region was the interpolation region of the stress tensor based on the Lighthill analogy equation. Its boundary usually needs to be far away from the sound source in consideration of the truncation error. In this study, selecting a rectangular domain with the size of
The fine element of the fluid domain is the precondition for accurate calculation results, and the element type is structured grid. Similarity analysis needs to generate different scale mesh models, but this paper only introduces the condition that the scale ratio of 1:24 and the speed U = 4 m/s. Under this condition, the fluid domain was divided into 247 blocks, as shown in Figure 4A. The grids detail can be seen in Figures 4B, C, most grids are concentrated on the SUBOFF surface and the wake of submarine. The boundary-layer grids were encrypted to capture the turbulence details on the surface, the number of prism layer was 15, the growth rate was 1.1, and the height of the first layer was
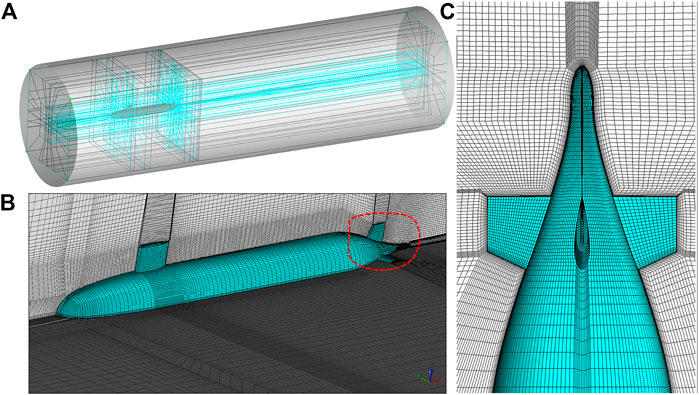
FIGURE 4. Grid model. (A) Computational domain blocks, (B) grid structure around the SUBOFF, and (C) boundary layer grids details.
The resistance coefficient based on the steady SST k-ω turbulence model and SWL based on the LES/Lighthill hybrid method are used as the verification of element convergence. The number of grid models is, respectively, 2.17 million, 5.15 million, 7.7 million, and 11.27 million. Figure 5A shows the relative results of the viscous resistance coefficient (Cν), pressure resistance coefficient (CP), and total resistance coefficient (CT) in different grid models. The formula of relative value is
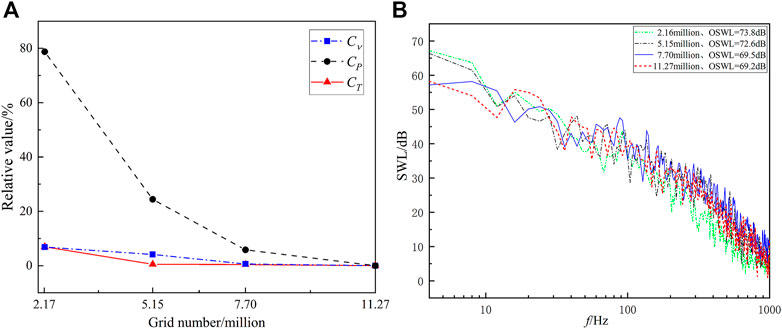
FIGURE 5. Grid convergence verification results. (A) Relative value of the resistance coefficient and (B) SPL spectrums.
Due to the lack of public experimental data of SUBOFF’s flow-induced noise, calculation results in this paper are compared with those from other references which also used the numerical methods. The conditions are scale ratio, 1:24; speed, 3.0506 m/s; and acoustic measuring point, (2.178, −2 m, 0). The comparison results of the OSPL obtained by the LES/Lighthill acoustic analogy method in this paper are shown in Table 1. Among them, Ref. [30] is a “water drop” submarine with a small difference from the size of SUBOFF, and acoustic results obtained at the similar measuring points. The calculation results show that OSPL calculated is within the same order of magnitude compared with other references, and the error with OSPL calculated in this paper is within 5.7 dB. This method can be used as the calculation method for the subsequent discussion of submarine similarity.
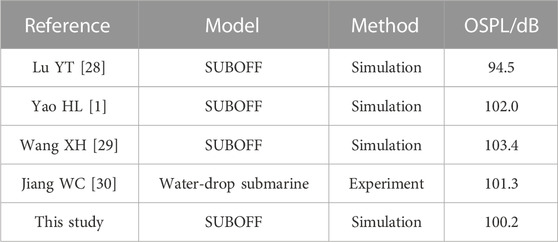
TABLE 1. Comparison between OSPL calculation results and relevant references.
The dimensional analysis method can transform the dimensional relationship into a dimensionless one. Using this method, the similarity conditions between model and prototype can be determined, and then the similarity law can be built to calculate similar models at arbitrary scales. The power spectral density of the flow-induced noise with frequency f and position
where
M, L, and T are selected as the basic dimension to obtain the dimensional expression of the remaining physical quantities, as shown in the following equation
Converting the dimensionless relationship into a series of similarity criterion numbers, the results are given as follows:
The dimensionless relationship of the sound power spectral density obtained from the Buckingham Pi theorem is as follows:
where
Converting Eq. 4 into sound power spectral in the bandwidth
From Eq. 5, it can be analyzed that the full similarity condition is that all similarity criteria numbers are equal. However, it is almost impossible to satisfy in practice. It is necessary to analyze the similarity conditions and ignore the similarity criterion numbers which have less impact on flow-induced noise. According to the physical meaning of each similarity criterion number, a series of assumptions are made to simplify Eq. 5, as shown in the following section. Assumption (c) and (d) will be further discussed in the next chapter.
(1) Flow-induced noise of the SUBOFF has a non-cavitating phenomenon at low Mach number, and the influence of Euler number can be ignored.
(2) SUBOFF sailing in deep water is far away from the free surface without wave resistance, and the influence of Froude number can be ignored.
(3) There exists a critical Reynolds number, and the influence of Reynolds number for can be ignored when the Reynolds number is greater than the critical Reynolds number.
(4) For the flow-induced noise generated when the fluid flows through the rotating body, and the Strouhal number is related to the Reynolds number under the condition of a high Reynolds number.
(5) Flow-induced noise of the SUBOFF in the low-frequency range is mainly generated by vortex shedding, and the influence of Helmholtz number can be ignored.
Moreover, sound pressure in the free field is inversely proportional to the distance. The simplified similarity relationship is as follows, which ensures the Strouhal number and the Mach number of the model and prototype are equal.
where
Curle [31] equated the sound source of flow-induced noise with monopole source, dipole source, and quadrupole source. This study assumes that the SUBOFF is a rigid body, so the monopole source noise can be ignored. In addition, the Mach number of all the models to be discussed is within a low Mach number range, so the radiated noise of quadrupole source can be ignored. In the scope of this research, it is considered that the sound source of the SUBOFF’s flow-induced noise is the dipole type.
Under far-field conditions (
where
Equation 8 shows that the sound intensity of flow-induced noise is proportional to the sixth power of inflow velocity, and the radiated sound intensity has the directivity of
where
Under the same medium condition, the calculational parameters are designed as shown in Table 2 to verify the similarity of the speed and scale. There are six groups of calculational conditions, including the scale ratio of 1:24 and 1:48 and the speed of 2, 4, and 8 m/s, respectively. To facilitate the analysis, the calculated models are numbered from 1–6. Fluid material of all calculated models are water, where
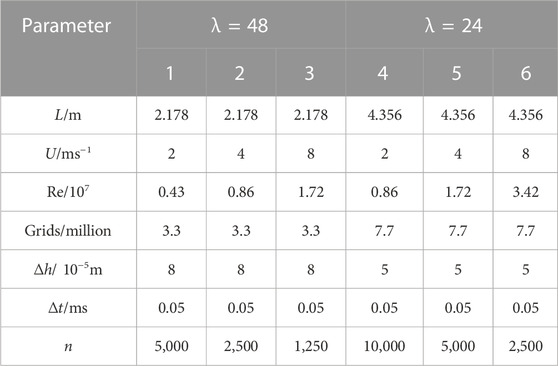
TABLE 2. Calculational parameters of the SUBOFF.
Similarity conditions of the submarine’s flow-induced noise are simplified in Section 3.2, and part of them are discussed in this section. The assumption (a) and (b) in Section 3.2 are satisfied within the scope of this study and do not need verification; the assumption (e) can be reflected in the normalized spectrum of the subsequent section, where it only discusses the assumption (c) and (d). Evidently, the common premise of the two assumptions is whether the similarity conditions are met when the Reynolds number is greater than the critical Reynolds number.
The Reynolds number represents the ratio of inertial force to viscous force; the higher it is, the less influence of viscous force is. Therefore, this section first judges the Reynolds similarity from the viscosity force of models under different cases, Section 4.3 will further explain that Reynolds number meets similar conditions from the acoustic spectrum results. The resistance coefficients of each model in Table 2 were calculated based on the SST
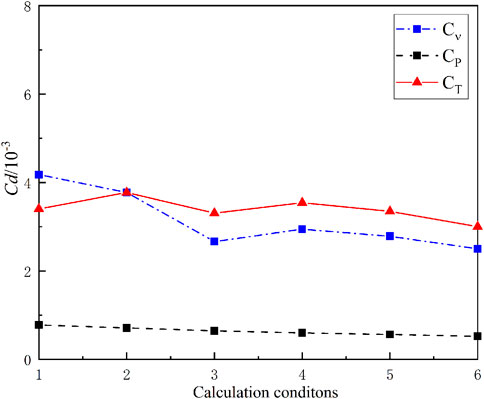
FIGURE 6. Coefficient drag of the SUBOFF models under different conditions.
Ahlborn et al. [32] obtained the relationship between the Strouhal number and the drag coefficient of the cylinder with a high Reynolds number; the equation is given as follows:
where
Under different conditions, Figure 7 shows SPL of the SUBOFF surface at the dimensionless frequency of St = 43.56. It can be found that flow-induced noise of the SUBOFF is mainly caused by shedding vortex of the enclosure and the tail rudder. Combining the conclusion of Figure 6, it can be found that the Strouhal number in this study is basically equal. In the process of similarity prediction, frequency can be converted by the Strouhal number.
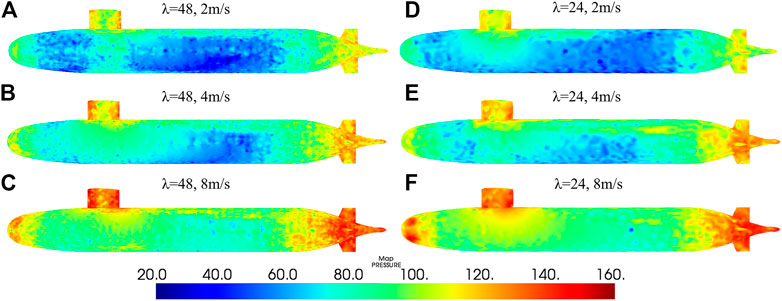
FIGURE 7. SPL of SUBOFF surface with St = 43.56. (A–C) is the scale ratio of 1:48 and the speed of 2, 4, and 8 m/s, respectively. (D–F) is the scale ratio of 1:24 and the speed of 2, 4, and 8 m/s respectively.
In this section, the dimensionless SPL of far-field measuring points under different cases were calculated to verify the similarity relationship of submarine’s flow-induced noise obtained in Chapter 3. Acoustic radiation in the horizontal direction is more important when the submarine is sailing underwater. The schematic diagram of the measuring point position in the Z = 0 plane is shown in Figure 8. Taking the coordinate (0.5 L, 0, 0) as the center of the circle, the radius r = 11.48 L, and the positive direction of the X axis is regarded as the starting angle. SPL results of different measuring points in Figure 8 were calculated based on the numerical method introduced in Chapter 2, where the computing formula of SPL at dimensionless frequency is given as follows:
where
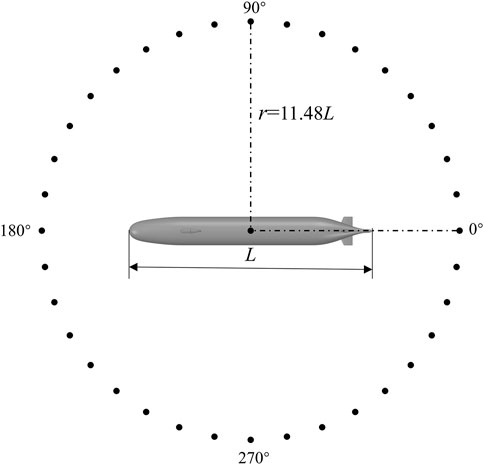
FIGURE 8. Schematic diagram of measuring point location.
Before the verification of the SPL similarity law, this paper made acoustic directivity of Z = 0 plane at three different dimensionless frequencies so as to analyze the radiation type of sound source in the frequency band St = 10–1089 and provide guidance for the subsequent verification of the similarity law. The SPL directivity results of St = 43.56, 156.8, and 696.9 are established in Figure 9, and the following analysis can be obtained. First, at the lower frequency St = 43.56, it has notable radiation characteristics of dipole “
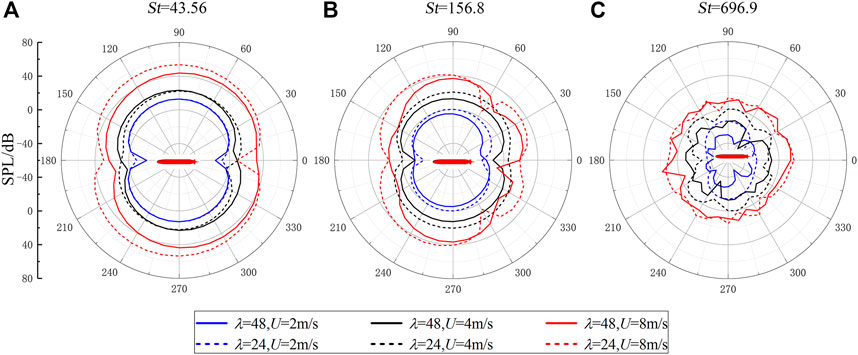
FIGURE 9. Acoustic directivity of Z = 0 plane at (A) St = 43.56, (B) St = 156.8, and (C) St = 696.9 in the range of St = 10–1089.
Then, the spectrum results of a single measuring point at different speeds were analyzed. Assuming that there is a reference model whose condition Lref = 4.356 m and speed Uref = 4 m/s. Combined with Eqs 8, 10, under the same medium and dimensionless frequency, the normalized formula of SPL at similar measuring points can be written as follows:
where
SPL spectrums of 0° and 90° measuring points in the Z = 0 plane are shown in Figure 10, which includes the direct calculation results and its normalization results of SPL at dimensionless frequency. From the calculation results, as shown in Figures 10A, C, SPL spectrum curves with the same speed but different scales coincide well, and all of them have the same trend but merely different values, this indicates that the spectrum has the same conclusion as the directivity. Figures 10B, D are the normalized spectrum result, according to Eq. 11. At the 0° measuring point, OSPL of cases 1–6 are, respectively, 34.6, 32.8, 35.3, 34.2, 31.9, and 31.7 dB, and the error value with the reference model (case 5) is within 3.4 dB. At the 90° measuring point, OSPL of cases 1–6 are, respectively, 60.2, 50.6, 54.6, 54.2, 52.3, and 53.7 dB, and the error value with the reference model is within 7.9 dB. The results show that SPL of the SUBOFF’s flow-induced noise conforms to the similarity law under the dipole source. However, we concurrently note that the error of the normalized results is different at different directions and frequencies, this paper will analyze the scale error of the SUBOFF model in Chapter 4.
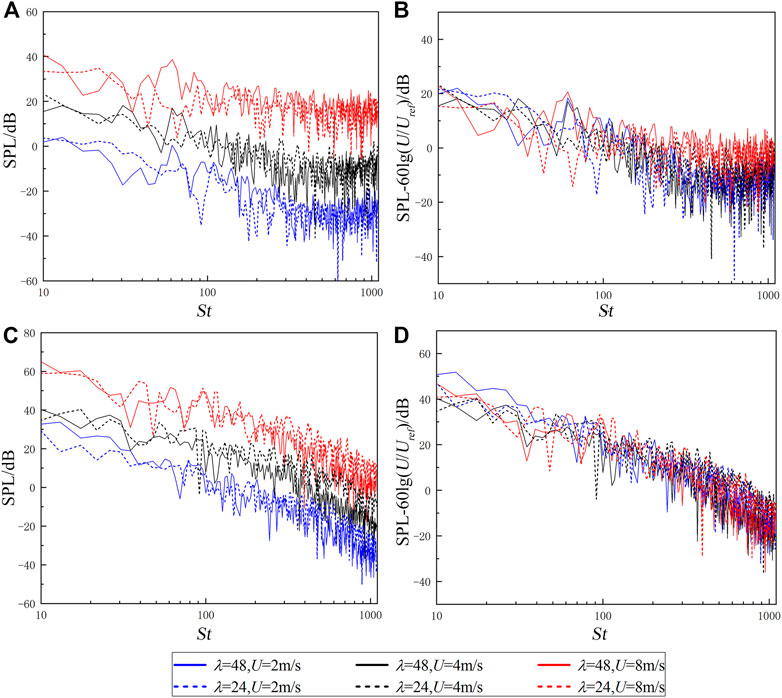
FIGURE 10. SPL spectrums of Z = 0 plane under different conditions. (A,B) Calculated results and normalized results of the 0° measuring point. (C,D) Calculated results and normalized results of the 90° measuring point.
Section 4.3 only reflects that the sound power in a certain direction meets the established SPL similarity law; this section further verifies the SUBOFF’s SWL similarity law to reflect the total radiation characteristics in different frequency. As shown in Figure 11, the layout of SWL measuring points is ISO3744, the central coordinate is (0.5 L, 0, 0), and the radius R = 2.75 L. The formula of SWL at dimensionless frequency is shown as follows:
where P shows the mean sound power;
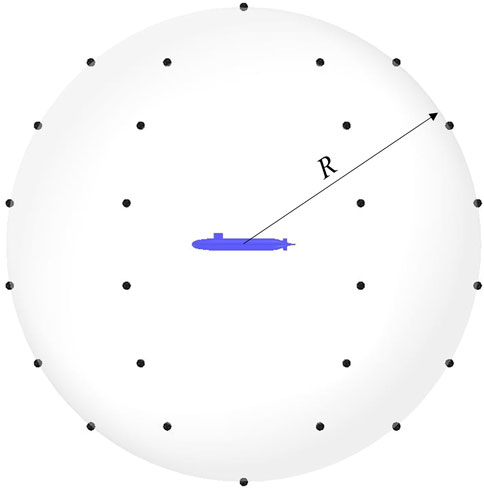
FIGURE 11. Measuring point location of radiated sound power under ISO3744.
Combined with Eqs 8, 12, under the same medium and dimensionless frequency, the normalized formula of SWL at similar measuring points can be written as follows:
where
The simulation results and normalization results of SWL are, respectively, shown in Figures 12A, B. The latter shows that SWL spectrum curves under different cases are in good agreement, meeting the SWL similarity law under dipole source. In addition, SWL spectrum curves at the same scale but different speeds are relatively consistent, while at different scales are slightly worse especially St
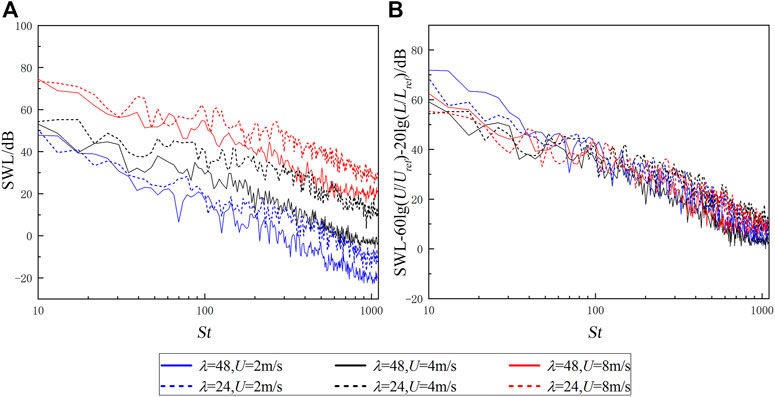
FIGURE 12. Radiated SWL of (A) calculated results and (B) normalized results under different conditions.
The similarity analysis in Chapter 4 verifies that the SUBOFF satisfies the similarity law of dipole source in the low-frequency range, that is, the SPL similarity law of Eq. 11 and the SWL similarity law of Eq. 13. This chapter analyzes the scale effect generated by the prediction of the SUBOFF prototype based on the similarity law. All models and prototype have the same speed, which can ensure that the Strouhal number and the Helmholtz number meet similar conditions at the same time. Converting Eqs 11, 13 into the following formulas
where SPLD and SWLD, respectively, represent the sound pressure level and the sound power level extrapolated from model to prototype according to the similarity law of dipole source;
Due to the lack of experimental data, a SUBOFF model with the scale radio of 1:8 is taken as a hypothetical prototype, and its calculation results are regarded as the actual results of the prototype.
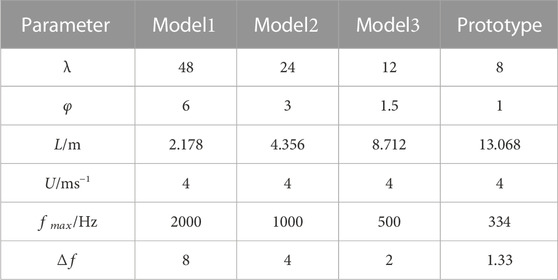
TABLE 3. Calculation parameters of different scales.
The scale effect is discussed under the SPL similarity law of 0° and 90° measuring points in the Z = 0 plane and the SWL similarity law of ISO3744 measuring points. In order to reduce the numerical error of a single frequency, the simulation results are converted to 1/3 octave results, as show in Figures 13A–C. Then, calculating the error value in each frequency band, respectively, the error results are shown in Figures 13D–F. The error curves of the 0° measuring points between models and hypothetical prototype are in good agreement, which indicates that the extrapolated results parallel to the inflow direction are less affected by the scale effect within St = 10–1089. At the 90° measuring point, the scale effect increases with the increase of scale radio
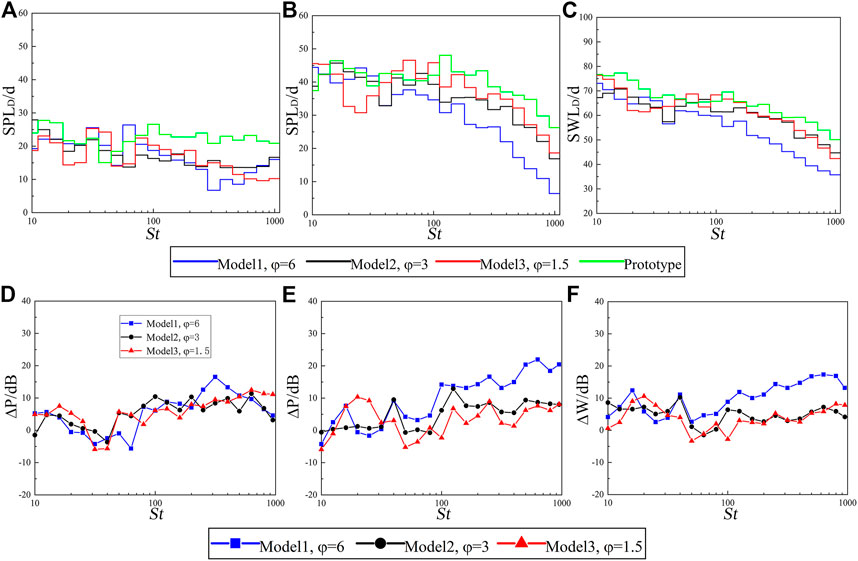
FIGURE 13. Extrapolated results and error value between scale models and hypothetical prototype. (A,D) SPL of the 0° mearing point. (B,E) SPL of the 90° mearing point. (C,F) SWL of the ISO3744 mearing point.
From the results of St > 100 in 1/3 octave, it can be clearly seen that SPL of the 90° mearing point and SWL of ISO3744 mearing points have similar trend. Comparing the data in the dimensionless frequency range, the error value is about
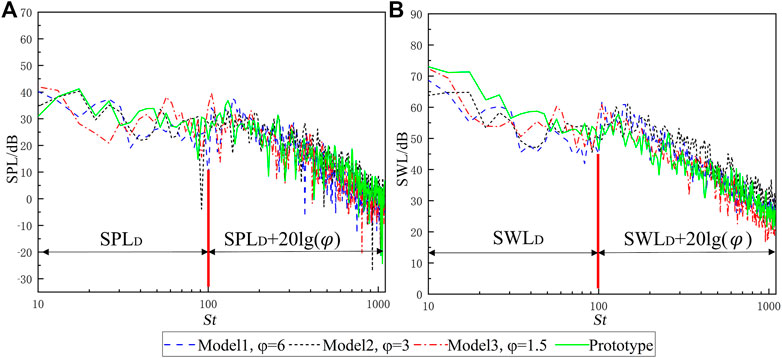
FIGURE 14. Comparison between extrapolated results which added the modified value and hypothetical prototype. (A) SPL of the 90° mearing point. (B) SWL of the ISO3744 mearing point.
In the Z = 0 plane, the SPL spectrum of all measuring points is analyzed similar to that in Figure 13 to obtain the dimensionless cut-off frequencies in different directions, as shown in Figure 15. On both sides of the SUBOFF, the dimensionless cut-off frequencies are about St = 100. In the head and tail directions, due to the SPL spectrum having better coincidence within St = 10–1089, the cut-off frequencies near these directions are greater than the highest dimensionless frequency within the scope of this study. This shows that in the similarity prediction based on the dipole source, the SPL spectrum in different directions has different dimensionless cut-off frequencies. The cut-off frequencies in the figure are obtained by observing the normalized spectrum, and there is no specific calculation method and accurate value, which is only for readers’ reference. The evaluation method and accurate value of cut-off frequency need further study.
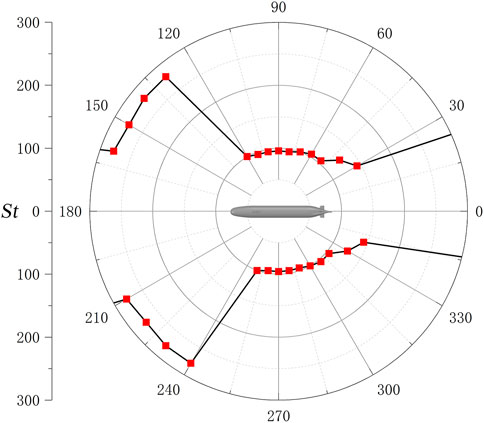
FIGURE 15. Cut-off frequencies of the Z = 0 plane in different directions.
In this study, the LES/Lighthill hybrid method was used to verify the similarity conditions and similarity laws of the SUBOFF’s flow-induced noise within the test speed range, and the scale effect under the similarity law was analyzed. The frequency range of analysis is St = 10–1089, and the maximum scale ratio is 1:6; certain conclusions are described as follows:
(1) With the dimensionless frequency in the range of St = 10–1089, SPL directivity in the Z = 0 plane conform to the dipole characteristics, and the major radiation direction is perpendicular to the inflow direction.
(2) When the Reynolds number is greater than the critical Reynolds number, the submarine’s flow-induced noise meets the similarity condition, and the frequencies are normalized according to the Strouhal number. At the same dimensionless measuring point distance, SPL is proportional to the sixth power of the speed, and SWL is proportional to the sixth power of the speed and second power of the scale.
(3) The established similarity law is affected by the scale. At the same scale, the predicted SPL and SWL spectral curves with different inflow speeds are generally in good agreement. Under different scales but the same speed, there exists a dimensionless cut-off frequency St = 100, below which the SWL spectrums predicted are in good agreement; otherwise, the scale error is about 20 lg (
(4) The cut-off frequency of SPL similarity law is related to the angle of the measuring points, which, perpendicular to the incoming flow direction, is St = 100 (the same as the cut-off frequency of the SWL similarity law), but the cut-off frequency parallel to the incoming direction is greater than St = 100.
The original contributions presented in the study are included in the article/Supplementary Material; further inquiries can be directed to the corresponding author.
YQ: writing (original draft), methodology, theoretical model analysis, and data. Y-OZ and TZ: idea, conceptualization, writing and reviewing of the manuscript, structural scheme design, theoretical model analysis, supervision, and funding. Y-FL: investigation and review of the manuscript. All authors contributed to the article and approved the submitted version.
This study is supported by the Innovative Research Foundation of Ship General Performance of China (No. 33122233) and the Open Fund of Science and Technology on Thermal Energy and Power Laboratory (No. TPL2021B03).
The authors declare that the research was conducted in the absence of any commercial or financial relationships that could be construed as a potential conflict of interest.
All claims expressed in this article are solely those of the authors and do not necessarily represent those of their affiliated organizations, or those of the publisher, the editors, and the reviewers. Any product that may be evaluated in this article, or claim that may be made by its manufacturer, is not guaranteed or endorsed by the publisher.
1. Yao H, Zhang H, Liu H, Jiang W. Numerical study of flow-excited noise of a submarine with full appendages considering fluid structure interaction using the boundary element method. Eng Anal Bound Elem (2017) 77:1–9. doi:10.1016/j.enganabound.2016.12.012
2. Liu Z. X., Song Y., Yang Q. X., Liu Y., et al. Research on foreign free manoeuvring submarine models experiment. Ship Sci Tech (2017) 39(17):194–9. (In Chinese). doi:10.3404/j.issn.1672-7649.2017.09.039
3. Jiang PF, Lin JH, Sun JP, Yi X, Shan Y. Source spectrum model for merchant ship radiated noise in the Yellow Sea of China. Ocean Eng (2020) 216:107607. doi:10.1016/j.oceaneng.2020.107607
4. Merino Martinez R, Neri E, Snellen M, Kennedy J, Simons D, Bennett GJ. Comparing flyover noise measurements to full-scale nose landing gear wind tunnel experiments for regional aircraft. AIAA J (2017) 2017–3006. doi:10.2514/6.2017-3006
5. Breeding J. E., Pflug L. A., Bradley M., Walrod M. H. (1996) Research ambient noise DIrectionality (RANDI) 3.1 Physics description. Naval Research Lab Stennis Space Center MS. Available at: https://apps.dtic.mil/sti/pdfs/ADA316034.pdf.
6. Bark G. Prediction of propeller cavitation noise from model tests and its comparison with full scale data. J Fluids Eng (1985) 107(1):112–9. doi:10.1115/1.3242424
7. Lee S. B., Kim K. Y., Kim J. Y., Yang G. C. A study on the effects of non-uniform inlet flows upon performance and tonal radiation from a propeller fan. In: Proceedings of ASME Fluid Engineering Division Summer Meeting (1998). p. 3245–3253. Available at: https://www.researchgate.net/publication/283010594_A_Study_on_the_Effects_of_Non_Uniform_Inlet_Flows_upon_Performance_and_Tonal_Radiation_from_A_Propeller_Fan.
8. Tani G, Viviani M, Hallander J, Johansson T, Rizzuto E. Propeller underwater radiated noise: A comparison between model scale measurements in two different facilities and full scale measurements. Appl Ocean Res (2016) 56:48–66. doi:10.1016/j.apor.2016.01.007
9. Park J, Seong W. Novel scaling law for estimating propeller tip vortex cavitation noise from model experiment. J Hydrodyn (2017) 29:962–71. doi:10.1016/S1001-6058(16)60810-7
10. Arakeri VH, Satyanarayana SG, Mani K, Sharma S. Studies on scaling of flow noise received at the stagnation point of an axisymmetric body. J Sound Vibr (1991) 146(3):449–62. doi:10.1016/0022-460X(91)90701-K
11. Xing Y., Liu P. Q., Guo H., Xu L., Li L. Similarity rule and Mach number scaling law for simplified landing gear noise. Hangkong Xuebao (2017) 38(06):72–9. (In Chinese) doi:10.7527/S1000-6893.2016.0290
12. Kaltenbacher M, Escobar M, Becker S, Ali I. Numerical simulation of flow-induced noise using LES/SAS and Lighthill's acoustic analogy. Int J Numer Methods Fluids (2010) 63(9):1103–22. doi:10.1002/fld.2123
13. Han T, Wang L, Cen K, Song B, Shen R, Liu H, et al. Flow-induced noise analysis for natural gas manifolds using LES and FW-H hybrid method. Appl Acoust (2020) 159:107101. doi:10.1016/j.apacoust.2019.107101
14. Yang QF, Wang YS, Zhang MM. Scale effects on non-cavitation hydrodynamics and noise of highly-skewed propeller in wake flow. J Southeast Univ (2013) 29(2):162–9. doi:10.3969/j.issn.1003-7985.2013.02.010
15. Bosschers J. A semi-empirical prediction method for broadband hull-pressure fluctuations and underwater radiated noise by propeller tip vortex cavitation. J Mar Sci Eng (2018) 6(2):49. doi:10.3390/jmse6020049
16. Li D. Y., Fang B., Li Y. M., Guan H. R., et al. Study on the similarity of characteristic frequency of flow around cylinder. Ship Electron Eng (2022) 42(03):197–202. (In Chinese) doi:10.3969/j.issn.1672-9730.2022.03.043
17. Bhushan S, Alam MF, Walters DK. Evaluation of hybrid RANS/LES models for prediction of flow around surface combatant and Suboff geometries. Comput Fluids (2013) 88:834–49. doi:10.1016/j.compfluid.2013.07.020
18. Paredes RJ, Quintuña MT, Arias-Hidalgo M, Datla R. Numerical flow characteriza-tion around a type 209 submarine using OpenFOAM. Fluids (2021) 6(2):66. doi:10.3390/fluids6020066
19. Wang XH, Huang Q, Pan G. Numerical research on the influence of sail leading edge shapes on the hydrodynamic noise of a submarine. Appl Ocean Res (2021) 117:102935. doi:10.1016/j.apor.2021.102935
20. Jie P, Chen N, Qu JC, Liu Y, Shang D. The suppression of hydrodynamic noise from underwater sonar domes by flow control. MATEC Web Conf (2019) 283:08008. doi:10.1051/matecconf/201928308008
21. Sezen S, Delen C, Dogrul A, Atlar M. An investigation of scale effects on the self-propulsion characteristics of a submarine. Appl Ocean Res (2021) 113:102728. doi:10.1016/j.apor.2021.102728
22. Howard CQ. Recent developments in submarine vibration isolation and noise control. In: Proceedings of the 1st Submarine Science Technology and Engineering Conference (2011). p. 1–7.
23. Liu ZH, Xiong Y, Tu CX. Method to control unsteady force of submarine propeller based on the control of horseshoe vortex. J Ship Res (2012) 56(01):12–22. doi:10.5957/jsr.2012.56.1.12
24. Zhang YO, Zhang T, Li TY. Flow-induced noise simulation based on LES/Lighthill hybrid method. ICMECS (2014) 614:428–31. doi:10.4028/www.scientific.net/amm.614.428
25. Zhang YO, Zhang T, Ouyang H, Li T. Flow-induced noise analysis for 3D trash rack based on LES/Lighthill hybrid method. Appl Acoust (2014) 79:141–52. doi:10.1016/j.apacoust.2013.12.016
26. Oberai AA, Roknaldin F, Hughes TJR. Computational procedures for determining structural-acoustic response due to hydrodynamic sources. Comput Meth Appl Mech Eng (2000) 190(3-4):345–61. doi:10.1016/S0045-7825(00)00206-1
27. Liu HL, Huang T. Summary of DARPA SUBOFF experimental program data. Report No CRDKNSWC/HD-1298-11 (1998). doi:10.21236/ada359226
28. Lu YT, Zhang HX, Pan XJ. Numerical simulation of flow-field and flow-noise of a fully appended submarine. J Vibration Shock (2008) 09:142–6+189. doi:10.13465/j.cnki.jvs.2008.09.009
29. Wang XH, Hang QG, Pan G. Numerical research on influence of fairwater shape on flow-induced noise of submarine. SHIPBUILDING OF CHINA (2020) 61(S2):262–72. doi:10.3969/j.issn.1000-4882.2020.z2.029
30. Jiang WC, Zhang HX, Meng KY. Research on the flow noise of underwater submarine based on boundary element method. Chin J Hydrodynamics (2013) 28(04):453–9. doi:10.3969/j.issn1000-4874.2013.04.011
31. Curle N. The influence of solid boundaries upon aerodynamic sound. Proc R Soc Lond Ser A (1955) 231(1187):505–14. doi:10.1098/rspa.1955.0191
Keywords: flow-induced noise, SUBOFF, dipole source, hybrid method, similarity law, scale effect
Citation: Qu Y, Zhang Y-O, Li Y-F and Zhang T (2023) Similarity analysis of the flow-induced noise of a benchmark submarine. Front. Phys. 11:1163148. doi: 10.3389/fphy.2023.1163148
Received: 10 February 2023; Accepted: 23 March 2023;
Published: 07 April 2023.
Edited by:
Zhixiong Gong, Shanghai Jiao Tong University, ChinaReviewed by:
Youjiang Wang, Shanghai Jiao Tong University, ChinaCopyright © 2023 Qu, Zhang, Li and Zhang. This is an open-access article distributed under the terms of the Creative Commons Attribution License (CC BY). The use, distribution or reproduction in other forums is permitted, provided the original author(s) and the copyright owner(s) are credited and that the original publication in this journal is cited, in accordance with accepted academic practice. No use, distribution or reproduction is permitted which does not comply with these terms.
*Correspondence: Yong-Ou Zhang, emhhbmd5b0B3aHV0LmVkdS5jbg==
Disclaimer: All claims expressed in this article are solely those of the authors and do not necessarily represent those of their affiliated organizations, or those of the publisher, the editors and the reviewers. Any product that may be evaluated in this article or claim that may be made by its manufacturer is not guaranteed or endorsed by the publisher.
Research integrity at Frontiers
Learn more about the work of our research integrity team to safeguard the quality of each article we publish.