 Meng Yang
 Shanfeng Lu3
 Hao Ding
94% of researchers rate our articles as excellent or good
Learn more about the work of our research integrity team to safeguard the quality of each article we publish.
Find out more
ORIGINAL RESEARCH article
Front. Phys., 08 March 2023
Sec. Radiation Detectors and Imaging
Volume 11 - 2023 | https://doi.org/10.3389/fphy.2023.1159531
This article is part of the Research TopicMulti-Sensor Imaging and Fusion: Methods, Evaluations, and ApplicationsView all 18 articles
The quality of lighting installation performance has a direct impact on the traffic safety of immersed tunnels. To effectively investigate and judge the traffic safety of immersed tunnels having different lighting installations, a traffic safety assessment method for immersed tunnels based on lighting performance degradation was put forward in this study by using big data technology. Numerical simulation was used to simulate the lighting environment in an immersed tunnel under different conditions of lighting performance degradation, conduct the small target recognition test in a physical tunnel, and calculate the traffic safety factor; then, a real-time kinematic assessment model of traffic safety in immersed tunnels was built in combination with the key index factors influencing lighting installations in immersed tunnels. The test results showed that the performance degradation of lighting installations positively correlated with the visual cognition of drivers and passengers. long short-term memory neural network model can effectively assess the traffic safety of immersed tunnels, and the root mean square error (RMSE) and coefficient of determination of the model were separately 1.029 and 0.95, which were superior to the RMSE and coefficient of determination of random forest and recurrent neural network model, and the running time was often less than 1min, complying with the rea; -time assessment requirements; the boundary value of the traffic safety factor of immersed tunnels was 0.6304, and if a value was less than the boundary value, it indicated that the performance of lighting installations was not good and might pose a threat to traffic safety. The research results provided a new perspective for the status assessment of lighting installations in immersed tunnels and also offered a theoretical basis for fine maintenance and repairs of lighting installations.
In China, immersed tunnels provide convenience for the production and life of travelers in crossing rivers and deep sea, and the operating safety of immersed tunnels is always the focus of people [1, 2]. In an immersed tunnel, nearly 80% of traffic information is obtained through vision. To provide a lighting environment for immersed tunnels, lighting installations shall uninterruptedly operate 24 h a day, so the quality of their performance has a direct impact on the traffic safety of immersed tunnels [3, 4]. The lighting installation performance is correlated with its components and parts as well as the operating environment. The ventilation and heat dissipation in an underwater immersed tunnel are limited and the humidity and salinity in it are relatively high [5, 6], causing more serious damage to the electrical parts in a lighting installation.
And meanwhile, pollutants produced by traffic in the tunnel adhere to the surface of lighting installations [7–9], which will also result in the performance degradation of lighting installations and even cause a failure of lighting installations.
The maintenance and repair of immersed tunnels can retard the performance degradation of lighting installations, but the existing research into the maintenance and repairs of tunnel lighting installations and the relevant specifications continue to follow the standard for highway tunnel assessment; the availability of equipment is used as the unique indicator of status assessment to develop the plan of maintenance and repairs [10], and there is a lack of theoretical research into different maintenance contents of lighting installations under different performance conditions. In the immersed tunnel lighting design, the maintenance factor will be determined, but it is easy to cause redundancy in preliminary lighting and inadequacy of later lighting and different immersed tunnels and different types of lighting installations vary greatly [11–13], and the method of established indicators and empirical discrimination cannot accurately determine the performance status of lighting installations and it is difficult to effectively carry out fine maintenance and repairs, bringing a hidden danger to traffic safety of immersed tunnels.
The research into the facility performance degradation is mainly applied to the key fields of science and technology, such as aerospace, nuclear power and large internal combustion engine in the early years [14–16], and as the information technology develops and the data acquisition and mining technology becomes mature, the facility performance degradation has been gradually applied to other fields, including wind power [17, 18], mines, E&M and mechanical engineering [19–22]. XU Zhen et al. utilized the Internet of Things (IoT) technology to collect tunnel E&M equipment information, build an operating state judgment model of tunnel E&M equipment, a monitoring state assessment model of tunnel E&M equipment and a medium-term prediction model for the use of key tunnel equipment, and comprehensively analyze the technical status of tunnel E&M equipment [23]; Zhang et al. and JIN Yinli et al. analyzed and established the weights of influencing factors in different layers according to the structural characteristics and maintenance quality status of the highway E&M system equipment, and used the analytic hierarchy process (AHP) and the fuzzy mathematics theory to comprehensively evaluate the operation of E&M system facilities [24, 25]. Cui et al. analyzed the law of variations in the performance of E&M equipment with the operating life, deduced the hierarchy standard system, calculated the importance of various standards with the Delphi method, and built a fuzzy synthetic evaluation model (FSEM) [26]; ZHU Liwei put forward 4 types of real-time recognition models based on the data transfer path of the highway tunnel E&M system equipment and the topology of corresponding functions for the operating status of functions of the highway tunnel E&M system [27]; ZHANG Jianping et al. put forward a data model for optoelectronic facility luminance attenuation based on Weibull distribution and simulated the law of facility performance degradation with the parameter fitting method [28]. However, the existing monitoring data have not been effectively used, resulting in a waste of monitoring data. At the same time, there is relatively little research on the impact of electromechanical facilities or lighting facilities failure on tunnel traffic safety, and the impact of lighting facilities performance degradation on traffic safety is even blank. Therefore, how to tap the impact of performance degradation of lighting installations on traffic safety of immersed tunnels without influencing normal traffic operation according to the existing monitoring data is the key to the current traffic safety assessment of immersed tunnels.
In this study, the research into the law of variations in the performance degradation of lighting installations and the lighting environment of immersed tunnels was conducted according to numerical simulation and field test data, and based on the results of small target recognition, the traffic safety factor of immersed tunnels was established; based on the key indicators influencing the performance degradation of lighting installations, the LSTM neural network was utilized to build a traffic safety assessment model of immersed tunnels to realize the real-time kinematic assessment of traffic safety of immersed tunnels. The research results can be directly applied to the fine operation and maintenance of the lighting facilities in immersed tunnel, which can fully perceive the advantages and disadvantages of lighting facilities in real time, accurately determine the driving safety under the action of lighting facilities, and ensure the safe operation of the tunnel.
The performance degradation of lighting installations in an immersed tunnel will change the lighting environment in the immersed tunnel, which will affect the visual discrimination of drivers and passengers. At present, the performance evaluation of lighting installations in immersed tunnels is mainly carried out through regular spot check of pavement luminance from local areas, but due to the influence of harsh environment and exhaust gas pollution, the performance of lighting installations is subject to continuous and kinematic degradation, and the traditional evaluation methods are difficult to effectively judge tunnel pavement luminance and traffic safety. Consequently, the methods of numerical simulation and simulation test are used to simulate the traffic safety of immersed tunnels at different degrees of performance degradation, establish the traffic safety factor of immersed tunnels and realize the traffic safety assessment of immersed tunnels in this paper.
The model uses DIALux4.13, which is the software for professional lighting design, to calculate and analyze the luminous effect of tunnel pavement under the performance degradation of lighting installations in immersed tunnels; the cross section dimensions of the model are the same as the actual tunnel dimensions, and the tunnel clearance is 7.25 m and the width is 12.75 m, the lane width is 3.75 m, and a 0.75 m overhaul access is reserved on each of left and right sides. For the actual engineering pavement, the porous asphalt pavement is designed; the pavement reflection characteristic is set to be R3 (which is predominantly diffuse reflection, with some mirror reflection), the pavement reflectivity is 0.22, the glossiness is
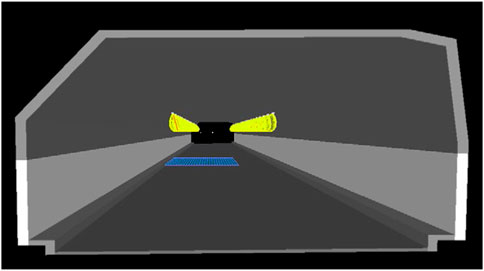
FIGURE 1. Schematic diagram of tunnel simulation.
The 60W LED lamps are used for lighting simulation, with the interval of lamps of 4.5 m, The initial luminous flux of LED lamps is 7,200 lm, the correction factor is 0.98, the mounting height of lamps is 5.5 m, the normal angle of the luminous surface of lamps is the same as that of the vertical surface, and the consistent dip angle of lamps is kept.
For the grid in the lighting installation testing area, the computational grid of pavement illuminance and luminance with a longitudinal length of 27 m and a transverse length of 7.5 m is laid, and the grid computation size is 30 × 20. There are 20 transverse calculating points and 30 longitudinal calculating points in the grid.
In DIALux software, the luminous flux of luminaires is set to simulate the results of performance degradation of lighting installations. To verify the accuracy of calculated results of the simulation model, the grid method was adopted to test the lighting environment of the pavement of a physical immersed tunnel in this paper, and the longitudinal length of the testing area was 10m, the transverse length was 7.5 m, and the measuring space was 1 m. The pavement illuminance and uniformity were tested at 100% of luminous flux and the results were compared with the numerical simulation, as shown in Table 1.

TABLE 1. Comparison between measured illuminance results and simulated illuminance results.
It can be seen from the table that the relative error between the measured results of the pavement luminance in the middle section of the immersed tunnel and the average illuminance of simulation results in DIALux software is 0.08%, the relative error of uniformity of luminance is 1.93%, and the relative error of longitudinal uniformity was 2.13%, indicating that there is a small difference between the measured pavement illuminance of immersed tunnels and the results of numerical simulation, and the simulation results are more accurate.
In the simulation model, the results of tunnel pavement luminance at different luminous fluxes (i.e. 100% (without performance degradation), 90%, 80% and 70%) were separately simulated. According to the requirements of LED lighting, the lighting installations will fail if the luminous flux is less than 70% [29], so such simulation is not conducted. The immersed tunnel luminance is divided by colors, and the results of luminance simulation of lighting installations in an immersed tunnel are shown in Figure 2.

FIGURE 2. Results of luminance simulation of lighting installations in an immersed tunnel.
It can be seen from Figure 2 that the illuminance of tunnel pavement and overhaul access is significantly decreased with a reduction in the luminous flux of lighting installations in the immersed tunnel, and an insignificant change occurs in the illuminance of tunnel top and side walls, with the relative error of less than 5%, and the performance degradation of lighting installations in the immersed tunnel has a great impact on the tunnel pavement illuminance.
The nature of traffic safety is that drivers can drive correctly according to the tunnel obstacles in front of them [30, 31]. In this paper, the small target recognition test was carried out for lighting installations under different performance degradation conditions to analyze the recognition of small targets by different drivers, which was the basis for traffic safety evaluation. The length of the LED lighting fixture installed in the test tunnel is 100m, and its light distribution curve, layout height, spacing and position are the same as those in the simulation. As recommended by the International Commission on Illumination, a small cube with the size of 0.2 m × 0.2 m × 0.2 m and the surface coefficient of 0.2 was used as the small target [32]. The testing personnel recognized small targets under the following conditions: different distances and various tunnel pavement luminance environments. The visual height of the test personnel is 1.2 m. The components of recognition are shown in Table 2.
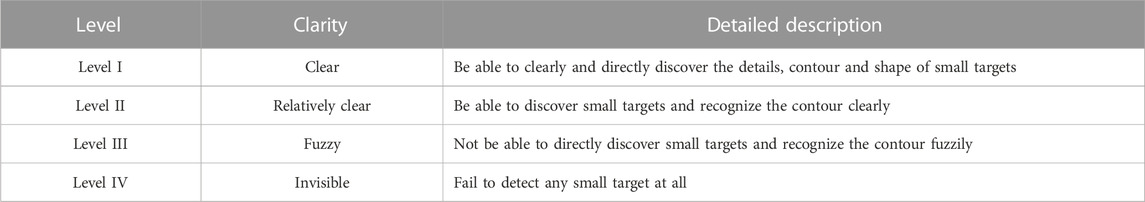
TABLE 2. Component of visual cognition.
In consideration of the speed limits in the immersed tunnel, the stopping sight distance at different speed limits, including 100 km/h, 80 km/h and 60 km/h was used as the optimal obstacle avoidance distance, and testing personnel made observations at 158m, 100 m and 56m; the stepless dimming method was used to adjust the pavement luminance in a tunnel and simulate the performance degradation of lighting installations in an immersed tunnel. A total of 29 testing personnel aged between 22–25 were involved, with the visual acuity of above 1.0 and without other vision problems, and the visual height was 1.2 m. After the completion of small target recognition by testing personnel, the small target visibility was identified according to the table of recognition components; the results are shown in Figure 3.
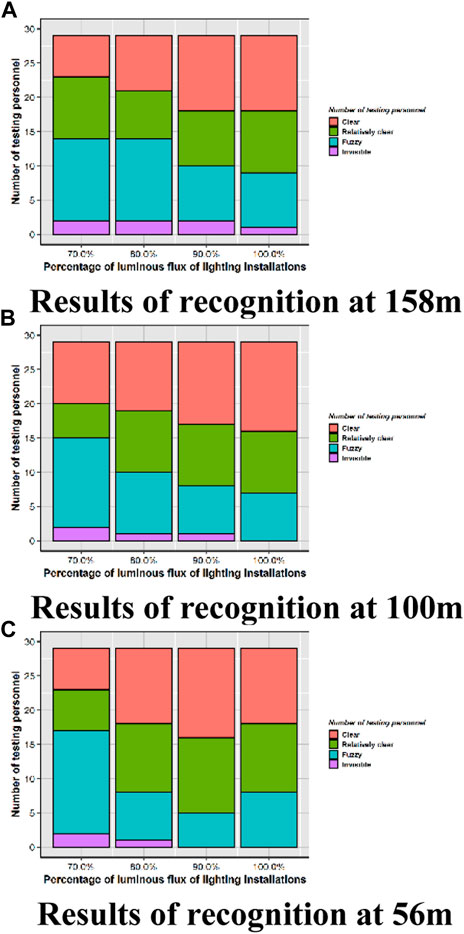
FIGURE 3. Results of small target recognition.
The results of small target recognition are acquired through the qualitative description of drivers, but the qualitative description is relatively abstract, so it cannot accurately describe the degree of traffic safety and shall be transformed into the quantitative expression of results. Therefore, the results of small target recognition by testing personnel were
The results of small target recognition by 29 testing personnel in different conditions were put into the traffic safety expression to get the traffic safety factors in different conditions; the results are shown in Table 3.
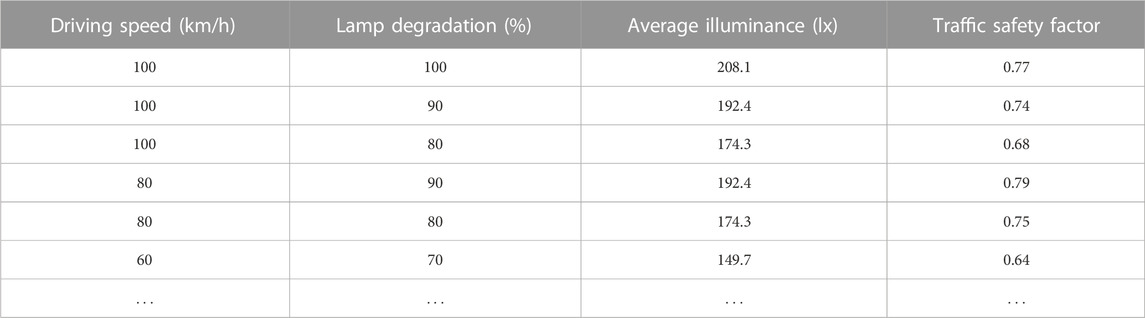
TABLE 3. Traffic safety factors in different conditions.
At present, the grid method is used to detect the pavement luminance of the lighting installations in immersed tunnels and judge the functional status of the lighting installations in immersed tunnels, but there are problems in such detection, including long interval time, interference with traffic and small scope of detection, so it is difficult to effectively judge them in real time. Therefore, based on the traffic safety factors of immersed tunnels under different degradation conditions, a traffic safety assessment model for immersed tunnels was formed in this paper through the analysis of performance degradation status data of lighting installations in immersed tunnels under the influence of environment and electrical factors.
Given that there are many factors influencing the performance degradation of lighting installations, the multi-sensor technology is used to collect the changes in various index factors of lighting installations, and based on the correlation between performance degradation of lighting installations and various influencing indicators, the index factors with high correlation are acquired and used as the key influencing index factors, and the correlation expression is as follows:
Where r is the correlation coefficient between a and b;
The correlation among the key indicators influencing the lighting installations in immersed tunnels, the performance degradation of lighting installations and the traffic safety factor is comprehensively analyzed, the dataset of key indicators of lighting installations and traffic safety factors is reconstructed, and the artificial intelligence (AI) algorithm is used to carry out the traffic safety assessment of immersed tunnels. Currently, there are many frequently-used status assessment methods, including grey correlation theory, fuzzy theory, machine learning and neural network [33–35], and with the strong learning ability and generalization ability and the flexible model structure, the neural network is widely used for judgment, prediction and evaluation. The performance degradation process of lighting installations is a time-sequence process, so the long short-term memory (LSTM) neural network in the neural network algorithm was employed in this paper to build a traffic safety assessment model for immersed tunnels [36, 37], and the basic steps are shown.
step1:. Build the LSTM neural network, and initialize relevant parameters, such as weight
step2:. Input the dataset (D) in the neural network, abandon the input of information in the forget gate layer, which is unacceptable for the performance degradation indicator data of E&M equipment in the hidden layer at the previous moment, control the input of new indicate data in the input gate layer, determine the data information to be updated, and calculate the output results of the neural network in the output gate layer;
step3:. Compare the actual traffic safety factor and the status results of model prediction, and calculate the loss function E;
step4:. If the loss function E is less than the setting value, it indicates the completion of training; otherwise, use the gradient descent to update the weight and bias in the neural network, and then return to Step (2) and recalculate it;
step5:. After the end of training, obtain the status assessment model for E&M equipment performance degradation.The LSTM neural network uses the structure containing input gate layer, forget gate layer and output gate layer to substitute for the hidden layer nodes of the traditional neural network, and the network structure is shown in Figure 4.The forget gate layer reflects the level of acceptance of the neural network to the previous hidden layer status
Where
Based on the output of forget gate layer and input gate layer as well as the network status
The output gate layer determines the output value according to the network status, and through the output of tanh layer and sigmoid layer,
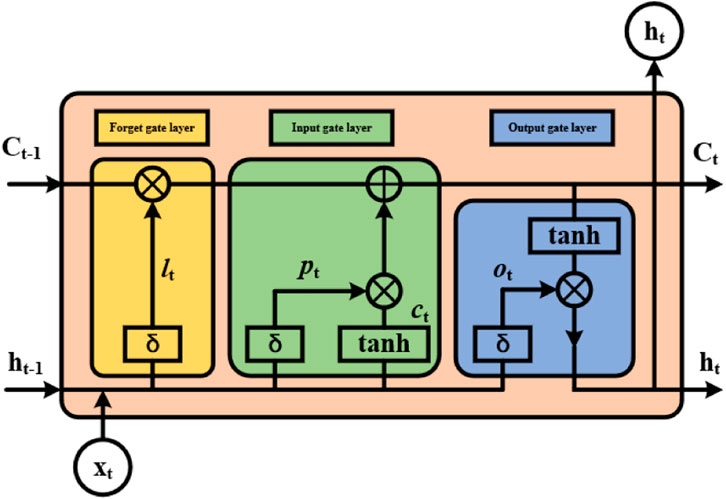
FIGURE 4. LSTM neural network structure.
To realize the evaluation of model results, the root-mean-square error (RMSE) was introduced in this paper to evaluate the model results, and the expression is as follows:
Where
Normally, the performance degradation process of lighting installations is characterized by long duration and varying environments. In this paper, the accelerated test data were used to obtain the degradation of lighting installations under different conditions, and combined with the traffic safety factor and the degradation of lighting installations, the data results were reconstructed, with the data size of 1,476 entries.
As one of the frequently-used methods of LSTM to solve the data fitting problems, data standardization is mainly used to eliminate the impact caused by the difference in the order of magnitude between different indicators, with the aim to make weight configuration more reasonable, accelerate data convergence and enhance the accuracy of data analysis, so the z-score method is employed for standardization in this paper, with the following expression:
Given that different indicators have different impacts on the traffic safety of immersed tunnels, the analysis of key indicators and the traffic safety assessment of immersed tunnels are carried out to effectively increase the accuracy of assessment results. In this paper, the correlation between various assessment indicators and the traffic safety factor of tunnels was analyzed and the key indicators influencing lighting installations were extracted. The correlation coefficient (r) of various indicators is shown in Figure 5.
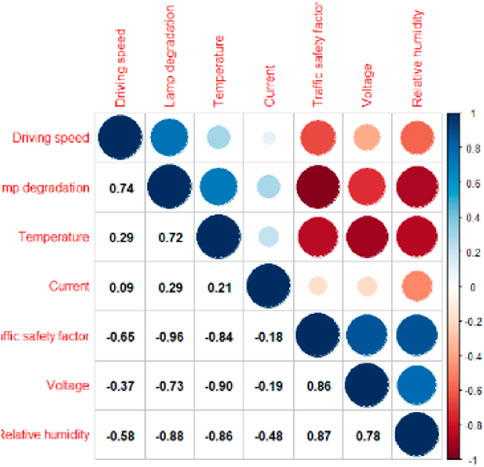
FIGURE 5. Correlation coefficient of each indicator.
It can be seen from Figure 5 that the influencing indicators strongly correlated with the traffic safety factor (
In the neural network, the mean square error (MSE) or the mean absolute error (MAE) is often used as the loss function, but MSE is sensitive to abnormal values and the process of abnormal values might affect the integrity of actual data, so MAE was used as the loss function in this paper.
When a performance degradation assessment model for lighting installations is built, model optimization shall be carried out. The relevant parameters of LSTM were set, such as sample size (samples), time step (time_steps) and batch size (batch_size), the LSTM assessment models with different times steps and different batch sizes were built, and MAE was utilized for verification; the results are shown in Figure 6.
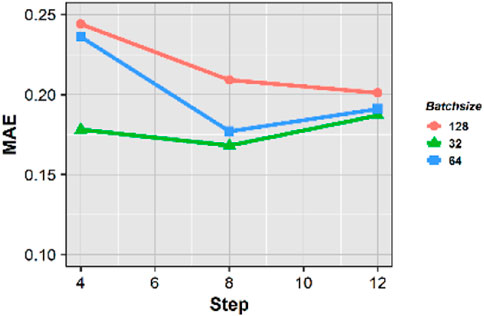
FIGURE 6. MAE value with different steps and batch sizes.
It can be seen from Figure 6 that when the time step remains unchanged, an increase occurs with the batch sizes, and the MAE value is gradually increased; when the data batch remains unchanged, an increase occurs with the time steps, and the MAE value is increased and then decreased. To acquire a more accurate data model, the time step of 8 and the batch size of 32 were selected as the model parameters in this paper.
The number of hidden layers and the number of nodes are the key parameters of LSTM, so an appropriate selection of the number of hidden layers can improve the accuracy of data results. Model optimization was conducted for the neural network models with different hidden layers (1, 2 and 3) and different hidden layer nodes (5, 15, 20 and 25), and the number of iterations was set as 100. The MAE values under different parameters are shown in Figure 7.
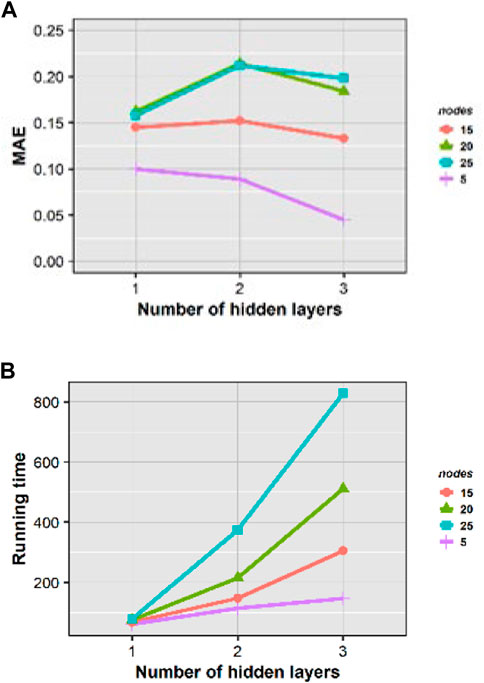
FIGURE 7. MAE values under different hidden layer parameters.
Based on the figure of errors of different LSTM network layers, it can be seen that the minimum assessment error occurs when the number of hidden layers is 3 and the number of hidden layer nodes is 5. If the number of network layers remains unchanged and the number of nodes is increased, the MAE value will be gradually increased; if the number of nodes remains unchanged and the number of hidden layers is increased, the MAE value will be gradually decreased, but an increase in the number of hidden layers will lead to an increase in training and evaluation time. Therefore, in consideration of model accuracy and a reduction in model running time, the number of hidden layers is finalized to be 2 and the number of hidden layer nodes is finalized to be 5 to build the assessment model.
To select an appropriate optimizer, Adagrad, Adadelta, RMSprop and Adam were analyzed and compared in this paper, and the time step was set as 8. The training results are shown in Figure 8.
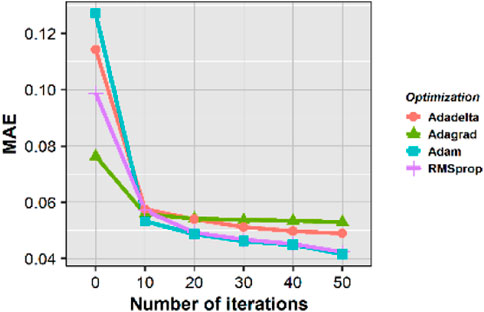
FIGURE 8. MAE values by using different optimizers.
It can be seen from the diagram that as the number of iterations increases, the loss function of the LSTM model in each optimizer is gradually reduced, and as the model loss function of the optimizer, Adam and RMSprop decline at the fastest pace, and when the number of iterations is 50, the loss function of the model with Adam as the optimizer is 0.0416, which is the minimum value, so Adam is selected as the model optimizer.
In this paper, the dataset of lighting installation tests was randomly divided into a training set and a test set. The training set data accounted for 80% of the dataset, while the test set accounted for 20%. The training set was put into the traffic safety assessment model for immersed tunnels, and its error function values and data prediction results were shown in Figures 9, 10.
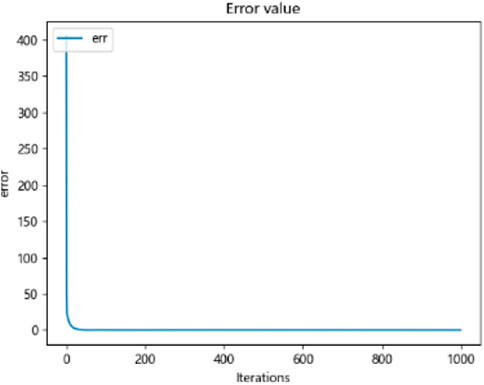
FIGURE 9. Error function value.
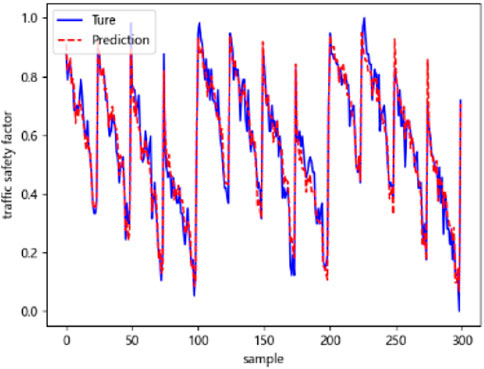
FIGURE 10. Data prediction results.
It can be seen from Figure 9 that in the first 26 iterations in the process of algorithm iteration, the model error value decreases rapidly, and in the subsequent iteration process, the error value decreases steadily until it is close to zero, and the model fitting process is gradually convergent; in Figure 10, the true value and predicted value in the training fitting results show a consistent trend of variations, with a relatively small error value, indicating that the model prediction results are better.
To ensure the accuracy of the traffic safety assessment model for immersed tunnels, the random forest (RF) and recurrent neural network (RNN) models were separately compared with the LSTM model in this paper. Test data are separately put into the RF and RNN models to compare the calculation results of different models (as shown in Figures 11, 12); the results of RMSE, R square and running time are shown in Table 4.
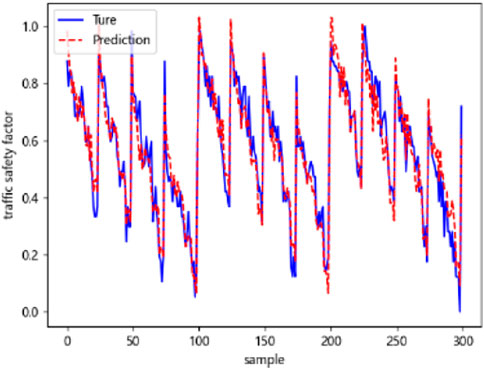
FIGURE 11. RF model calculation results.
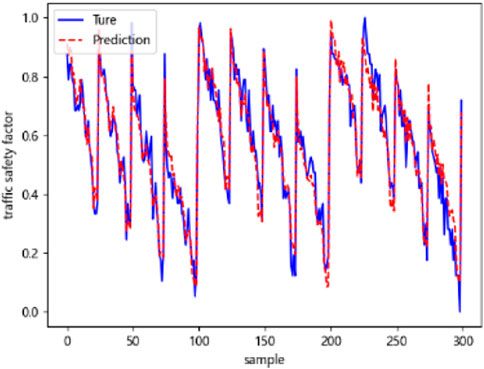
FIGURE 12. RNN model calculation results.
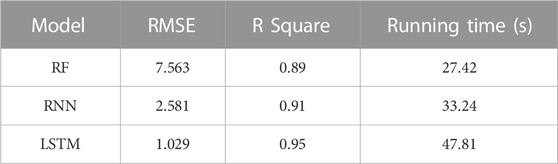
TABLE 4. Comparison of calculation results of different models.
It can be seen from Figures 11, 12 and Table 4 that, compared with the RF and RNN models, the LSTM model can assess the traffic safety of immersed tunnels more effectively, and its RMSE is relatively small and the accuracy is relatively high (up to 95%), indicating that the predicted values of the LSTM model is closer to the actual value in the process of data prediction; the running time of the LSTM model is longer than that of other models, but the running time does not exceed 1min, so the model prediction time can completely meet the demand for the routine traffic safety assessment of tunnels.
The quality of luminous effect of lighting installations in immersed tunnels has an important impact on the traffic safety of drivers and passengers. From the perspective of visual needs of drivers and passengers, the traffic safety assessment factor of immersed tunnels was established in this paper by simulating the characteristics of the tunnel lighting environment under different performance degradation conditions of tunnel lighting installations and according to the results of small target recognition by drivers and passengers; combined with the key indicators influencing the performance of lighting installations, the impact of the changes to the operating environment of lighting installations in immersed tunnels on traffic safety was explored in this paper. In the performance degradation simulation of lighting installations, it is difficult to simulate the production quality of different lighting installations, it is believed that the law of performance degradation of the same batch of lighting installations is identical, the parameters of lighting installations set in numerical simulation are identical, and the performance degradation simulation of luminous flux is identical. As a result, there might be an unavoidable error between the actual impact of performance degradation of lighting installations on the pavement lighting environment and the simulated performance degradation results. In a field test, the small target recognition test under dynamic traffic is not carried out for the sake of the safety of drivers and passengers when they dynamically recognize small targets, and testing personnel are stationary relative to a small target and recognize the small target in a physical tunnel, i.e. the surrounding environment is relatively stationary. There is a difference in the ability of human eyes to dynamically recognize and statically recognize objects, so the results of this study can offer relevant support to traffic safety in real tunnels.
Through comprehensively considering the impact of the operating environment and performance degradation of lighting installations and the traffic safety, a data-driven traffic safety assessment method of lighting installations in immersed tunnels is proposed in this paper, and based on the analysis of the impact of the performance degradation of lighting installations in immersed tunnels on the pavement luminance and the recognition of drives and passengers, the traffic safety factor of immersed tunnels was put forward in this study to evaluate the safety of lighting installations; a real-time kinematic traffic safety assessment model for immersed tunnels was built on the basis of the performance degradation of lighting installations in different environments and under different electrical indicators, and the traffic safety factor of immersed tunnels was dynamically predicted according to the relevant parameters, such as voltage, temperature, humidity and Lamp degradation. In this paper, the traffic safety factor, at which 50% of the testing personnel could clearly recognize small targets, was used as the boundary value, i.e. 0.6304, and if the traffic safety factor was less than 0.6304, it indicated that the lighting performance of the immersed tunnel is poor, and maintenance and repair measures could be taken to maintain the lighting installations, e.g. regular replacement and cleaning; if the traffic safety factor was higher than 0.6304, the luminous flux could be reduced properly to meet the requirements for traffic safety and lower the costs of lighting.
In this study, the traffic safety factor was proposed through the analysis of the impact of the performance degradation of lighting installations in immersed tunnels on the recognition status of drivers and passengers, and a real-time kinematic traffic safety assessment model was built according to the key index factors influencing the lighting performance degradation of immersed tunnels, with the aim to ensure the operating safety of immersed tunnels. The research conclusions mainly include:
1) The performance degradation of lighting installations is of great significance to the visual clarity of drivers and passengers and even to the traffic safety through the simulation of the changes in the tunnel pavement luminance and the small target recognition by drivers and passengers under the performance degradation of lighting installations in immersed tunnels. With the performance degradation of lighting installations, the small target recognition of drivers and passengers became weaker and weaker and the traffic safety factor became small, and even it is difficult to detect the existence of small targets.
2) Combined with the key indicators influencing the performance degradation of lighting installations, a real-time kinematic traffic safety assessment method for tunnels was proposed. The traffic safety factor was predicted according to the key indicators influencing the performance degradation, and the R square and RMSE of this model were superior to those of RF model and RNN model, so it could better predict the traffic safety factor of tunnels; meanwhile, the speed was predicted to be within 1min, meeting the requirements for the real-time kinematic assessment of immersed tunnels.
3) In this study, the traffic safety factor could quantitatively evaluate the performance status of lighting installations in immersed tunnels, and according to the small target recognition by testing personnel, the traffic safety boundary condition was put forward, i.e., the traffic safety factor was 0.6304, providing a new direction for the maintenance and repairs of the immersed tunnel management entity.
The original contributions presented in the study are included in the article/supplementary materials, further inquiries can be directed to the corresponding authors.
MY wrote the original manuscript and designed algorithm. JC, HD, and SL proposed the idea, supervised the research work, and revised the manuscript. MY and JC discussed and analyzed the results. All authors contributed to the article and approved the submitted version.
The present work was supported by the National Key R&D Program of China (No.2019YFB1600702).
Authors MY, HD, and JC were employed by the company China Merchants Chongqing Communications Technology Research and Design Institute Co, Ltd. Author SL was employed by the company Guangxi Xinhengtong Expressway Co, Ltd.
All claims expressed in this article are solely those of the authors and do not necessarily represent those of their affiliated organizations, or those of the publisher, the editors and the reviewers. Any product that may be evaluated in this article, or claim that may be made by its manufacturer, is not guaranteed or endorsed by the publisher.
1. Xiang-sheng C, Zhi-hao X, Xiao-hua B. Challenges and technological breakthroughs in tunnel construction in China[J]. China J Highw Transport (2020) 33(12):1–14.
2. Guo H, Yan Y, Ding H (2023). Development and application of automatic monitoring equipment for differential deformation of element joint in immersed tunnel[J]. Front Phys 11:94.
3. Cantisani G, Di Mascio P, Moretti L. Comparative life cycle assessment of lighting systems and road pavements in an Italian twin-tube road tunnel. Sustainability (2018) 10(11):4165. doi:10.3390/su10114165
4. Peña-García A, Nguyen TPL. A global perspective for sustainable highway tunnel lighting regulations: Greater road safety with a lower environmental impact. Int J Environ Res Public Health (2018) 15(12):2658. doi:10.3390/ijerph15122658
6. Montero JI, Antón A. Buoyancy driven ventilation in tropical greenhouses[J]. Acta Horticulturae (2000)(534) 41–8. doi:10.17660/actahortic.2000.534.3
7. Hirakawa S, Toeda K, Sugawara T, Sakamoto S. Maintenance factor in tunnel lighting installation. J Light Vis Environ (2013) 37(1):28–36. doi:10.2150/jlve.ieij130000495
8. Sung K. W. A study of the roust degradation model by analyzing the filament lamp degradation data[J]. Proc Korean Soc Automotive Eng (2012) 20(6):132–9.
9. Chiao CH, Wang WY. Reliability improvement of fluorescent lamp using grey forecasting model. Microelectronics Reliability (2002) 42(1):127–34. doi:10.1016/s0026-2714(01)00243-8
10.Ministry of Transport of the People's Republic of China. JTG_H12-2015 technical specifications of maintenance for highway tunnel[S]. Beijing: People's Communications Press (2015).
11. Cengiz M. The relationship between maintenance factor and lighting level in tunnel lighting. Light Eng (2019) 75–84. doi:10.33383/2018-115
12. Lee MW, Park KY, Kim PY, Park YJ, Kim H. A study on the calculation of maintenance factor(MF) of tunnel lighting in expressway considering the actual installation and maintenance conditions. J Korean Inst Illuminating Electr Installation Eng (2013) 27(3):7–15. doi:10.5207/jieie.2013.27.3.007
13. Dong W. Design and implementation of maintenance system for tunnel lighting equipment[J]. Mod Manufacturing Tech Equipment (2019).
14. Ruifeng L, Aiqiang X, Weichao S. Feature selection algorithm recommendation method for avionics based on meta-learning[J]. Syst Eng Electron Tech (2021) 502(07):2011–20.
15. Qingbing Z, Shiyuan W, Xiaofei Z. Research on early warning method of key equipment in nuclear power plant based on parameter autoregressive algorithm[J]. Nucl Power Eng (2021) 249(06):209–14.
16. Xi W. Yang Yongping. Dual-source system of co-generation of internal combustion engine and building load matching and operating characteristics analysis[J]. Proc Chin Soc Electr Eng (2014) 481(02):217–24.
17. Du W, Fu Q, Wang HF. Strong dynamic interactions between multi-terminal DC network and AC power systems caused by open-loop modal coupling[J]. IET Generation. Transm Distribution (2017) 11(9):2362–74.
18. Heitor R. Impact assessment of virtual synchronous generator on the electromechanical dynamics of type 4 wind turbine generators[J]. IET Generation. Transm Distribution (2019) 13(23):5294–304.
19. Omri N, Al Masry Z, Mairot NS, Giampiccolo S, Zerhouni N. Towards an adapted PHM approach: Data quality requirements methodology for fault detection applications. Comput Industry[J] (2021) 127:103414–3. doi:10.1016/j.compind.2021.103414
20. Compare M, Bellani L, Zio E. Reliability model of a component equipped with PHM capabilities. Reliability Eng Syst Saf (2017) 168:4–11. doi:10.1016/j.ress.2017.05.024
21. Yuliang D, Yaqiong LI, Haibin C. Real-time health condition evaluation on wind turbines based on operational condition recognition[J]. Proc CSEE (2013) 33(11):88–95.
22. Li W, Wei H, Qi G. A fast image dehazing algorithm for highway tunnel based on artificial multi-exposure image fusion[C]//IOP Conference Series: Materials Science and Engineering. IOP Publishing (2020) 741(1):012038.
23. X Zhen, L Gang, X Daqing Comprehensive analysis of the operating status of the electromechanical equipment of highway tunnels based on the Internet of Things technology[J]. China Transportation Information Technology, 2019(02): 142–3.
24. Zhang Z, Chu C, Zhu L. A method of highway electromechanical system facilities maintenance quality assessment based on AHP and fuzzy theory[C]//international conference on transportation information & safety (2011).
25. Yinli J, Lin W, Yang L. Structural division and effectiveness evaluation of highway tunnel electromechanical system[J]. Mod Tunnelling Tech (2016) 368(03):47–53.
26. Cui HJ, Zhu CZ, Wang L. Performance assessment model for highway electromechanical system. Adv Mater Res (2013) 706-708(1):892–6. doi:10.4028/www.scientific.net/amr.706-708.892
27. Liwei Z. Real-time assessment technology of operational risk of highway tunnel electromechanical system[J]. Highway (2017) (12): 176–81.
28. Jianping Z, Yu Z, Wenqing Z. A new life prediction model for optoelectronic products and its application [J]. J Opt (2018) 38(2):7.
30. Falkmer T, Gregersen NP. A Comparison of eye movement behavior of inexperienced and experienced drivers in real traffic environments. Optom Vis Sci Official Publ Am Acad Optom (2005) 82(8):732–9. doi:10.1097/01.opx.0000175560.45715.5b
31. He S, Bo L, Pan G, Wang F, Cui L. Influence of dynamic highway tunnel lighting environment on driving safety based on eye movement parameters of the driver. Tunnelling Underground Space Tech (2017) 67:52–60. doi:10.1016/j.tust.2017.04.020
33. Yuyan W, Bolin L, Chen P, Jun L, Yumin Y. Research review of recurrent neural networks [J]. J Jishou Univ (Nat Sci Ed) (2021) 42(1):41–48.
34. Liu Y, Wang L, Cheng J, Li C, Chen X. Multi-focus image fusion: A survey of the state of the art. Inf Fusion (2020) 64:71–91. doi:10.1016/j.inffus.2020.06.013
35. Zhu Z, Lei Y, Qi G, Chai Y, Mazur N, An Y, et al. A review of the application of deep learning in intelligent fault diagnosis of rotating machinery. Measurement (2022) 206:112346. doi:10.1016/j.measurement.2022.112346
36. Qi G, Zhang Y, Wang K, Mazur N, Liu Y, Malaviya D, et al. Small object detection method based on adaptive spatial parallel convolution and fast multi-scale fusion. Remote Sensing (2022) 14(2):420. doi:10.3390/rs14020420
Keywords: immersed tunnel, deep learning, luminaire failure, traffic safety, safety assessment
Citation: Yang M, Lu S, Ding H and Chen J (2023) Traffic safety assessment method of the immersed tunnel based on small target visual recognition image. Front. Phys. 11:1159531. doi: 10.3389/fphy.2023.1159531
Received: 06 February 2023; Accepted: 22 February 2023;
Published: 08 March 2023.
Edited by:
Bo Xiao, Imperial College London, United KingdomReviewed by:
Guanqiu Qi, Buffalo State College, United StatesCopyright © 2023 Yang, Lu, Ding and Chen. This is an open-access article distributed under the terms of the Creative Commons Attribution License (CC BY). The use, distribution or reproduction in other forums is permitted, provided the original author(s) and the copyright owner(s) are credited and that the original publication in this journal is cited, in accordance with accepted academic practice. No use, distribution or reproduction is permitted which does not comply with these terms.
*Correspondence: Hao Ding, ZGluZ2hhb0BjbWhrLmNvbQ==; Jianzhong Chen, Y2hlbmppYW56aG9uZ0BjbWhrLmNvbQ==
Disclaimer: All claims expressed in this article are solely those of the authors and do not necessarily represent those of their affiliated organizations, or those of the publisher, the editors and the reviewers. Any product that may be evaluated in this article or claim that may be made by its manufacturer is not guaranteed or endorsed by the publisher.
Research integrity at Frontiers
Learn more about the work of our research integrity team to safeguard the quality of each article we publish.