- 1School of Architectural Engineering, Huanghuai University, Zhumadian, China
- 2Henan International Joint Laboratory of Structural Mechanics and Computational Simulation, Huanghuai University, Zhumadian, China
This study investigates the method and application of single-channel, three-component microtremor signal co-directional Rayleigh surface-wave extraction. The research focuses on filtering linear polarization waves using polarizability wave and phase-difference filtering, which were analyzed based on both simulated data and real microtremor signals. Additionally, the study examines the use of time-frequency analysis to analyze microtremor signals and identify Rayleigh wave propagation direction. The combination of these methods leads to a set of procedures for extracting high-SNR co-directional Rayleigh surface waves from microtremor signals, which was applied to the elliptical polarizability imaging method. Results indicate that the proposed data processing process effectively filters linear polarization waves and accurately determines the propagation direction of the Rayleigh wave, leading to significant improvement in the accuracy of elliptical polarizability exploration results. This provides a reference for obtaining high signal-to-noise ratio data in microtremor Rayleigh wave seismic exploration.
1 Introduction
There are continuous weak vibrations of various frequencies on the Earth’s surface at all times. Microtremors, also known as micromotions, are continuous weak vibrations that occur on the Earth’s surface and vary irregularly with space and time in the field of seismic engineering. With advancements in seismic wave monitoring technology, the study of microtremor signals has advanced, and its applications in seismic wave exploration have broadened.
Although complex, microtremor signals provide valuable information about geological structures. Tokimatsu et al. studied the components of the microtremor signal, and the results showed that the microtremor signal was mainly composed of body waves (P and S waves) and surface waves (Rayleigh and Love waves) [1–5]. Toksöz and Lacoss found that high-frequency microtremor signals contain body waves and Rayleigh surface wave components, whereas low-frequency microtremor signals are mainly composed of a fundamental Rayleigh surface wave. The main source of signals with frequencies higher than 1 Hz is human activities of near-field sources [6]. Rayleigh surface waves are dominant in microtremor signals with far-field source characteristics, and the energy of Rayleigh surface waves accounts for 2/3 of the total excitation energy. The spectrum distribution characteristics of microtremor signals change with changes in the detection location. The main frequency and amplitude of data at different locations have obvious differences that are closely related to the site [7]. The research results not only show the complexity of the composition of the pulsation signal, but also lay the foundation for the application of the microtremor signal to geological structure exploration and promote the vigorous development of the microtremor seismic wave exploration method.
In recent years, the microtremor seismic exploration method has become increasingly popular among engineers, especially for the exploration of Rayleigh surface waves through microtremor analysis. One approach is the velocity dispersion method, which utilizes the kinematic properties of Rayleigh surface waves. For example, Aki proposed the spatial autocorrelation method (SPAC) to extract the velocity dispersion curve from ground pulsation records [8, 9], the frequency-wave number spectrum proposed by Capon in 1969 [10], and Claerbout’s seismic interference technique for interpreting the internal structure of the medium by extracting Green’s function from the microtremor signal [11]. On the other hand, the elliptical polarization method based on the dynamic characteristics of Rayleigh surface waves, such as Boore and Toksöz, was proposed in 1969 to study the feasibility of using the dynamic characteristics of the elliptical polarization of Rayleigh surface wave particles to study the crustal structure. Research shows that the elliptical polarization of particle motion in layered media changes with the frequency, and can interpret the geological structure in the same way as the velocity dispersion method [12]. Nakamura studied the field effect in 1989 by utilizing the Fourier spectral ratio (HVSR) on three-component data from a single detector [13]. The elliptical polarizability method is widely used worldwide.
However, the application of these exploration methods is mostly based on the stationary characteristics of the microtremor signals. In fact, Toksöz (1964) found that the conditions required for the microtremor signals of different frequency bands to meet the stationary characteristics are different [14], that not all the randomly intercepted seismic records meet the stationary characteristics, and that stationarity can be established only under very harsh conditions [15]. This significantly affected the accuracy of the exploration results. This limitation significantly restricts the applicability of exploration methods relying on stationary microtremor signals. For example, Du et al. theoretically deduced the influence mechanism of the interference wave of the microtremor recording on elliptical polarizability. The results show that linear polarization waves, Rayleigh surface waves in different directions, and other interference waves strongly interfere with the calculation of elliptical polarizability, and the imaging shifts in the direction [16, 17]. This conclusion provides a direction for extracting the elliptical polarizability of Rayleigh surface waves using microtremor signals. Therefore, in addition to extracting stationary microtremor signals, geological structure exploration can also be realized by extracting high signal-to-noise ratio co-directional Rayleigh waves through wave-field separation.
In recent years, many achievements have emerged in the research of wave field separation [18–20], and different methods have been adopted according to different data types and application directions. For example, the P-wave and S-wave separation of multi-wave seismic data are generally based on the kinematic characteristics (wave velocity, vibration direction) and dynamic characteristics (wave amplitude, frequency, and phase) of seismic waves, mainly the F-K filtering τ- P transform, Radon transform, polarization filtering, full waveform inversion, divergence, and curl methods [21–24]. At present, the separation methods of mixed mining wave fields are mainly based on inversion theory and filtering denoising [25–28]. Wave field separation and suppression methods of multiples mainly include filtering methods based on signal analysis and prediction methods based on wave equation (29)–(33). However, there are few studies on the wave field separation of Rayleigh waves in microtremor signals. In the 1940 s, the concept of time-frequency analysis that refines the overall features to local features was proposed, which can determine the energy distribution at any time and frequency and clearly express the relationship between the frequency spectrum and time, providing a favorable tool for the analysis and research of non-stationary signals. In 1932, Winger proposed the concept of time-frequency joint analysis, and then Ville introduced it into signal processing to form the classic video analysis method, Winger-Ville [34]. In 1968, Rihaczek proposed the concept of a complex energy density function when studying the distribution of the signal energy in the time and frequency domains. On this basis, Ren é RM provided a solution—instantaneous polarization characteristics of signals in Complex Trace Analysis of signal processing [35]. However, for the superimposed signal, filtering directly according to the instantaneous polarization characteristics causes significant errors. Galiana-Marino designed an optimized filtering scheme based on the multi-scale characteristics of the wavelet transform, which can effectively filter linearly polarized waves. The above wave-field separation methods and research conclusions still have many shortcomings when applied to the extraction of Rayleigh surface waves from microtremor signals; however, they provide a theoretical basis for the research content of this paper. In addition, the finite element method, which is widely used in solid mechanics, acoustics, and other aspects [36–41], was used in this study, providing technical support for this study.
In summary, the microtremor signal is common on Earth, Rayleigh surface waves are dominant in the far field, and the spectral characteristics are closely related to the site changes; therefore, they can be used as a signal source for seismic wave exploration. However, its signal composition is complex and cannot meet the requirements of high signal-to-noise ratio of active source signals, and it is difficult to strictly meet the requirements of signal stability, which seriously affects the accuracy of Rayleigh surface wave exploration results. At the same time, the complexity of the signal components makes simple wave field separation unable to meet the requirements of engineering applications. In view of the above problems, this study combines polarization filtering, phase difference filtering, and directional filtering, and uses numerical simulation and time-frequency analysis to study the method of extracting the same direction high signal-to-noise ratio surface wave from the microtremor signal, and applies it to the Rayleigh surface wave ellipse polarizability imaging method. The purpose was to improve the imaging accuracy of microtremor Rayleigh wave exploration and promote the application of microtremor signals in engineering exploration.
2 Numerical simulation
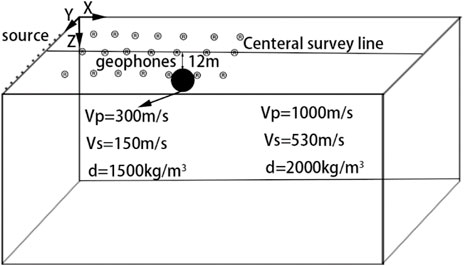
This study mainly focused on the extraction method of high-quality Rayleigh surface waves in a microtremor signal. The experimental data were obtained from numerical simulations and actual site data. This section introduces the numerical model and parameters of the simulation data used in this study. A homogeneous half-space model is shown in Figure 1. To simulate the microtremor signal more realistically, a spherical cavity was set in the inhomogeneous half-space to simulate the inhomogeneous geological characteristics as required. Considering the far-field characteristics of the microtremor signal, a plane-wave source was used in the numerical simulation. Each plane wave source was composed of a linear array of point sources. According to the Huygens principle, the wavefront of a Rayleigh wave radiated by a linear array of point sources is a plane type, and the plane wave field in the full text is simulated in this manner. The model grid was divided into 2 m, and the 20 Hz dominant frequency of the Rick wavelet was selected as the source. The array spacing between the geophones was 2 m. A central line was set at the center of the model. The spherical cavity was directly below the line.
Different source distributions were set according to the different research contents in this study. Seismic wave data in different directions and from multiple sources can be simulated by adjusting the source location and number of sources. Table 1 shows the elastic parameters of the half-space model; medium one is selected for the local abnormal body, and medium two is selected for the homogeneous semi-infinite space.
Figure 2 shows a snapshot of the wave field of the seismic wave propagation in homogeneous media. At 0.2 s, it can clearly see the P wave, S wave and Rayleigh surface wave; At 0.35 s and 0.4 s, since the longitudinal wave propagates to the boundary of the model, the reflected wave at the boundary of the model can be seen. The finite element software can clearly describe the propagation of seismic waves in elastic media. The simulated seismic-wave data used in this study were obtained using this software.
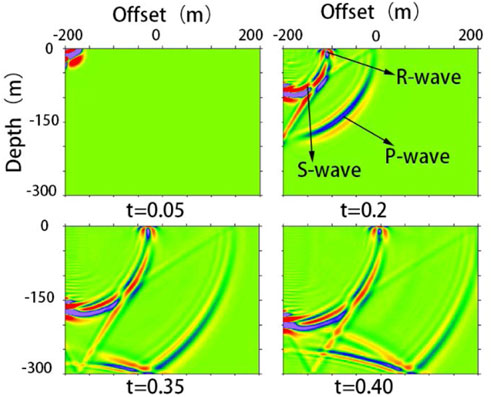
FIGURE 2. Snapshot of vertical profile wave field at different times of homogeneous half-space model.
3 Linear polarization wave filtering method
Microtremor signals include not only linearly polarized waves such as body waves and longitudinal waves, but also elliptically polarized Rayleigh surface waves propagating in different directions, and signals from multiple sources may be received in the same time period. Therefore, using the Rayleigh surface wave method to extract geological structure information from microtremor signals requires a feasibility analysis of wave selection according to the characteristics of microtremor signals to ensure that Rayleigh surface waves with high signal-to-noise ratios can be extracted from the microtremor signal. The particle trajectory of Rayleigh surface waves is elliptical and has elliptical polarization characteristics. However, the trajectories of particles such as body waves and longitudinal waves are linearly polarized waves. At the same time, the phase difference between the horizontal and vertical components of Rayleigh wave is
3.1 Polarizability filtering method
Polarization filtering is primarily used to separate linearly polarized waves according to the elliptical polarization characteristics of the particle trajectory of Rayleigh surface waves. The polarizability of the particle trajectory of the Rayleigh surface wave, which is an ellipse, can be determined through the ratio of its short to long half axis or by analyzing the spectral ratio of its horizontal and vertical components with Fourier transform. Then, the wave fields of linearly and elliptically polarized waves were separated based on the determined polarizability. However, when a section of the signal contains both a linear polarization wave and an elliptical polarization wave, the spectrum ratio does not truly reflect the polarization characteristics of the Rayleigh surface wave related to the site because the Fourier transform is the average characteristic of the entire seismic record spectrum. The linearly polarized wave in the signal can be effectively filtered out by separating the wave field at different scales and reconstructing the signal through a wavelet transform. The Hilbert transform converts the real signal into an analytic complex signal, which is then divided into different scales using wavelet transform. Finally, the Stokes parameters were used to calculate the instantaneous long and short half axes of the signals at different scales. The filter function was set according to the elliptic polarization parameters. The basic principles are as follows:
The Hilbert transform can transform the real signal
It can also be written as:
Where
The instantaneous frequency can be expressed as:
Three types of instantaneous signal information can be obtained by the Hilbert transform: instantaneous amplitude, instantaneous phase, and instantaneous frequency. Owing to the large overall wave filtering error, it is necessary to perform a wavelet transform on the analytical signal to obtain the instantaneous information of signals with different scales. The instantaneous long and short half-axes of the seismic records can be calculated using the following formula:
The following paper analyzes the filtering characteristics and effects of polarization filtering through the simulation data of homogeneous half-space and transverse non-homogeneous half-space.
Figure 3A shows 120 channels of original seismic records simulated by the homogeneous medium model with a sampling rate of 0.0005 and a duration of 1 s. It can be seen from the figure that the seismic record contains direct P wave, direct Rayleigh surface waves, Rayleigh surface waves, and S wave reflected from the model side boundary and bottom boundary. The wave field was relatively complex. To compare the effects of polarization filtering, the filtering parameters were set to 0.1, 0.3, and 0.4, and the corresponding seismic records were 3b, c, and d, respectively. When the filtering parameter was set to 0.1, only part of the S-wave reflected from the bottom edge in Figure 3B was filtered, and the rest was basically unchanged; when the parameter was set to 0.3, the reflected wave and the direct P-wave in Figure 3B. Were filtered, but the boundary-reflected Rayleigh wave was also filtered as a linearly polarized wave. When the parameter is set to 0.4, in the near-source section, because the stable Rayleigh wave has not yet formed, excessive filtering will distort the signal, and polarization filtering can filter the linear polarization wave well.
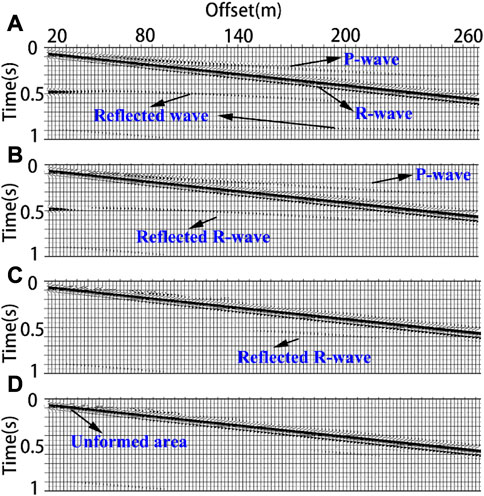
FIGURE 3. Seismic record. (A) Is the original signal simulated by the homogeneous half-space model; (B–D) are seismic records after polarization filtering with parameters of 0.1, 0.3 and 0.4 respectively.
Considering the complexity of the natural geological structure, the seismic records were processed with local inhomogeneity in the model in the same manner, and the results are shown in Figure 4.
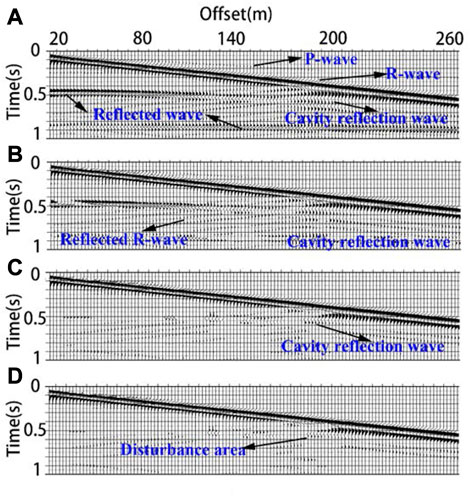
FIGURE 4. Seismic record. (A) is the original signal simulated by the transverse inhomogeneous half-space model; (B–D) are seismic records after polarization filtering with parameters of 0.1, 0.3 and 0.4 respectively.
Figure 4A shows the original simulated seismic record propagating in the transverse inhomogeneous half-space model. Compared with Figure 3A, seismic record 4a has more reflected waves from the local inhomogeneous media. When the filtering parameter was 0.1, the linear polarization wave could not be filtered (Figure 4B). When the parameter was increased to 0.3, it can be seen in Figure 4C that most of the linear polarization wave and the reflection wave near the local abnormal body were filtered. However, from the comparison of 4a, c, and d, it can be seen that polarization filtering can still eliminate most linear polarization waves for seismic records containing local abnormal bodies. However, because the surface wave generates strong emission when passing through an abnormal body, the signal received by the geophone is no longer a stable surface wave; thus, the Rayleigh surface wave signal near the abnormal body becomes more distorted as the filtering degree increases.
From the above numerical experimental results, it can be found that polarization filtering has a good filtering effect for simple body waves and stable Rayleigh surface wave superposition. However, for complex signals, it is difficult to filter the linear polarization wave without causing signal distortion, especially for signals that have not formed stable surface waves. At the same time, this method needs to undergo column operations such as wavelet transform and data reconstruction when processing the data. Processing a large amount of microtremor data takes a long time. This method is not suitable for preliminary screening of a large amount of data. After determining the high-quality microtremor signal segment, the polarization filtering method can be used as a fine processing method to filter body wave interference without causing signal distortion.
3.2 Phase difference filtering method
In addition to the polarization characteristics, the phase difference of
According to the relevant introduction in the previous section, the instantaneous phase, instantaneous amplitude, and instantaneous frequency of each seismic record can be obtained using the Hilbert transform, and the instantaneous phase difference formula of the horizontal component
Where
To improve the accuracy of filtering, this study does not directly perform phase difference on seismic records, but does wavelet transform on signals, and then sets the filtering function with phase difference as the filtering condition. The filtering effect was verified using homogeneous and inhomogeneous model data; the results are shown in Figure 5.
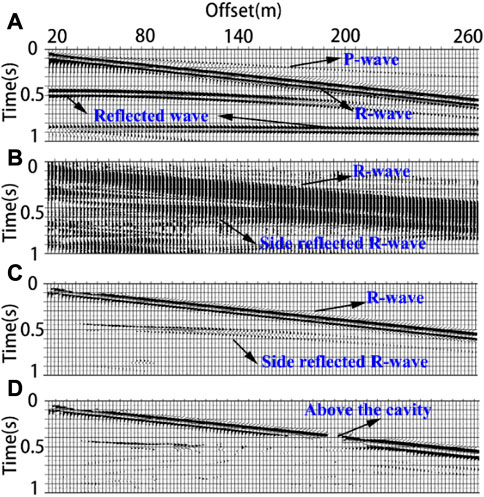
FIGURE 5. Seismic record. (A) Is the original seismic record simulated by the homogeneous half-space model; (B) Is the corresponding instantaneous phase difference between the horizontal component and the vertical component, (C, D) are the phase difference filtering results of seismic records of homogeneous model and transverse inhomogeneous model respectively.
Figure 5A shows the original seismic record of the homogeneous model, in which the linear polarization wave includes the P-wave and the body wave reflected from the bottom boundary, and the elliptical polarization wave includes the direct Rayleigh surface wave R and the two groups of Rayleigh surface waves reflected from the side boundary. The original seismic records of the transverse inhomogeneous model are not presented in this figure. To illustrate the characteristics of the phase difference more clearly, Figure 5B. Shows the absolute value of the phase difference between the horizontal and vertical components. It can be seen from the figure that the direct Rayleigh surface wave and Rayleigh surface wave reflected from the sides of the two models can reflect all Rayleigh surface waves in the seismic record. Although the amplitude of the lowest reflected Rayleigh wave in the seismic record is very weak, it is still clear in the figure; however, the linear polarization wave is not shown.
Figure 5C is obtained after phase-difference filtering. Only Rayleigh surface waves can be seen in the figure, and the linearly polarized waves are well filtered. Compared with the effect of polarization filtering (Figure 4C), the Rayleigh surface wave reflected from the side boundary is still retained because the horizontal component must be consistent with the propagation direction of the wave through polarizability conditional filtering. Otherwise, Rayleigh surface waves with different propagation directions are filtered to different degrees while filtering body waves. The phase-difference filter does not have this problem because it does not consider the amplitude strength. For three-component data, the two horizontal components have the same phase; therefore, the wave propagation direction can be ignored for filtering. This method is more suitable for the preliminary filtering of microtremor data. Figure 5D shows the filtering results of the phase-difference method on the seismic records containing local abnormal bodies, which can also effectively filter the linear polarization wave. However, owing to the existence of local abnormal bodies, the Rayleigh surface wave near the abnormal body is seriously disturbed, and after filtering, there is a more serious distortion than in the elliptical polarizability wave method.
3.3 Comparative analysis of case application
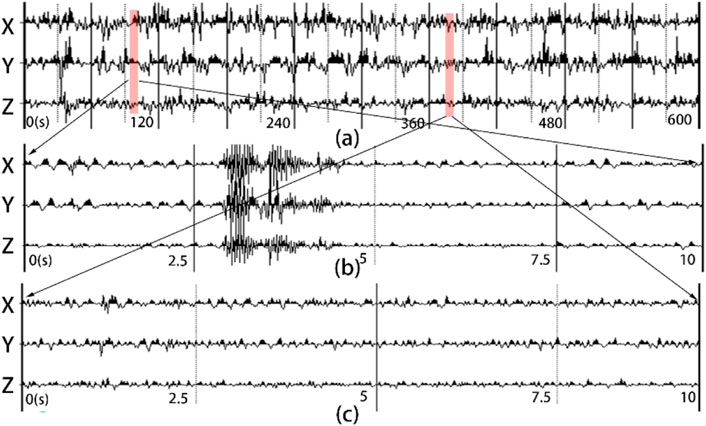
The principles of elliptic polarization filtering, phase difference filtering, and the filtering effect of numerical simulation data were studied. Next, the two methods were applied to the microtremor case data, and their filtering effects were compared. The geophone selected for data acquisition in this study was an EPS-3 digital seismometer produced by the Chongqing Instrument Factory. This instrument is a three-component data collector with a signal acquisition range of 150 Hz. The data were collected in Luxian County, Sichuan Province, China in October 2015. The sampling interval and sampling time interval were 10 m and 0.01 s, respectively. The seismic records are shown in Figure 6. Figure 6A shows the 600 s three-component seismic records of the sampling market. It can be seen from the amplified seismic records (Figures 6B, C) that some of the samples tend to be stable and some contain strong earthquake signals in the 10 s sampling time.
To illustrate the filtering effect of polarization filtering and phase difference filtering methods on the microtremor case data, three groups of special microtremor data were selected for the experiment. Figure 7A Shows the vertical component of the original data for the three groups of data, and the signal length was 10 s. Figures 7B, C correspond to the three groups of vertical component data after polarization filtering and phase-difference filtering, respectively.
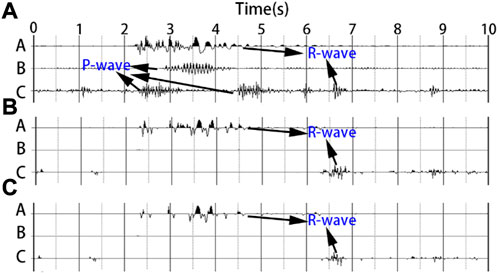
FIGURE 7. Seismic records, A, B and C are vertical component seismic records including Rayleigh surface wave, body wave and Rayleigh surface wave respectively. (A) Is the original record; (B, C) are the results of (A) polarization filtering and phase difference filtering, respectively.
The results show that the group A data almost retains the complete signal after being processed by the two filtering methods, which indicates that the Rayleigh surface wave of the signal in group A is dominant. The missing part of the signal after filtering is caused by a combination of high-frequency body waves in the signal and the filtering parameter settings. It is explained here that both methods automatically recognize Rayleigh surface waves and can separate the wave field. A specific application analysis will be provided in the article on microtremor data processing. The signals in Group B are almost completely removed after being processed by the two filtering methods, which indicates that the signals in Group B are body waves. For this type of signal with a high body wave content, both filtering effects were very good. The Group C seismic records contained several wave groups. After filtering, the results of the two methods retained one group, whereas the rest were filtered. The only wave group in Group C was a Rayleigh surface wave.
In conclusion, both polarization filtering and phase-difference filtering can eliminate the body wave in the signal to a certain extent and complete the separation of body waves and Rayleigh surface waves. Polarization filtering is highly dependent on the amplitude and requires a long operating time. In the case of an unknown direction, Rayleigh surface waves propagating from some directions may be mistaken for body wave filtering, but the wave field separation effect is better than that of phase difference filtering. The phase difference filtering method does not consider the amplitude strength, and because the two horizontal components have the same phase, it can filter without knowing the propagation direction of the wave. However, the low-amplitude Rayleigh wave signal will cause great interference, and the disturbance caused by the local abnormal body is more likely to cause distortion. Therefore, the phase-difference filtering method is more suitable for the preliminary Rayleigh surface-wave filtering of microtremor data, and the polarization filtering method is more suitable for the final fine filtering of body waves. Based on the research objectives of this study, these two methods can be applied to different stages of data processing.
4 Direction recognition of Rayleigh wave
The propagation direction of Rayleigh surface waves plays an important role in extracting geological structural images using non-stationary microtremor signals. For example, in the Rayleigh surface-wave elliptic polarizability method, the imaging of abnormal bodies in the profile shifts along the propagation direction. Therefore, this section studies the time-frequency analysis method of microtremor signals and extracts the principal components of Rayleigh surface waves through a time-frequency analysis method. The directional filtering method of Rayleigh surface waves is studied through time-frequency analysis and the anti-clockwise rotation characteristics of surface wave particle motion.
4.1 Application of time-frequency analysis
The microtremor signal is composed of harmonics of various frequencies, amplitudes, and initial phases that propagate in different directions. The harmonics with the strongest energy had the greatest impact on the characteristics of the entire signal. In this study, the instantaneous frequency and instantaneous phase at the moment of strongest energy are called the dominant frequency and dominant phase, respectively. The specific processing flow for extracting the principal component information of the signal through time-frequency analysis is as follows: First, the signal is analyzed in the time-frequency domain to determine the time
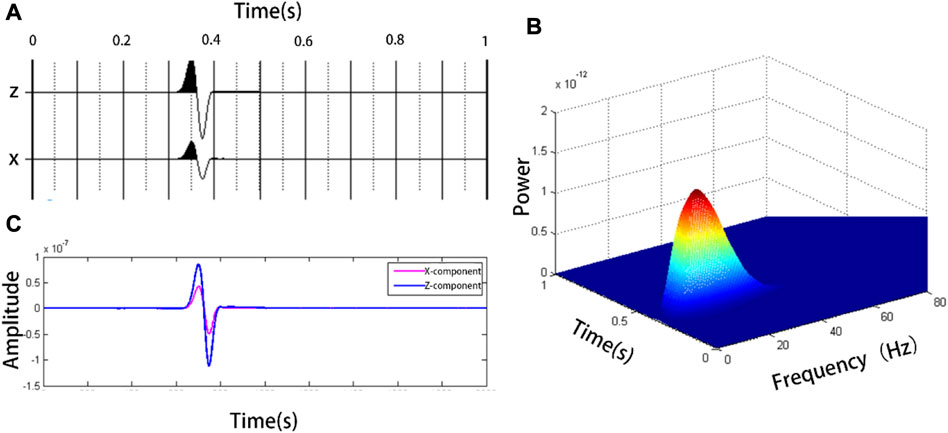
FIGURE 8. (A) shows the horizontal and vertical component seismic records of the simulated body wave, (B) is the time-frequency distribution diagram of the vertical component in (A, C) is the comparison of seismic records after bandpass filtering.
Figure 8A shows the body wave propagating in a homogeneous medium, and its time-frequency distribution is shown in Figure 8B. The energy distribution in a homogeneous medium is relatively smooth and concentrated, with 14.16 Hz as the dominant frequency, and the maximum energy point located at (0.3655 s, 14.16 Hz), as the signal is not affected by other waves. It can also be clearly seen from the superposition diagram of the horizontal and vertical components of the filtered seismic records that the phases of the two components were almost the same (Figure 8C). The instantaneous phase difference at 0.3655 s was 0.0614°or 3.52°. The phase difference is very small and can be regarded as in-phase. This is consistent with the fact that the horizontal and vertical components of the linearly polarized wave are in phase.
Figure 9A shows the simulated Rayleigh surface wave seismic record of the homogeneous medium, and Figure 9B shows the time-frequency energy distribution diagram of the Z component. The maximum energy points is (0.425 s, 20.99 Hz). There was an obvious phase difference in the filtered seismic record stack diagram (Figure 9C). The instantaneous phase difference between the horizontal and vertical components at 0.425 s was 1.5709°or 90.01°. This is consistent with the expected phase difference of 90° between the horizontal and vertical components of the Rayleigh surface wave. In the numerical simulation signal, without interference from other waves, many methods can easily distinguish its signal characteristics; however, the components of the microtremor signal are more complex, and the extraction of the principal components is more complex. At this time, the time-frequency analysis method has more prominent advantages. The practicability of this method was verified using two groups of microtremor signals dominated by Rayleigh surface waves and body waves.
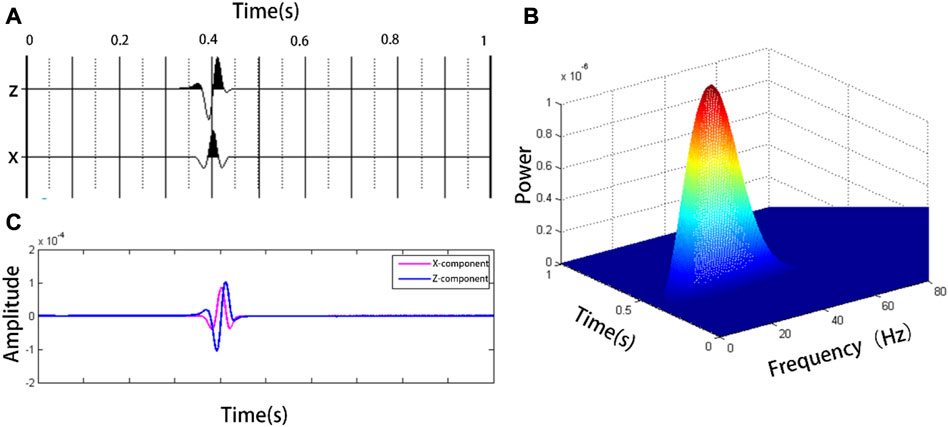
FIGURE 9. (A) Is the horizontal and vertical component seismic records of simulated Rayleigh wave, and (B) is the time-frequency distribution diagram of the vertical component in (A); (C) is the comparison of seismic records after bandpass filtering.
Figure 10A shows a group of three-component original microtremor seismic records dominated by body waves with a duration of 10s. From the time-frequency energy distribution diagram (Figure 10B) of the vertical component seismic record Z, it can be seen that the energy of the microtremor signal in this section is approximately 20 Hz, and there is a series of wave groups with strong energy in approximately 5 s. The maximum point of its energy is (4.96 s, 24 Hz). The three-component seismic record was band-pass filtered at 24 Hz and the filtering range was determined according to the energy distribution. The seismic record stacking diagrams of the filtered vertical and horizontal components are shown in Figure 10C. Since the dominant frequency of the signal in this section is high, in order to clearly display the signal characteristics, only the records between 3.96 s and 5.96 s are selected in Figure 10C. The figure illustrates that the phases of the vertical and horizontal components are largely in phase. At the same time, the instantaneous phase difference at 4.96s is 0.2085 (11.9°), which is very small and can be considered to be the same phase wave.
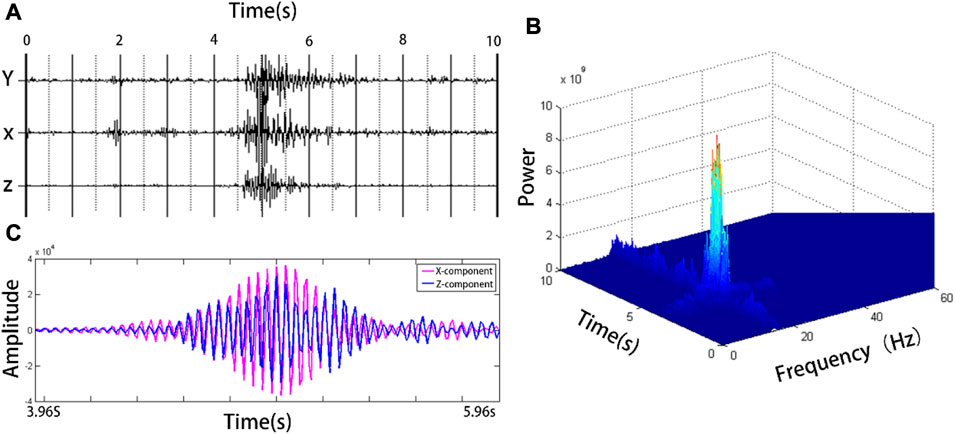
FIGURE 10. (A) shows the horizontal and vertical component seismic records of the body wave dominant microtremor signal, and (B) shows the time-frequency distribution of the vertical component in (A); (C) Is the comparison of seismic records after bandpass filtering.
Figure 11A shows a group of three-component original microtremor seismic records dominated by Rayleigh surface waves with duration of 10 s. From the time-frequency energy distribution of the vertical component seismic record Z, it can be seen that there is a series of wave groups with strong energy between 2 s and 5 s. From the perspective of frequency, the microtremor signals in this section have strong energy from 2 Hz to 30 Hz. The maximum energy point is (2.47 s, 3.71 Hz), and the three-component seismic record was band-pass filtered with a 3.71 Hz as the center. The filtered vertical and horizontal component seismic record stack diagram is shown in Figure 9C., which shows that the vertical and horizontal component phases are obviously out of sync. After calculation, the instantaneous phase difference at 2.47 s was 1.8629 (106.7°). Near
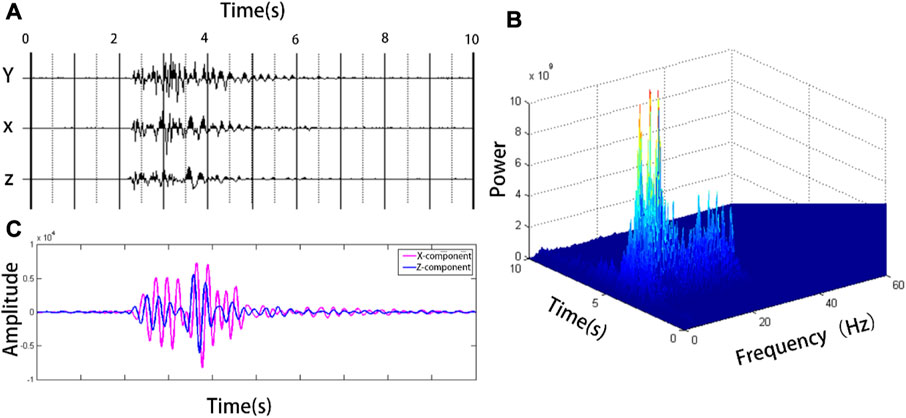
FIGURE 11. (A) shows the horizontal and vertical component seismic records of the Rayleigh wave dominant microtremor signal, and (B) shows the time-frequency distribution of the vertical component in (A); (C) is the comparison of seismic records after bandpass filtering.
The nonstationary characteristics of the microtremor signal change its frequency distribution over time. The time-frequency domain can clearly reflect the energy distribution of each time and frequency point of the microtremor record, which is more suitable for the analysis of non-stationary microtremor seismic records. In this study, the time-frequency analysis method was used to study the active source seismic records and site microtremor records. The findings indicate that the utilization of time-frequency analysis does not significantly enhance the analysis of active source seismic records, which possess low levels of interference. However, for microtremor signals that consist of complex components, the main components can be effectively isolated through the application of time-frequency analysis. The principal components of the microtremor signal are extracted using a time–frequency analysis method, which effectively improves the accuracy of the characteristic analysis of the microtremor Rayleigh wave. It plays an important role in the identification and direction determination of polarization characteristics.
4.2 Analysis of Rayleigh wave propagation direction
Determining the direction of wave propagation is a crucial aspect of seismic exploration. The identification of the propagation direction through single-channel three-component Rayleigh surface wave data is based on the fact that the Rayleigh surface wave travels in a counterclockwise elliptical motion along the wave’s propagation direction. Methods for discrimination will be discussed below.
The Rayleigh surface wave had the strongest energy among all the received waves in the dominant microtremor signals. The vertical component of the Rayleigh surface wave had the strongest energy when the source was vertically loaded in the homogeneous half-space model. Therefore, in this study, we determined the moment with the strongest energy at all sampling points through the
When
When,
Angle a is the included angle between the propagation direction and positive direction of the X-axis. A may differ from the actual propagation direction of Rayleigh surface waves. As long as the Rayleigh surface wave travels along a straight line, we can synthesize two horizontal components into a radial horizontal component d (t), thus transforming the three-component data into two-component data. When the Z-axis is downward, the Rayleigh surface wave rotates counterclockwise along the propagation direction. The horizontal and vertical components are constructed as complex numbers:
The direction of signal propagation can be determined based on the difference between the spoke value of the imaginary part and the difference between the spoke value of the complex number at time t_0 and t_0+h. If this difference is greater than zero, the signal propagates in one direction, and if it is less than zero, it propagates in the opposite direction. The value of h, which represents the time difference, is determined based on the dominant frequency of the wave.
To verify the reliability of the method, numerical simulation, experimental verification, and case data verification were designed. A plane diagram of the homogeneous half-space medium model designed in this study is shown in Figure 12. Figure 12A shows the arrangement of geophones and their sources. The wave field in this experiment was excited by point sources with a total of 11 rows, 21 columns, and 231 geophones arranged. The geophone is 15 m from the source, and a stable Rayleigh surface wave can be formed at the minimum offset. Although there is still a small amount of p-waves, they do not affect the determination of the Rayleigh surface wave propagation direction. Figure 12B shows the direction arrow drawn according to the propagation direction of the Rayleigh surface wave calculated from 231 sets of single-channel, three-component seismic records. Compared with Figures 12A, B, the distribution of the propagation direction is consistent with the case of Rayleigh surface waves spreading from the point source to the outside. This method can determine the propagation direction of Rayleigh waves when there is almost no other wave interference.
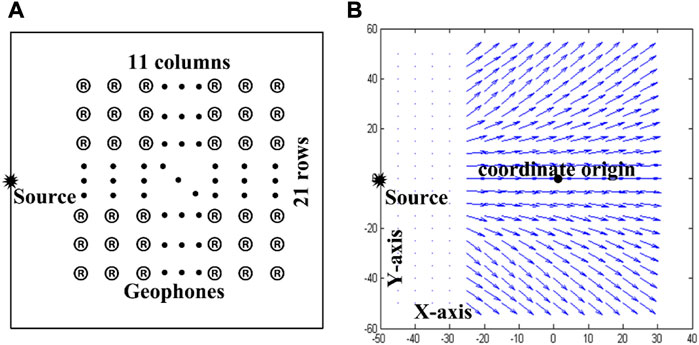
FIGURE 12. (A) shows the geophone and source distribution of the numerical model, and (B) shows the distribution diagram of the Rayleigh wave propagation direction in seismic records.
For microtremor signal data, a Rayleigh surface wave with a strong signal was selected for the experiment. Field data acquisition was based on 11 groups. Eleven groups of three-component seismic records were collected for each group. In this study, nine channels with three-component seismic records were selected. Each data channel intercepts a segment of the signal with a sampling time of 10 s, including a group of Rayleigh surface waves. These nine groups of data contain Rayleigh surface wave signals from the same seismic source, with the same propagation direction.
Figure 13A shows the vertical component seismic record and Figure 13C shows the time-frequency energy distribution of one of the data. The time-frequency distribution of the microtremor seismic record is relatively scattered, and the direct determination of the propagation direction of the wave is interfered with by other waves. According to the energy distribution, the maximum energy point in the time and frequency domains is (2.46 s, 3.7 Hz), and the bandpass filter is carried out with 3.7 Hz as the center to suppress the interference of other waves as much as possible. Figure 11B shows the results of the band-pass filtering in Figure 11A. Finally, the propagation direction of each data point was determined by the propagation direction determination procedure of the wave, and the results are shown in Figure 11D. Taking the positive direction of the x-axis as a reference, the specific angles are 341, 337, 356, 339, 331, 348, 351, 342, and 345. From these results, it can be inferred that the propagation direction of this group of signals is an angle of approximately 20° along the positive direction of the x-and x-axes. Theoretically, the propagation direction of the nine groups of data should be completely consistent. Due to interference from other waves in the signal and inaccuracies in the placement of the three-component detector during data collection, the result deviated somewhat from the theoretical value. In summary, by combining the time-frequency analysis and anti-clockwise rotation characteristics of Rayleigh surface waves, the propagation direction of microtremor Rayleigh surface waves can be effectively identified.
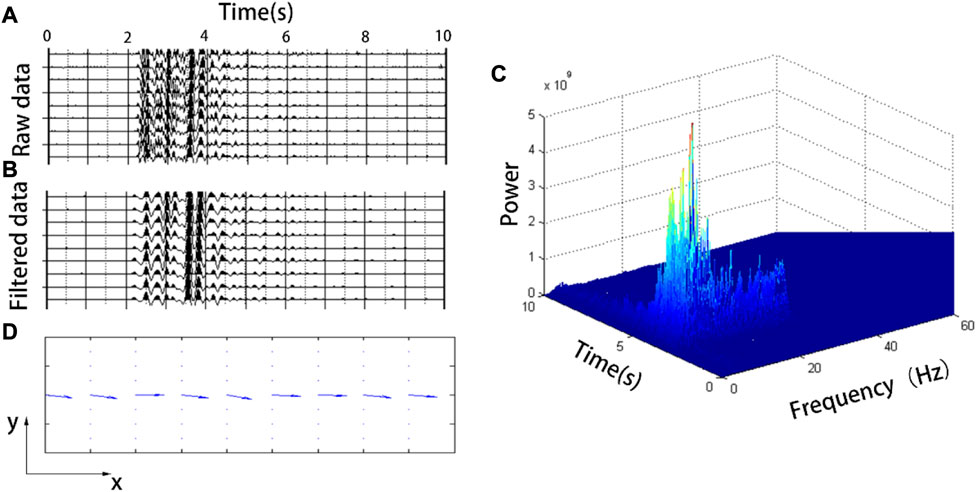
FIGURE 13. (A) shows a three-component microtremor vertical component seismic record dominated by a Rayleigh surface wave. (B) Seismic record after the main frequency filtering of (A); (C) time-frequency distribution diagram of the vertical component in (A, D) directional distribution of the Rayleigh wave.
5 Experimental analysis
The purpose of this study was to extract a high signal-to-noise ratio co-propagating Rayleigh surface wave from the microtremor signal. Based on the research results of the filtering methods analyzed above, a set of high signal-to-noise ratio co-directional Rayleigh surface wave extraction processes for microtremor signals is summarized, and the application effect of this method in seismic wave imaging is verified by taking the elliptical polarizability geological structure imaging method as an example.
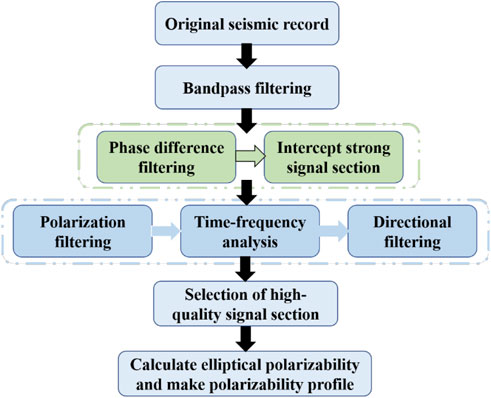
The data processing technology roadmap is shown in Figure 14:
Detailed data processing steps are as follows.
(1) Band-pass filtering: Band-pass filtering is performed on the original seismic records, DC interference is filtered out, and the appropriate frequency band range is selected according to the exploration depth.
(2) Phase difference filtering: Phase difference filtering was performed on all seismic records to remove the strong linear polarization wave signal in the microtremor signal to facilitate the selection of the surface wave dominant signal section.
(3) Intercept the signal segment: According to the phase-difference filtering results, the dominant signal segment of the strong surface wave was initially intercepted from the band-pass filtered signal, and several high-quality signal segments were intercepted from each group of three-component seismic records.
(4) Polarization filtering: Polarization filtering is performed on the preliminarily intercepted surface wave dominant signal to filter the linear polarization interference wave in the signal.
(5) Time-frequency analysis: time-frequency analysis is performed on the filtered signal segment to determine the main components of the signal.
(6) Direction filtering: Identify the propagation direction of Rayleigh surface waves for all processed signal segments according to the results of the signal principal components.
(7) High-quality signal selection: The best signal segment of the Rayleigh surface wave with a high signal-to-noise ratio propagating in the same direction is selected from the signal segments of all seismic channels.
(8) Seismic wave imaging: Calculate the elliptical polarizability of different frequencies of each signal segment and obtain the polarizability profile.
The elliptical polarizability method was used to study the crustal structure using the dynamic characteristics of the elliptical polarization of Rayleigh surface wave particles. The research shows that the elliptical polarizability of particle motion in layered media changes with frequency and can interpret the geological structure in the same way as the velocity dispersion method. However, when the signal is in a non-stationary state, the superposition of linear polarization waves and Rayleigh surface waves in different directions will have an impact on the imaging results and cannot accurately identify the geological structural features. Using the above method of extracting the microtremor Rayleigh surface wave, a co-propagating Rayleigh surface wave with a high signal-to-noise ratio can be extracted from the microtremor signal, which meets the application conditions of the elliptical polarizability method. Therefore, this study uses the elliptical polarizability method and numerical simulation to verify the viability of extracting co-propagating Rayleigh surface waves with high signal-to-noise ratios.
In this study, two plane wave sources with opposite directions are set on the homogeneous half-space model, and then white noise with a noise level of 20% is added to the three-component records by a numerical method. The excitation source simultaneously generates a longitudinal wave and a model boundary reflection body wave to simulate a simple three-component microtremor signal. Figure 15A shows the 40-channel homogeneous model vertical component seismic records, with a sampling frequency of 0.0005, sampling duration of 2 s, sampling interval of 2 m, and dominant frequency of 20 Hz. Seismic records include longitudinal waves, model boundary reflector waves, Rayleigh surface waves in different propagation directions, and noise. The simulated signals should be used as far as possible to restore the characteristics of the micromotion signals.
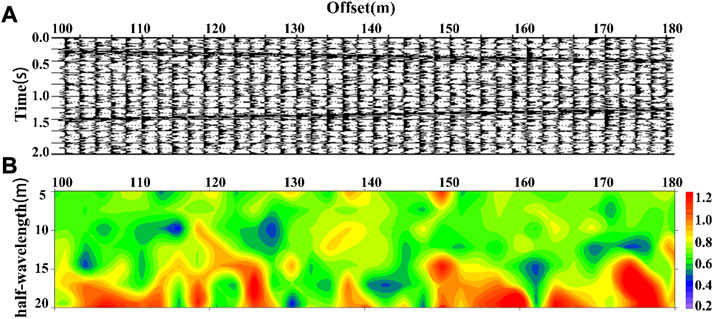
FIGURE 15. (A) Vertical component of the original synthetic seismic record, and (B) vertical slice of the estimated ellipticity at an apparent depth of 0.5λ.
Figure 15B shows the elliptical polarizability profile, where the exploration depth is converted from a half-wavelength. The polarizability profile was calculated directly from the 40-channel unprocessed simulated three-component seismic records of micromotion. From the figure, we can clearly see many abnormal areas with high and low elliptical polarizabilities. The data were derived from a uniform half-space model. According to the calculation of the model parameters, the theoretical elliptical polarizability value of each frequency is 0.654 when the Rayleigh surface wave propagates in a homogeneous medium. Due to various interference factors present in the signal, the polarizability profile does not accurately reflect the characteristics of the homogeneous model. This shows that the geological structure information cannot be accurately extracted from the unprocessed non-stationary micromotion signals using the Rayleigh surface wave elliptic polarizability method.
For an experimental comparison, we applied the high signal-to-noise ratio co-directional microtremor Rayleigh surface wave extraction method summarized above to the simulation data. The detailed data processing process and parameters are as follows.
(1) Band-pass filtering: 20 Hz as the frequency center
(2) Phase difference filtering: Phase difference filtering was performed on all simulated micromotion seismic records, and then the region of the strong amplitude Rayleigh surface wave in each seismic record was determined.
(3) Intercept signal segments: and initially intercept all strong surface wave dominant signal segments with a duration of 0.2 s from the band-pass filtered signal;
(4) Polarization filtering: the filtering parameter of polarization filtering for all intercepted surface wave dominant signals is set to 0.3 to filter the linear polarization interference wave in the signal.
(5) Time-frequency analysis: time-frequency analysis is performed on the filtered signal segment to determine the main components of the signal.
(6) Direction filtering: The propagation direction of the Rayleigh surface wave in the signal segment is identified according to the principal component.
(7) High-quality signal selection: Select the best signal segment of the Rayleigh surface wave with high SNR in the same direction from each signal segment and select 40 groups of Rayleigh surface wave signals with 0.2 s in the same direction.
(8) Seismic wave imaging: Calculate the elliptical polarizability of different frequencies of each signal segment and obtain the polarizability profile.
The processing results are shown in Figure 16:
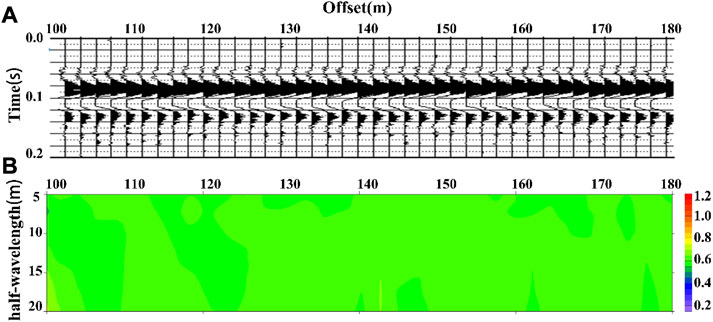
FIGURE 16. (A) is the processed synthetic vertical component seismic record and (B) is the vertical slice of the estimated ellipticity at an apparent depth of 0.5λ.
The processed seismic record is shown in Figure 16A., which is the vertical component seismic record of the same direction propagation Rayleigh wave with a sampling time of 0.2 s; it can be seen from the seismic records that after a series of processing, the signal only contains a set of Rayleigh surface waves, and the strong linear polarization wave and white noise are filtered, resulting in a relatively clear surface wave waveform. Figure 16B shows the elliptical polarizability profile. It can be clearly seen from the profile that the polarizability is approximately the theoretical value of 0.654, which clearly reflects the uniform characteristics of the model.
The comparative test results in Figures 15B, 16B Show that the combination of elliptical polarizability waves, phase difference filtering, time-frequency analysis, and directional filtering can extract a high signal-to-noise ratio co-directional Rayleigh surface wave from the complex components of the micromotion signal, effectively improving the imaging accuracy of the micro-motion Rayleigh surface wave elliptical polarizability method. In the future, our goal is to extend the use of this method to real-world data and integrate it with other seismic wave imaging techniques, thereby expanding the utilization of micromotion signals in seismic wave exploration.
6 Conclusion
In this study, the study focuses on extracting a high signal-to-noise ratio Rayleigh surface wave from microtremor signals through numerical simulation data and site data, with the aim of improving the imaging accuracy of the microtremor Rayleigh surface wave exploration method. The conclusions of this study are as follows:
First, polarization filtering and phase-difference filtering methods were studied, and the two filtering methods were applied to the simulation data and site data. Both filtering methods were found to effectively eliminate the linear polarization wave in the signal, but the polarization filtering is highly dependent on the amplitude, the operation time is long, and the filtering effect is better than that of phase difference filtering. The phase-difference filtering method does not consider the amplitude strength and can filter without knowing the propagation direction of the wave, but the low-amplitude Rayleigh wave signal will cause significant interference, and the disturbance caused by the local abnormal body is more likely to cause distortion. The two filtering methods can be applied at different stages of microtremor Rayleigh wave extraction, considering their advantages and disadvantages.
Second, the Rayleigh wave propagation direction was identified. The non-stationary microtremor signals were studied using a time-frequency analysis method, and the principal component information was extracted from the signal segments. The simulation data and field data experimental results show that this method can effectively improve the accuracy of data analysis and accurately extract the principal component information of the data. At the same time, combined with the principal component information of the signal and the anti-clockwise rotation characteristics of Rayleigh surface wave, the method for identifying the propagation direction of Rayleigh surface waves was studied. The results show that the method can effectively identify the propagation direction of Rayleigh surface waves from single-point three-component seismic records, both simulated and site data.
Finally, the data extraction process of high-SNR co-directional Rayleigh surface waves from microtremor signals is summarized and applied. Based on the filtering method results, a summary of the extraction process for high-SNR co-directional Rayleigh surface waves from microtremor signals is provided. By comparing the imaging results before and after data processing, it was found that using this method to extract Rayleigh surface waves can effectively improve the accuracy of the polarizability profile. Furthermore, the research results can broaden the application scope of the Rayleigh surface wave exploration method and provide a reference for future research on microtremor seismic wave exploration. It has broad application prospects in large-scale crustal research and small-scale engineering geophysical exploration.
Data availability statement
The raw data supporting the conclusion of this article will be made available by the authors, without undue reservation.
Author contributions
Conceptualization, QD; data curation, YP; formal analysis, QD; investigation, QD; methodology, QD; project administration, QD; software, YP; supervision, YX; validation, YP; visualization, QD; and YP writing—original draft, QD and YP. All authors have read and agreed to the published version of the manuscript.
Conflict of interest
The authors declare that the research was conducted in the absence of any commercial or financial relationships that could be construed as a potential conflict of interest.
Publisher’s note
All claims expressed in this article are solely those of the authors and do not necessarily represent those of their affiliated organizations, or those of the publisher, the editors and the reviewers. Any product that may be evaluated in this article, or claim that may be made by its manufacturer, is not guaranteed or endorsed by the publisher.
References
1. Konno K, Ohmachi T. Ground-motion characteristics estimated from spectral ratio between horizontal and vertical components of microtremor[J]. Bull Soc Am (1998) 88(1):228–41.
2. Tokimatsu K, Arai H, Asaka Y. Deep shera-wave structure and earthquake ground motion characteristics in Sumiyoshi area, Kobe city, based on microtremor measurements[J]. J Struct Constr Engng AIJ (1997) 491:37–45. (in Japanese).
3. Nakamura Y. On the H/V spectrum[C]. In: The the 14th world conference on earthquake engineering; October, 2008; Beijing, china (2008).
4. Arai H, Tokimatsu K. Effects of Rayleigh and Love waves on microtremors H/V spectra[C]. In: Proc. 12th World Conf. on Earthquake Engineering (2000). p. 2232. CD-ROM.
5. Thomson WT. Transmission of elastic waves through a stratified solid medium. J Appl Phys (1950) 21:89–93. doi:10.1063/1.1699629
7. Sakaji K. Temporal variation of the power spectra of microtremors observed at soil and rock site[C]. Graduation thesis. Sapporo, Japan: Hokkaido University (1998). (in Japanese).
8. Aki K. Space and time spectra of stationary stochastic waves, with special reference to microtremors[J]. Bull Earthq Res Inst (1957) 35:415–56.
9. Aki K. A note on the use of microseisms in determining the shallow structures of the earth’s crust. Geophysics (1965) 30(4):665–6. doi:10.1190/1.1439640
10. Capon J. High-resolution frequency-wavenumber spectrum analysis. Proc IEEE (1969) 57(8):1408–18. doi:10.1109/proc.1969.7278
11. Claerbout JF. Synthesis of a layered medium from its acoustic transmission response[J]. Geophysics (1968) 33(2):264–9. doi:10.1190/1.1439927
12. Boore DM, Toksöz MN. Rayleigh wave particle motion and crustal structure[J]. Bull Seismol Soc Am (1969) 59(1):331–46.
13. Nakamura Y. A method for dynamic characteristics estimation of subsurface using microtremors on the ground surface[J]. Q.Rept RTRI Jpn (1989) 30:25–33.
14. Toksöz MN. Microseisms and an attempted application to exploration[J]. Geophysics (1964) 29(2):154–77. doi:10.1190/1.1439344
15. Okada H, Suto K. The microtremor survey method[M]. Houston, Texas, USA: Society of Exploration Geophysicists (2003). p. 1–53.
16. Du Q, Liu Z, Liu S. Analysis of influencing factors and numerical simulation of horizontal-to-vertical spectral ratio method[J]. J Earthquake Tsunami (2019) 14(1):2050004.
17. Du Q, Liu Z, Liu S, Zhang L, Yu W. A study of the lateral heterogeneity with the ellipticity of Rayleigh waves derived from microtremors. Geophys J Int (2021) 225(3):2020–34. doi:10.1093/gji/ggab075
18. Shi Y, Zhang W, Wang Y. Seismic elastic RTM with vector-wavefield decomposition. J Geophys Eng (2019) 16(3):509–24. doi:10.1093/jge/gxz023
19. Wang WH, Zhang W, Shi Y, Ke X. Elastic reverse time migration based on wavefield separation[J]. Chin J. Geophys. (2017) 60(7):2813–24. (in Chinese).
20. Wei Y, Li YE, Yang J, Zong J, Fang J, Fu H. Multi-task learning based P/S wave separation and reverse time migration for VSP[J]. SEG Tech Program Expanded Abstr (2020) 2020:1671–5.
21. Devaney A, Oristaglio M. A plane-wave decomposition for elastic wave fields applied to the separation of P-waves and S-waves in vector seismic data. Geophysics (1986) 51(2):419–23. doi:10.1190/1.1442102
22. Stoffa PL, Buhl P, Diebold JB, Wenzel F. Direct mapping of seismic data to the domain of intercept time and ray parameter—a plane-wave decomposition. Geophysics (1981) 46(3):255–67. doi:10.1190/1.1441197
23. Beylkin G. Discrete radon transform[J]. Acoust IEEE Trans Speech Signal Process (1987) 35(2):162–02.
24. Shimshoni M, Smith SW. Seismic signal enhancement with three-component detectors. Geophysics (1964) 29(5):664–71. doi:10.1190/1.1439402
25. Gan S, Wang S, Chen Y, Chen X, Xiang K. Separation of simultaneous sources using a structural-oriented median filter in the flattened dimension. Comput Geosciences (2016) 86:46–54. doi:10.1016/j.cageo.2015.10.001
26. Chen Y. Deblending using a space-varying median filter[J]. Exploration Geophys (2015) 46(4):5183.
27. Chen Y, Fomel S. Random noise attenuation using local signal-and-noise orthogonalization. Geophysics (2015) 80(6):1–9. doi:10.1190/geo2014-0227.1
28. Zu S, Cao J, Qu S, Chen Y. Iterative deblending for simultaneous source data using the deep neural network. Geophysics (2020) 85(2):V131–41. doi:10.1190/geo2019-0319.1
29. Dellinger J, Etgen J. Wave-field separation in two-dimensional anisotropic media. Geophysics (1990) 55(7):914–9. doi:10.1190/1.1442906
30. Sun R, Mcmechan GA, Hsiao HH, Chow J. Separating P- and S-waves in prestack 3D elastic seismograms using divergence and curl. Geophysics (2004) 69(1):286–97. doi:10.1190/1.1649396
31. Hu TY, Hong F, Wang RQ, Li G, Wen S. Multiple attenuation using beamforming onshore and offshore China. The Leading Edge (2002) 21(9):906–10. doi:10.1190/1.1508949
32. Hong F, Hu T, Wang R. Target multiple attenuation using 3D beamforming[C]. In: The 73th SEG Annual Meeting, Expanded Abstracts (2003). p. 1969–72.
33. Trad D, Ulrych T, Sacchi M. Accurate interpolation with high-resolution time-variant Radon transforms. Geophysics (2002) 67:644–56. doi:10.1190/1.1468626
34. Ville J. Théorie et. Application de la notion de signal analytique[J]. Câbles et Transmissions 2eA (1948) 1948:61–74.
35. René RM, Fitter JL, Forsyth PM, Kim KY, Murray DJ, Walters JK, et al. Multicomponent seismic studies using complex trace analysis. Geophysics (1986) 51:1235–51. doi:10.1190/1.1442177
36. Chen L, Lian H, Xu Y, Li S, Liu Z, Atroshchenko E, et al. Generalized isogeometric boundary element method for uncertainty analysis of time-harmonic wave propagation in infinite domains. Appl Math Model (2023) 114:360–78. doi:10.1016/j.apm.2022.09.030
37. Chen L, Cheng R, Li S, Lian H, Zheng C, Bordas SPA. A sample-efficient deep learning method for multivariate uncertainty qualification of acoustic–vibration interaction problems. Comput Methods Appl Mech Eng (2022) 393:114784. doi:10.1016/j.cma.2022.114784
38. Chen L, Lian H, Natarajan S, Zhao W, Chen X, Bordas SPA. Multi-frequency acoustic topology optimization of sound-absorption materials with isogeometric boundary element methods accelerated by frequency-decoupling and model order reduction techniques. Comput Methods Appl Mech Eng (2022) 395:114997. doi:10.1016/j.cma.2022.114997
39. Chen L, Lian H, Liu Z, Chen H, Atroshchenko E, Bordas S. Structural shape optimization of three dimensional acoustic problems with isogeometric boundary element methods. Comput Methods Appl Mech Eng (2019) 355:926–51. doi:10.1016/j.cma.2019.06.012
40. Chen L, Lu C, Lian H, Liu Z, Zhao W, Li S, et al. Acoustic topology optimization of sound absorbing materials directly from subdivision surfaces with isogeometric boundary element methods. Comput Methods Appl Mech Eng (2020) 362:112806. doi:10.1016/j.cma.2019.112806
Keywords: microtremors, Rayleigh wave, numerical simulation, elliptical polarizability, filtering method
Citation: Du Q, Pan Y and Xin Y (2023) Research and application of Rayleigh wave extraction method based on microtremors signal analysis. Front. Phys. 11:1158049. doi: 10.3389/fphy.2023.1158049
Received: 03 February 2023; Accepted: 14 February 2023;
Published: 22 February 2023.
Edited by:
Pei Li, Xi’an Jiaotong University, ChinaReviewed by:
Lijuan Sun, Jilin Jianzhu University, ChinaBaoliang Wang, Yellow River Engineering Consulting Co., Ltd, China
Copyright © 2023 Du, Pan and Xin. This is an open-access article distributed under the terms of the Creative Commons Attribution License (CC BY). The use, distribution or reproduction in other forums is permitted, provided the original author(s) and the copyright owner(s) are credited and that the original publication in this journal is cited, in accordance with accepted academic practice. No use, distribution or reproduction is permitted which does not comply with these terms.
*Correspondence: Qingling Du, ZHVxaW5nbGluZ0BodWFuZ2h1YWkuZWR1LmNu
 Qingling Du
 Yanhui Pan1