 Lukas Goett-Zink
 Eileen Baum1
 Tilman Kottke
94% of researchers rate our articles as excellent or good
Learn more about the work of our research integrity team to safeguard the quality of each article we publish.
Find out more
ORIGINAL RESEARCH article
Front. Phys., 16 March 2023
Sec. Biophysics
Volume 11 - 2023 | https://doi.org/10.3389/fphy.2023.1150671
Aureochromes are light, oxygen, voltage (LOV) proteins and central blue-light receptors in algae acting as light-gated transcription factors. The C-terminal LOV domain mediates blue-light recognition and the basic region leucine zipper (bZIP) domain binds a specific DNA motif as effector. LOV domains from aureochromes have been successfully applied in optogenetic tools. The light-induced response of aureochromes has been studied by a variety of biophysical techniques, but the mechanism of signal progression from LOV to bZIP remains unclear. We studied the bZIP-LOV module of aureochrome1a from the diatom Phaeodactylum tricornutum using time-resolved rapid-scan FTIR difference spectroscopy. Time-resolved difference spectra of bZIP-LOV in vitro revealed a time constant of 5 s for the formation of a light state dimer of the LOV domains and the concomitant loss of α-helical elements in the bZIP domain. To verify these observations in a near-native environment, in-cell infrared difference spectroscopy (ICIRD) was extended from a steady state to a time-resolved technique using LOV domains in bacterial cells. We established a time-resolved in-cell method with a resolution of 7.6 ms after the laser pulse. Using this technique, the response of bZIP-LOV was followed in living bacterial cells and the light-induced partial unfolding of bZIP was confirmed to take place in cells in a similar time range as in vitro. These results provide structural and kinetic insights into the signaling mechanism of aureochromes. The slow response points to an association of LOV to bZIP in the dark state prior to activation.
Light sensing of various organisms is mediated by photoreceptors as the first step for an appropriate response to light exposure. A large variety of photoreceptor families has been found that cover a broad spectral range for light sensing [1]. Light oxygen, voltage (LOV) proteins are blue-light receptors in bacteria, fungi, algae and plants regulating cellular responses such as phototropism, the circadian clock or carotenoid synthesis [2–5]. In LOV, the non-covalently bound flavin mononucleotide (FMN) reacts upon blue-light illumination with a nearby located cysteine to the FMN adduct that represents the signaling state [6]. The FMN adduct then thermally converts back to the dark state within seconds to minutes (Figure 1A) [7–9]. Phototropins were the first members of the LOV protein family identified in plants [10] and contain two LOV domains, LOV1, and LOV2, regulating the activity of a C-terminal kinase. Later, aureochromes were found in algae comprising a less common inverted arrangement, in which the basic-region leucine zipper (bZIP) is located N-terminal to the C-terminal LOV domain (Figure 1B) [11]. Aureochromes are blue-light regulated transcription factors by increasing the affinity to the target DNA after activation and mediate photomorphogenesis, high-light acclimation and cell division in algae [11–14].
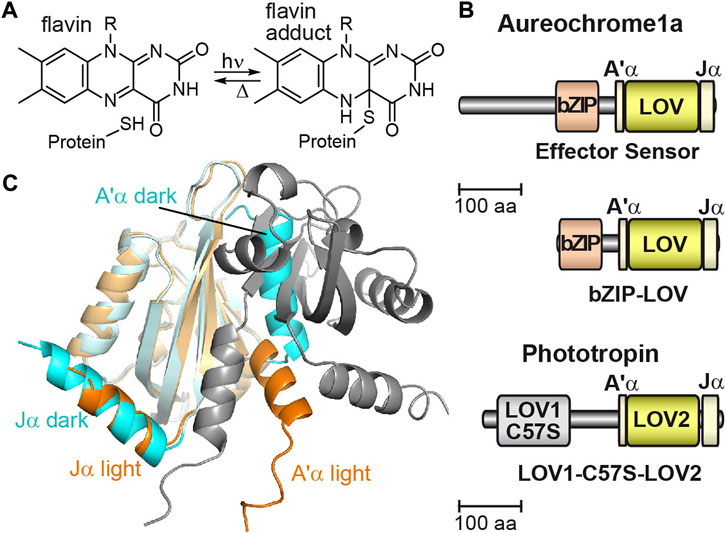
FIGURE 1. The flavin photoreaction in LOV domains, the domain architecture of aureochrome and phototropin, and the crystal structure of the aureochrome LOV domain. (A) In LOV proteins, the non-covalently bound flavin mononucleotide (FMN) reacts with a nearby located cysteine to the FMN adduct upon illumination. (B) The domain architecture of aureochrome is inverted compared to phototropin with an N-terminal bZIP effector domain and a C-terminal LOV domain. Phototropin possesses two sensory domains, LOV1 and LOV2, at the N-terminus and a C-terminal kinase as effector domain. Mutation of cysteine to serine in LOV1 (C57S) abolishes photoactivity. (C) The monomeric crystal structure of LOV from PtAureo1a in the dark (PDB: 5a8b, cyan) shows association of the A’α helix to the β-sheet blocking the dimerization surface. Upon illumination, the Jα helix partially unfolds, which results in the release and partial unfolding of the A’α helix enabling dimerization of two light state LOV domains (PDB: 5dkl, orange, and grey).
The LOV core of aureochreome1a from the diatom Phaeodactylum tricornutum (PtAureo1a) is flanked by two helices, Jα and A’α, of which the A’α helix is associated to the β-sheet surface of the LOV core (Figures 1B, C) [15,16]. Formation of the FMN adduct leads to a partial unfolding of the Jα helix [17,18] as it was observed before in phototropin LOV2 [19]. Subsequent allosteric regulation in PtAureo1a causes the reorientation and partial unfolding of the A’α helix in vitro enabling an access to the β-sheet for formation of the light state dimer of two LOV domains [18,20]. Activation of the LOV sensor leads to a signal progression to the effector bZIP with a time constant of 160 ms as observed by transient grating spectroscopy on aureochrome1 from Vaucheria frigida (VfAureo1) [21]. Photoactivation of bZIP-LOV of PtAureo1a results in a partial helical unfolding of the bZIP domain in the absence of DNA, whereas the helicity of the bZIP domain is extended in the presence of DNA, as detected by infrared difference spectroscopy [22] and hydrogen/deuterium exchange mass spectrometry [18].
The photoreaction and the structural response of LOV as well as of bZIP-LOV from aureochromes has been studied in detail, but the signal progression from LOV to bZIP is still a topic of debate. Three contradictory mechanisms have been proposed. For VfAureo1, bZIP-LOV is present as a monomer that dimerizes upon illumination [23]. For PtAureo1a, each LOV domain is either associated to a dimeric bZIP in the dark state [18], or both LOV and bZIP domains form homodimers [22]. Resolving this question is not only of importance for our understanding of the signaling mechanism of light-gated transcription factors but may also be relevant for the design of new optogenetic tools. LOV domains of aureochromes have been successfully applied as optogenetic tools, for instance for the dimerization of tyrosine kinases in human cancer cell lines [24–26].
Time-resolved experiments on aureochromes so far have been limited to UV/vis and fluorescence spectroscopy, small angle x-ray scattering (SAXS) and transient grating spectroscopy [18,21–23,27], which do not provide any detailed structural information on the protein moiety. Moreover, these studies have been performed under in vitro conditions differing substantially from those in a cellular environment. Recently, we developed in-cell infrared difference (ICIRD) spectroscopy to study the light-induced changes in structure of chromophore, side chains and secondary structure of soluble photoreceptors in living E. coli cells and therefore in a near-native environment with a receptor copy number per cell of ∼300,000 [28]. We found that the A’α helix of LOV from PtAureo1a does not unfold under cellular conditions in contrast to in vitro experiments but rearranges instead in its folded state.
To date, studies with in-cell infrared difference spectroscopy have been very rare. The membrane receptor rhodopsin was investigated using synchrotron radiation [29] and the catalytic center of hydrogenase was studied by in-cell gas exchange [30]. Here, we extended the ICIRD spectroscopy from a steady-state to a time-resolved method using the rapid-scan technique. Time-resolved ICIRD spectroscopy was first established on the model photoreceptor LOV1-C57S-LOV2 of phototropin from Chlamydomonas reinhardtii (CrPhot) and then applied to the bZIP-LOV of PtAureo1a. We studied the signal progression of the LOV sensor domain to the bZIP effector domain in vitro and in cells using the rapid-scan technique. We observed changes in secondary structural elements on the second time scale providing new structural insights into the mechanism of signal progression of aureochromes.
bZIP-A’α-LOV-Jα (bZIP-LOV, amino acids 145–378) of PtAureo1a was expressed with an N-terminal His6 tag in E. coli BL21 (DE3) using an pET28a (+) vector [22]. LOV1-C57S-A’α-LOV2-Jα (LOV1-C57S-LOV2, amino acids 16–363) of CrPhot was expressed with an N-terminal His12 tag in E. coli BL21 (DE3) or Origami B (DE3) cells using a modified pMALc2x vector [31]. The cells were cultivated at 37°C and 120 rpm in DYT medium up to an OD600 of 0.5 and were then cooled to 18°C. At an OD600 of 0.8, protein expression was induced by addition of 10 µM isopropyl-β-d-thiogalactopyranoside and performed for 20 h in the dark. For ICIRD experiments, the cells were washed twice with a saline solution (150 mM NaCl and 5 mM KCl) and concentrated to an OD600 of ∼200–300 as described previously [28].
Purification of bZIP-LOV was done as described previously [22]. bZIP-LOV was obtained in 50 mM phosphate buffer, pH 8, 20% (v/v) glycerol, 300 mM NaCl. For FTIR spectroscopic experiments the protein was washed with 50 mM phosphate buffer, pH 8, 300 mM NaCl and concentrated to 1.54 mM.
The rapid-scan FTIR difference experiments were performed on a Bruker IFS 66/S spectrometer with a long pass filter with a cut off at 2050 cm−1 in front of the mercury cadmium telluride detector. The filter was used to protect the detector from stray light and to increase the signal-to-noise ratio. Intensity spectra were recorded at 25°C with a scanner velocity of 320 kHz and a spectral resolution of 4 cm−1. The FT was performed with a zero filling factor of 4. For time-resolved ICIRD spectroscopy, the E. coli cells were prepared, and ∼2 µl of the cells were placed between two BaF2 windows without any spacer and sealed with grease as described previously [28]. For FTIR difference spectroscopy in vitro, ∼2 µl of 1.54 mM bZIP-LOV in 50 mM phosphate buffer, pH 8, 300 mM NaCl was placed between the BaF2 windows. The path length of the sandwich cuvettes with both, cells and in vitro samples, was adjusted via the pressure applied during preparation to reach an absorbance of 0.8–1.1 at 1650 cm−1. It should be noted that in the gentle preparation of E. coli cells and in vitro samples, any drying or film formation was avoided.
Seven samples were mounted in a home-built sample changer. The sample was rotated into the IR beam of the spectrometer by a stepper motor (Nema 14, 0.1 Nm, 0.4 mA) with a L298N motor driver controlled by a RaspberryPi 3B+ with an obstacle avoidance IR sensor. Before illumination, 64 scans of background intensities (Idark) of the sample were recorded. Then, a TTL pulse from the FTIR spectrometer triggered a pulse from the Nd:YAG laser (wavelength 355 nm; pulse width 10 ns, Quantel Ultra 100). The beam diameter of the laser was enlarged with a dispersing lens (focal length −250 mm, distance to sample 120 cm), to ensure a homogeneous illumination of the sample, resulting in energy densities of approximately 1–1.5 mJ/cm2 for bZIP-LOV or 0.6–1 mJ/cm2 for LOV1-C57S-LOV2 at the sample. The TTL pulse from the spectrometer was delayed by 97.5 ms by a pulse generator (DG535, Stanford Research Systems) to compensate for the void time of the interferometer during the mirror inversion, thereby increasing the time resolution of the first scan to 7.6 ms. After excitation, a series of 254 scans of sample intensities (Iilluminated) was recorded with the sequence 1, 1, 4, 8, 16, 32, 64, 64, and 64 scans. Scans were splitted into the forward/backward and single sided motions of the interferogram. After the measurement, the sample changer rotated the next sample into the IR beam. For sample recovery, the time in the dark of a full rotation between two excitations of the same sample was set to 2,160 s for bZIP-LOV in vitro, 3,605 s for bZIP-LOV in cells and 350 s for LOV1-C57S-LOV2 in cells. Difference absorbance spectra were calculated using a python script according to Eq. 1.
Representative spectra of multiple independent preparations of seven samples were averaged resulting in a total number of 147 measurements for the first scan of bZIP-LOV in vitro, 840 measurements for the first scan of bZIP-LOV in cells and 10,500 measurements for the first scan of LOV1-C57S-LOV2 in cells. For LOV1-C57S-LOV2, difference spectra with ΔA > |±0.00027| in the range of 1800 to 1200 cm−1 were discarded from averaging by the script to filter out artifacts in the early spectra. Analysis of individual signals was performed in OriginPro 2020 using the Multi-Data Fit Mode and a monoexponential fit with shared time constants. To reduce noise, the mean absorbance of individual bands in a given wavenumber interval was calculated for analysis. Global fit analysis of the full spectral range (1800–1200 cm−1) was performed using MATLAB (The Mathworks) [32]. A spectrally non-weighted global fit with a kinetic model of sequential first order reactions with three intermediates was applied (Supplementary Figure S1A).
To follow the signal progression from the LOV sensor to the bZIP effector after blue-light absorption, we recorded time-resolved FTIR difference spectra of bZIP-LOV from PtAureo1a using the rapid-scan approach. A challenge was the long recovery after excitation with a time constant of the flavin adduct of τ = 1,560 s at 20°C [22], which prevents the necessary averaging. Therefore, a sample changer was implemented in the FTIR spectrometer for the mounting of seven sandwich cuvettes (Figure 2). The sample was exchanged in between the experiments leading to a dark time for recovery of 36 min between two excitations of the same sample.
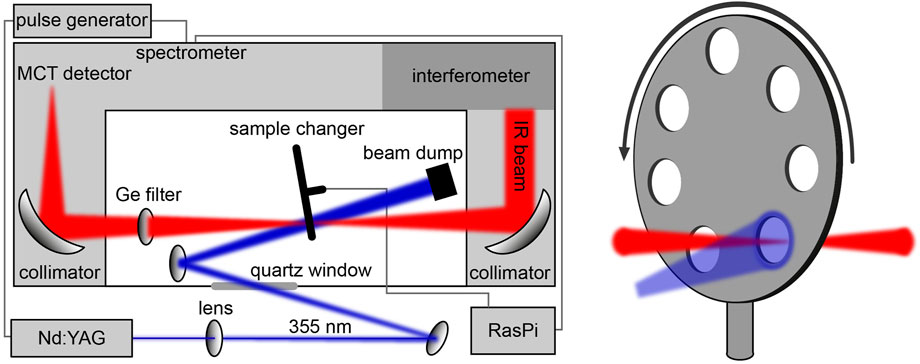
FIGURE 2. Schematic illustration of the setup for time-resolved rapid-scan FTIR difference experiments. A home-built sample changer controlled by an RaspberryPi (RasPi) was implemented in the spectrometer for the automated measurement of seven samples. TTL pulses from the spectrometer triggering the Nd:YAG laser were delayed by a pulse generator to synchronize the excitation with the onset of the data acquisition by the interferometer.
Time-resolved difference spectra of bZIP-LOV from 102 ms to 15 s were obtained by recording intensity spectra before and after excitation with a 10 ns laser pulse at 355 nm. Most signals remained constant in this time range and are attributed to the photoconversion of flavin to the adduct in LOV. Characteristic bands of flavin were observed at 1727 (+), 1713 (−), 1425 (+), 1271 (−) and 1250 (−) cm−1 (Figure 3A) [33,34]. Other signals show a strong increase in intensity on the time scale of seconds and finally converge with the steady-state spectrum. The time-resolved difference spectrum at 102 ms reveals far less pronounced signals in the spectral region of amide I (1695–1615 cm−1) and amide II (1570–1520 cm−1) compared to the steady-state spectrum of bZIP-LOV. These differences point to changes in secondary structure elements of bZIP-LOV during the experimental time window. Previously, the prominent negative band at 1644 (−) cm−1 in the steady state has been assigned to comprise an α-helical unfolding of the bZIP-linker and unfolding of the Jα-helix of LOV [17,20,35]. The signal at 1630 (+) cm−1 has been assigned to the reorganization of β-sheet of the LOV domains by formation of the light state LOV dimer. This assignment was achieved by correlation to results from size exclusion chromatography on LOV variants [20]. Changes at 1667 cm−1 have been assigned to a response in turn structural elements in the bZIP region by comparison to the difference spectrum of the isolated LOV domain [22].
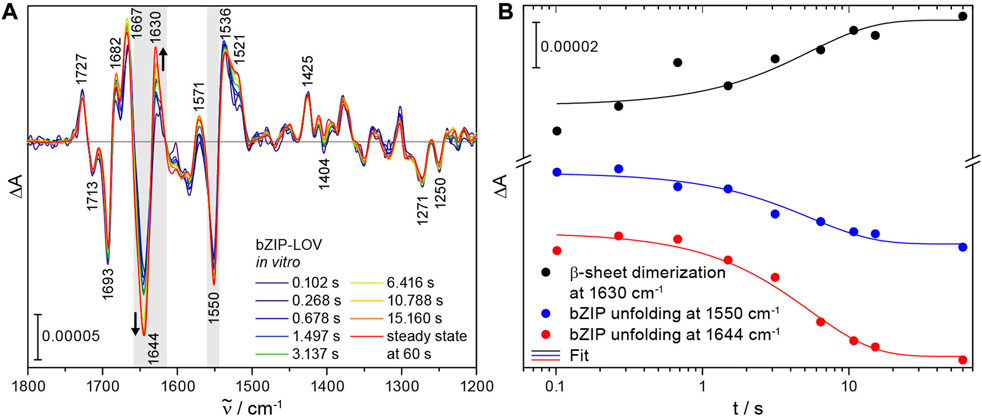
FIGURE 3. Time-resolved FTIR difference spectra of bZIP-LOV from PtAureo1a and kinetics of selected secondary structure elements highlighted in gray. (A) The series of difference spectra after laser excitation at 355 nm shows distinct changes in secondary structure elements at 1644 (−) cm−1 and 1630 (+) cm−1 in the millisecond to second time range. For comparison, a steady-state spectrum was taken from [22] and scaled at 1727 cm−1. (B) Kinetic analysis was performed of the characteristic signals at 1630 (+) cm−1 (mean absorbance from 1632 to 1622 cm−1) and 1644 (−) cm−1 (mean absorbance from 1647 to 1636 cm−1) assigned to formation of the light state dimer of LOV via β-sheet dimerization and to α-helix unfolding of the bZIP, respectively. The partial unfolding of bZIP is also observed in the corresponding amide II region at 1550 cm−1 (mean absorbance from 1553 to 1545 cm−1). A monoexponential global fit reveals a time constant of τ = 5 (± 1) s for β-sheet dimerization and bZIP unfolding.
Fitting the kinetics with a monoexponential function revealed a shared time constant of τ = 5 (±1) s for the unfolding of the bZIP linker at 1644 cm−1 and its corresponding signal in the amide II region at 1550 cm−1 as well as for the formation of the light state LOV dimer at 1630 cm−1 (Figure 3B). A monoexponential fit was used for describing the kinetics because bZIP-LOV is present as a dimer in solution in the dark and the light [22] and therefore the processes were not expected to be concentration-dependent. A global analysis of the full spectral region (1800–1200 cm−1) with a kinetic model of sequential first order reactions (Supplementary Figure S1A) supports the previous analysis with a global time constant of τ = 5.4 s (Supplementary Figures S1B, C). The processes observed by rapid-scan FTIR are much slower than the unfolding of the Jα helix in LOV with 10 μs and ∼200 µs as demonstrated by time-resolved IR spectroscopy [36]. We conclude that the changes at 1644 cm−1 reflect restructuring of helices in bZIP-linker without any contributions by Jα unfolding of LOV. The time constant of the unfolding of bZIP determined with rapid-scan FTIR is slower by almost a factor of 50 than reported by transient grating spectroscopy for bZIP-linker restructuring [21]. The global analysis indicates the presence of an additional fast process in the millisecond time range with τ ∼ 100 ms (Supplementary Figure S1C). This process includes some changes at the β-sheet in the LOV core decoupled from the later light dimer formation and unfolding of the bZIP.
Next, we aimed to verify our observations under near-native conditions in cells. We recently established the in-cell infrared difference (ICIRD) spectroscopy to study the blue-light response of bZIP-LOV in the steady state. Here, we aimed to extend the application of ICIRD spectroscopy to a time-resolved method by applying the rapid-scan technique. However, bZIP-LOV from PtAureo1a takes hours to recover back to the dark form [22] and is accordingly an unsuitable system for method development. We resorted to LOV1-C57S-LOV2 from Chlamydomonas reinhardtii phototropin (CrPhot) as a model, because the protein resembles bZIP-LOV in domain topology comprising an inactivated LOV1 domain instead of bZIP. LOV1-C57S-LOV2 represents a suitable sample for rapid scan, because of its faster adduct decay in the time range of minutes and the available steady-state FTIR difference spectrum from in vitro experiments [31]. We investigated the adduct decay of LOV1-C57S-LOV2 in E. coli cells with fluorescence spectroscopy (Supplementary Figure S2). Fitting the fluorescence recovery with a monoexponential function yielded τ = 473 (±60) s in cells.
LOV1-C57S-LOV2 was expressed in E. coli and the cells were washed, concentrated and placed in a sandwich cuvette. Time-resolved difference absorbance spectra were obtained by recording 64 scans before and a series of scans after excitation by the laser pulse. Afterwards, the sample was moved by the sample changer. The time resolution was maximized by splitting the interferogram into single-sided forward and backward motions and by synchronizing the start of each data acquisition with the laser pulse. With this time-resolved ICIRD approach, we achieved a time resolution of 7.6 ms. The first difference spectrum already showed characteristic signals of the photoreaction of LOV1-C57S-LOV2 (Figure 4A).
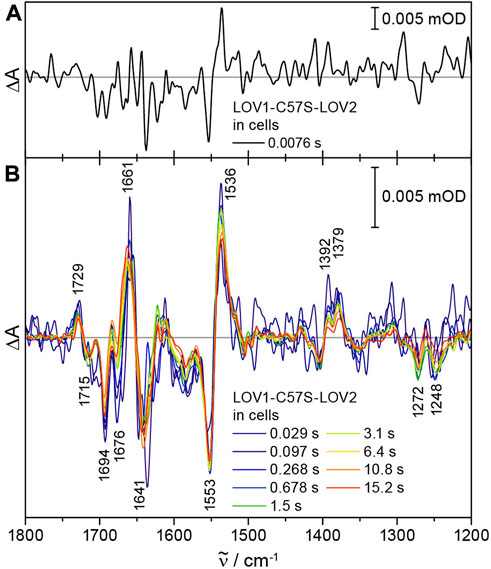
FIGURE 4. Time-resolved ICIRD spectra on the model protein LOV1-C57S-LOV2 from CrPhot in E. coli cells. (A) At 7.6 ms, characteristic signals of the photoreaction are already resolved. (B) The difference spectra after laser excitation show changes in secondary structure elements at 1676 (−) cm−1 and the adduct decay in the millisecond and second time range, respectively.
The difference spectra of LOV1-C57S-LOV2 in cells showed all characteristic signals assigned to the flavin adduct formation in LOV2, as introduced above [33,34] (Figure 4B). Light-induced structural changes are detected in the amide I region, in which the prominent signal at 1641 (−) cm−1 was attributed to the unfolding of the Jα helix in LOV2 [31]. The analysis of the time-resolved spectra was complicated by an admixture of flavin radical formation in LOV1-C57S [37]. UV-vis difference spectroscopy of LOV1-C57S-LOV2 in E. coli cells confirmed partial formation of the flavin neutral radical in the LOV1-C57S domain (Supplementary Figure S3). This observation might be attributed to the strongly reducing intracellular environment of E. coli. Therefore, we reproduced the time-resolved spectra by fitting a linear combination of the steady-state spectra of LOV1-C57S-LOV2 [31] and the flavin radical in LOV1-C57S [38] (Supplementary Figure S4A). The simulated spectra described the experimental data well in the time range from 0.038 s to 0.614 s (Supplementary Figure S4B). In contrast, the spectra in the time range from 3.137 s to 15.160 s deviate at 1676 (−) cm−1 from the simulated spectra (Supplementary Figure S4B), which is not caused by the LOV1 radical (Supplementary Figure S4C). The reduced amplitude of the signal at 1676 cm−1 might be attributed to a suppression of changes in turn elements [39] in LOV2 as influenced by the intracellular environment. Suppression of changes in specific structural elements by the cellular components has already been observed by ICIRD spectroscopy on LOV from PtAureo1a and demonstrated to be a result of macromolecular crowding by proteins [28].
With having established time-resolved ICIRD spectroscopy, we focused on the signal progression in bZIP-LOV in cells. The slow dark state recovery kinetics of τ = 2,800 s in E. coli cells [28] resulted in a reduced number of scans and thus a lower signal-to-noise ratio of the spectra as compared to LOV1-C57S-LOV2, which strongly restricts the resolved time range. We recorded a series of time-resolved spectra from 1.0 s to 17.5 s (Figure 5A). The signals of the flavin photoreaction were observed at 1729 (+) and 1714 (−) cm−1 well above the noise level. In the time range of seconds, the signal of bZIP unfolding at 1646 (−) cm−1 increases in intensity (Figure 5B), indicating an unfolding process on the second time range in cells as observed in vitro (Figure 3). The overlap with the bending mode of water at around 1650 cm−1 causes strong noise in this region of these spectra, which prevents a fit to determine a time constant. However, the signal at 1552 cm−1 in the corresponding amide II region shows a similar kinetic behavior, which supports an unfolding process in the bZIP within few seconds (Figure 5B). Therefore, the structural response of the bZIP domain takes place in cells in a similar time range as it was observed in vitro.
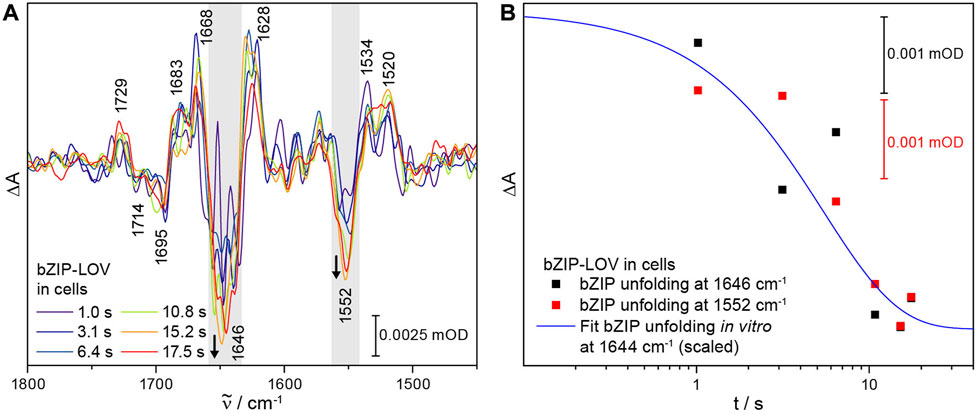
FIGURE 5. Time-resolved ICIRD spectra of bZIP-LOV from PtAureo1a in E. coli cells and kinetics of selected bands. (A) The time-resolved difference spectra show characteristic signals of adduct formation and changes in the amide I and amide II range (highlighted in gray). (B) The process of light-induced bZIP unfolding in cells takes place within seconds, as observed at the amide I signal at 1646 (−) cm−1 (mean absorbance from 1657 to 1644 cm−1) and at the amide II signal at 1552 (−) cm−1 (mean absorbance from 1557 to 1542 cm−1). The fit from in vitro experiments on the bZIP unfolding at 1644 cm−1 was added to guide the eye.
Much effort has been spent on studying aureochromes and their photoactivation using various biophysical techniques. Blue-light illumination of the LOV domain induces adduct formation with a time constant of 2.8 µs [21] followed by structural responses of the Jα and A’α helices [17,20,40]. Discrepancies are present in the proposed mechanisms for the signal progression from LOV to bZIP regarding the dark state structure of aureochromes. A dimeric structure in the dark of both, LOV and bZIP, was proposed for PtAureo1a (Figure 6C) as a result from SAXS [22]. Then, a repositioning of the A’α and Jα helix and a rearrangement of the LOV domains to a light state dimer mediate the signal progression and cause the partial unfolding of bZIP, as observed by FTIR spectroscopy [22]. In contrast, an association of the LOV domain to the leucine zipper region of bZIP in the dark state was suggested according to H/D exchange mass spectrometry and SAXS experiments on the same protein [18] (Figure 6B). Illumination leads to the dissociation of LOV from bZIP resulting in dimerization of LOV as well as an increase of structural flexibility in bZIP and flanking helices of LOV [18]. Only the latter model is in agreement with the time constants of seconds observed here by FTIR spectroscopy in vitro and in cells. The slow process is attributed to the time required for an assembly of LOV from a monomeric to a dimeric form (Figure 6B). As opposed to this, a dark dimer of LOV would be expected to reorient to a light dimer within few milliseconds or less (Figure 6C). Moreover, a dark state structure with an association of LOV to bZIP is supported here by a structural model generated via AlphaFold2 [41] (Figure 6A).
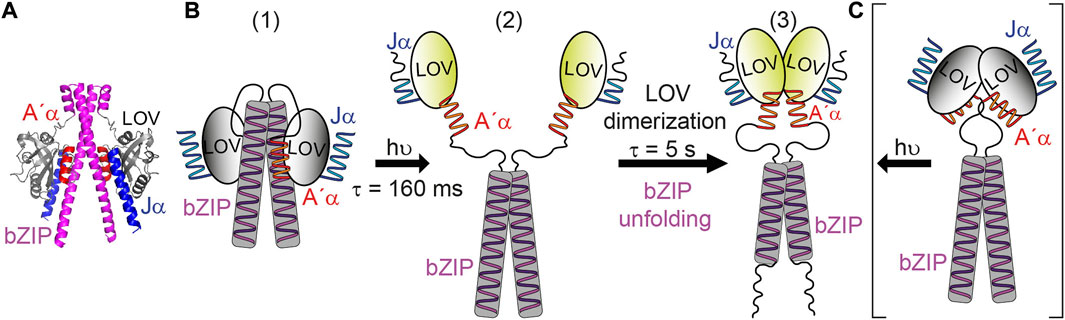
FIGURE 6. Model for the blue-light activation of bZIP-LOV from PtAureo1a. (A) The structure of bZIP-LOV predicted by AlphaFold2 shows an association of LOV to bZIP. (B) The following model is based on Heintz and Schlichting [18] with some modifications. (1) In the dark state, bZIP-LOV is present as a dimer with association of bZIP to bZIP and LOV to bZIP. (2) Illumination leads to an unfolding of the Jα helix, subsequent reorientation of the A’α helix and dissociation of LOV from bZIP. This process is proposed here to proceed with the time constant of τ = 160 ms observed by transient grating experiments [21] and supported by rapid-scan FTIR spectroscopy. (3) The signaling state of bZIP-LOV is formed by dimerization of LOV and concomitant or subsequent unfolding of the bZIP-linker with a time constant of τ = 5 s. (C) In the competing model [22] bZIP-LOV is present as a dimer in the dark state in which bZIP and LOV is associated to bZIP and LOV, respectively. This model cannot explain the slow kinetics of activation of the bZIP.
For VfAureo1, a monomeric dark state was reported, in which dimerization is mediated by light and by intermolecular cysteine disulfide bonds [23]. Many other aureochromes such as PtAureo1a do not possess cysteines in the bZIP domain and PtAureo1a is present as a dimer in the dark state [18,22]. In VfAureo1, interaction of bZIP with LOV in the dark and dissociation of LOV from bZIP in the light state was suggested from high-speed atomic force microscopy on a monomeric double mutant of bZIP-LOV called photozipper [42]. This structural model agrees with the model in Figure 6B but starts from a monomeric state.
We provide additional information on the signal progression from the LOV sensor to the bZIP effector using time-resolved FTIR difference spectroscopy. We observed the dimerization of LOV and the partial unfolding of bZIP with a time constant of τ = 5 s. This time range is at odds with results from transient grating observing structural changes in the bZIP and LOV domain of VfAureo1 with τ = 160 ms [21]. We consider it unlikely that such a large difference in time constants is caused by structural differences between VfAureo1 and PtAureo1a. More likely, different processes have been detected. With transient grating spectroscopy, changes in the diffusion coefficient of the photoreceptor are observed, whereas FTIR difference spectroscopy is sensitive to changes in secondary structural elements. The strong change in the diffusion coefficient observed by transient grating might accordingly be attributed to a release of LOV from the bZIP domain (Figure 6B). In the same time range, global analysis of time-resolved IR difference spectra indicated a process with τ ∼ 100 ms (Supplementary Figure S1), which might reflect the reorganization of the β-sheet of the LOV core that leads to the dissociation of LOV from bZIP. Only after the dissociation of LOV from bZIP, the activated LOV units might move towards each other and dimerize at the β-sheet surface [17,20], which is then detected with a considerable delay (τ = 5 s) in the time-resolved experiments at 1630 cm−1. Concomitantly, the partial unfolding of the bZIP domain represents formation of the signaling state with high affinity for target DNA [11,18,22]. Such small changes in secondary structure would probably not be resolved in transient grating spectroscopy because the resulting changes in diffusion coefficient are too small. Accordingly, the differences in sensitivity between transient grating and FTIR spectroscopy might explain differences in the observed kinetics.
Recently, the role of intrinsically disordered regions in a basic-helix-loop-helix (bHLH) transcription factor was emphasized by molecular dynamics simulation, nuclear magnetic resonance (NMR) and electron paramagnetic resonance (EPR) [43]. The high flexibility of the N-terminal region enables a switch between two conformational subensembles mediating affinity to DNA and target DNA. Although bZIP and bHLH are different types of transcription factors, they differ only slightly in the dimerization/zipper site and show high similarities in DNA binding [44]. Hence, the partial unfolding of bZIP as the final step in photoactivation of bZIP-LOV might mediate the enhanced affinity to the target DNA via an increased flexibility in the N-terminal region of bZIP similar as it has been observed in bHLH transcription factors.
A variety of biophysical methods has been developed to collect structural information on proteins in their native environment since the impact of the intracellular environment on proteins received increased attention [45]. For example, the introduction of a fluorescence label allows for sensing of the unfolded state in mammalian cells [46]. Spin labels in combination with EPR spectroscopy enable distance measurements in eukaryotic cells [47–49]. Even the three-dimensional structure of a protein in cells can be determined by selective isotope labeling using in-cell NMR spectroscopy [50–52].
Recently we introduced the label-free ICIRD spectroscopy to study the structural response of soluble photoreceptors in living E. coli cells [28]. Here, we established the time-resolved ICIRD spectroscopy on LOV1-C57S-LOV2 with a time resolution of 7.6 ms at a spectral resolution of 4 cm−1. For comparison, the time resolution of commercially available rapid-scan FTIR spectroscopy was estimated to be about 10 ms at a spectral resolution of only 16 cm−1 [53], whereas home-built rapid-scan setups reach 13 μs at a spectral resolution of 9 cm−1 [54]. To achieve the high time resolution with a conventional FTIR spectrometer, we delayed the TTL signal from the spectrometer to the pulsed laser to compensate for the void time of the interferometer during the mirror inversion. Other in-cell spectroscopic methods such as EPR spectroscopy might achieve time resolutions in the nanosecond time range [55], but such experiments have, to our knowledge, not been reported yet. In-cell NMR spectroscopy has been applied to processing, phosphorylation and degradation of various short proteins in eukaryotic cells with a time resolution on the minute time scale [56,57]. Here we introduce a time-resolved in-cell spectroscopic method with a time resolution in the millisecond time range providing structural information on proteins in cells.
It is of high interest to characterize the sequence of events in photoreceptors and optogenetic tools in an intracellular environment to provide a complete picture of the light-induced activation mechanism. Therefore, we studied the light-induced response of bZIP-LOV of aureochrome1a from P. tricornutum directly in living E. coli cells. A distinct partial unfolding of the bZIP domain was detected in the seconds time range in the cells. It should be noted that the presence of DNA in vitro led to an increase in α-helical fold of the bZIP domain [22], which was not observed in the in-cell experiments although genomic DNA was present. The overexpression of bZIP-LOV might lead to an unbalanced ratio of genomic DNA and receptor resulting in a structural response comparable to that observed in the absence of DNA. Further studies on bZIP-LOV in cells with lower receptor concentrations or with DNA containing the aureo box as recognition sequence would be required to clarify this issue.
Results from time-resolved FTIR difference spectroscopy on bZIP-LOV from PtAureo1a in vitro and in cells revealed a slow LOV dimerization and bZIP unfolding in the time range of seconds. These results favor a dark state model for aureochromes as proposed by Heintz and Schlichting [18], in which each LOV domain is associated to bZIP in a bZIP-mediated dimer. After illumination, time is required for the LOV domains to dissociate and dimerize. It remains to be resolved whether this structural model with its slow signal progression is also applicable to VfAureo1 with a monomeric dark state of bZIP-LOV [23].
Time-resolved investigations of protein structures in living cells are challenging. We demonstrated using in-cell FTIR spectroscopy that a time resolution of a few milliseconds can be reached. Moreover, ICIRD spectroscopy is currently limited to slight overexpression with a protein concentration between 120 μM and 330 µM [28] deviating from a native receptor concentration. Further improvements in time resolution and sensitivity might be achieved by employing setups with quantum cascade lasers (QCL) [58–60] or QCL frequency combs [53,61]. Such approaches might allow in future in-cell infrared spectroscopic studies at native receptor concentration and nanosecond time resolution.
The raw data supporting the conclusion of this article will be made available by the authors, without undue reservation.
Conceptualization, LG-Z and TK; investigation, LG-Z and EB; writing, LG-Z and TK; supervision, TK; project administration, TK; funding acquisition, TK. All authors have read and agreed to published version of the manuscript.
This work was supported by the Deutsche Forschungsgemeinschaft by DFG grant KO3580/7-1 to TK and Heisenberg Fellowship KO3580/4-2 to TK.
We thank Andreas Lüdeke from the electronic workshop of Bielefeld University and Andreas Helfmann, Leo Alexander Walters and Jan-Ulrich Klamert from the mechanical workshop of Bielefeld University for help with constructing the sample changer. Lars Wiehemeier is acknowledged for assistance in programming the sample changer. We acknowledge support for the publication costs by the Open Access Publication Fund of Bielefeld University and the Deutsche Forschungsgemeinschaft (DFG).
The authors declare that the research was conducted in the absence of any commercial or financial relationships that could be construed as a potential conflict of interest.
All claims expressed in this article are solely those of the authors and do not necessarily represent those of their affiliated organizations, or those of the publisher, the editors and the reviewers. Any product that may be evaluated in this article, or claim that may be made by its manufacturer, is not guaranteed or endorsed by the publisher.
The Supplementary Material for this article can be found online at: https://www.frontiersin.org/articles/10.3389/fphy.2023.1150671/full#supplementary-material
1. Kottke T, Xie AH, Larsen DS, Hoff WD. Photoreceptors take charge: Emerging principles for light sensing. Annu Rev Biophys (2018) 47:291–313. doi:10.1146/annurev-biophys-070317-033047
2. Froehlich AC, Liu Y, Loros JJ, Dunlap JC. White Collar-1, a circadian blue light photoreceptor, binding to the frequency promoter. Science (2002) 297(5582):815–9. doi:10.1126/science.1073681
3. He Q, Cheng P, Yang Y, Wang L, Gardner KH, Liu Y. White collar-1, a DNA binding transcription factor and a light sensor. Science (2002) 297(5582):840–3. doi:10.1126/science.1072795
4. Christie JM. Phototropin blue-light receptors. Annu Rev Plant Biol (2007) 58:21–45. doi:10.1146/annurev.arplant.58.032806.103951
5. Herrou J, Crosson S. Function, structure and mechanism of bacterial photosensory LOV proteins. Nat Rev Microbiol (2011) 9(10):713–23. doi:10.1038/nrmicro2622
6. Salomon M, Christie JM, Knieb E, Lempert U, Briggs WR. Photochemical and mutational analysis of the FMN-binding domains of the plant blue light receptor phototropin. Biochemistry (2000) 39(31):9401–10. doi:10.1021/bi000585+
7. Swartz TE, Corchnoy SB, Christie JM, Lewis JW, Szundi I, Briggs WR, et al. The photocycle of a flavin-binding domain of the blue light photoreceptor phototropin. J Biol Chem (2001) 276(39):36493–500. doi:10.1074/jbc.m103114200
8. Kasahara M, Swartz TE, Olney MA, Onodera A, Mochizuki N, Fukuzawa H, et al. Photochemical properties of the flavin mononucleotide-binding domains of the phototropins from Arabidopsis, rice, and Chlamydomonas reinhardtii. Plant Physiol (2002) 129(2):762–73. doi:10.1104/pp.002410
9. Kottke T, Heberle J, Hehn D, Dick B, Hegemann P. Phot-LOV1: Photocycle of a blue-light receptor domain from the green alga Chlamydomonas reinhardtii. Biophys J (2003) 84(2):1192–201. doi:10.1016/s0006-3495(03)74933-9
10. Christie JM, Salomon M, Nozue K, Wada M, Briggs WR. LOV (light, oxygen, or voltage) domains of the blue-light photoreceptor phototropin (nph1): Binding sites for the chromophore flavin mononucleotide. Proc Natl Acad Sci U S A (1999) 96(15):8779–83. doi:10.1073/pnas.96.15.8779
11. Takahashi F, Yamagata D, Ishikawa M, Fukamatsu Y, Ogura Y, Kasahara M, et al. AUREOCHROME, a photoreceptor required for photomorphogenesis in stramenopiles. Proc Natl Acad Sci U S A (2007) 104(49):19625–30. doi:10.1073/pnas.0707692104
12. Huysman MJ, Fortunato AE, Matthijs M, Schellenberger Costa B, Vanderhaeghen R, Van den Daele H, et al. AUREOCHROME1a-Mediated induction of the diatom-specific cyclin dsCYC2 controls the onset of cell division in diatoms (Phaeodactylum tricornutum). Plant Cell (2013) 25:215–28. doi:10.1105/tpc.112.106377
13. Schellenberger Costa B, Sachse M, Jungandreas A, Bartulos CR, Gruber A, Jakob T, et al. Aureochrome 1a is involved in the photoacclimation of the diatom Phaeodactylum tricornutum. PLoS ONE (2013) 8(9):e74451. doi:10.1371/journal.pone.0074451
14. Akiyama Y, Nakasone Y, Nakatani Y, Hisatomi O, Terazima M. Time-resolved detection of light-induced dimerization of monomeric aureochrome-1 and change in affinity for DNA. J Phys Chem B (2016) 120(30):7360–70. doi:10.1021/acs.jpcb.6b05760
15. Mitra D, Yang X, Moffat K. Crystal structures of Aureochrome1 LOV suggest new design strategies for optogenetics. Structure (2012) 20(4):698–706. doi:10.1016/j.str.2012.02.016
16. Banerjee A, Herman E, Kottke T, Essen LO. Structure of a native-like aureochrome 1a LOV domain dimer from Phaeodactylum tricornutum. Structure (2016) 24(1):171–8. doi:10.1016/j.str.2015.10.022
17. Herman E, Sachse M, Kroth PG, Kottke T. Blue-light-induced unfolding of the Jα helix allows for the dimerization of aureochrome-LOV from the diatom Phaeodactylum tricornutum. Biochemistry (2013) 52(18):3094–101. doi:10.1021/bi400197u
18. Heintz U, Schlichting I. Blue light-induced LOV domain dimerization enhances the affinity of Aureochrome 1a for its target DNA sequence. eLife (2016) 5:e11860. doi:10.7554/elife.11860
19. Harper SM, Neil LC, Gardner KH. Structural basis of a phototropin light switch. Science (2003) 301(5639):1541–4. doi:10.1126/science.1086810
20. Herman E, Kottke T. Allosterically regulated unfolding of the A'α helix exposes the dimerization site of the blue-light-sensing aureochrome-LOV domain. Biochemistry (2015) 54(7):1484–92. doi:10.1021/bi501509z
21. Toyooka T, Hisatomi O, Takahashi F, Kataoka H, Terazima M. Photoreactions of aureochrome-1. Biophys J (2011) 100(11):2801–9. doi:10.1016/j.bpj.2011.02.043
22. Banerjee A, Herman E, Serif M, Maestre-Reyna M, Hepp S, Pokorny R, et al. Allosteric communication between DNA-binding and light-responsive domains of diatom class I aureochromes. Nucleic Acids Res (2016) 44(12):5957–70. doi:10.1093/nar/gkw420
23. Hisatomi O, Nakatani Y, Takeuchi K, Takahashi F, Kataoka H. Blue light-induced dimerization of monomeric aureochrome-1 enhances its affinity for the target sequence. J Biol Chem (2014) 289(25):17379–91. doi:10.1074/jbc.m114.554618
24. Grusch M, Schelch K, Riedler R, Reichhart E, Differ C, Berger W, et al. Spatio-temporally precise activation of engineered receptor tyrosine kinases by light. EMBO J (2014) 33(15):1713–26. doi:10.15252/embj.201387695
25. Inglés-Prieto Á, Reichhart E, Muellner MK, Nowak M, Nijman SM, Grusch M, et al. Light-assisted small-molecule screening against protein kinases. Nat Chem Biol (2015) 11(12):952–4. doi:10.1038/nchembio.1933
26. Hepp S, Trauth J, Hasenjäger S, Bezold F, Essen LO, Taxis C. An optogenetic tool for induced protein stabilization based on the Phaeodactylum tricornutum aureochrome 1a light-oxygen-voltage domain. J Mol Biol (2020) 432(7):1880–900. doi:10.1016/j.jmb.2020.02.019
27. Bannister S, Böhm E, Zinn T, Hellweg T, Kottke T. Arguments for an additional long-lived intermediate in the photocycle of the full-length aureochrome 1c receptor: A time-resolved small-angle X-ray scattering study. Struct Dyn (2019) 6(3):034701. doi:10.1063/1.5095063
28. Goett-Zink L, Klocke JL, Bögeholz LAK, Kottke T. In-cell infrared difference spectroscopy of LOV photoreceptors reveals structural responses to light altered in living cells. J Biol Chem (2020) 295(33):11729–41. doi:10.1074/jbc.RA120.013091
29. Quaroni L, Zlateva T, Normand E. Detection of weak absorption changes from molecular events in time-resolved FT-IR spectromicroscopy measurements of single functional cells. Anal Chem (2011) 83(19):7371–80. doi:10.1021/ac201318z
30. Mészáros LS, Ceccaldi P, Lorenzi M, Redman HJ, Pfitzner E, Heberle J, et al. Spectroscopic investigations under whole-cell conditions provide new insight into the metal hydride chemistry of [FeFe]-hydrogenase. Chem Sci (2020) 11(18):4608–17. doi:10.1039/d0sc00512f
31. Pfeifer A, Mathes T, Lu Y, Hegemann P, Kottke T. Blue light induces global and localized conformational changes in the kinase domain of full-length phototropin. Biochemistry (2010) 49(5):1024–32. doi:10.1021/bi9016044
32. Thöing C, Oldemeyer S, Kottke T. Microsecond deprotonation of aspartic acid and response of the α/β subdomain precede C-terminal signaling in the blue light sensor plant cryptochrome. J Am Chem Soc (2015) 137:5990–9. doi:10.1021/jacs.5b01404
33. Ataka K, Hegemann P, Heberle J. Vibrational spectroscopy of an algal phot-LOV1 domain probes the molecular changes associated with blue-light reception. Biophys J (2003) 84(1):466–74. doi:10.1016/s0006-3495(03)74866-8
34. Iwata T, Nozaki D, Sato Y, Sato K, Nishina Y, Shiga K, et al. Identification of the C=O stretching vibrations of FMN and peptide backbone by 13C-labeling of the LOV2 domain of Adiantum Phytochrome3. Biochemistry (2006) 45(51):15384–91. doi:10.1021/bi061837v
35. Alexandre MT, van Grondelle R, Hellingwerf KJ, Kennis JT. Conformational heterogeneity and propagation of structural changes in the LOV2/Jα domain from Avena sativa phototropin 1 as recorded by temperature-dependent FTIR spectroscopy. Biophys J (2009) 97(1):238–47. doi:10.1016/j.bpj.2009.03.047
36. Konold PE, Mathes T, Weibetaenborn J, Groot ML, Hegemann P, Kennis JT. Unfolding of the C-terminal Jα helix in the LOV2 photoreceptor domain observed by time-resolved vibrational spectroscopy. J Phys Chem Lett (2016) 7(17):3472–6. doi:10.1021/acs.jpclett.6b01484
37. Kottke T, Dick B, Fedorov R, Schlichting I, Deutzmann R, Hegemann P. Irreversible photoreduction of flavin in a mutated Phot-LOV1 domain. Biochemistry (2003) 42(33):9854–62. doi:10.1021/bi034863r
38. Immeln D, Pokorny R, Herman E, Moldt J, Batschauer A, Kottke T. Photoreaction of plant and DASH cryptochromes probed by infrared spectroscopy: The neutral radical state of flavoproteins. J Phys Chem B (2010) 114(51):17155–61. doi:10.1021/jp1076388
39. Barth A, Zscherp C. What vibrations tell about proteins. Q Rev Biophys (2002) 35(4):369–430. doi:10.1017/s0033583502003815
40. Takeda K, Nakasone Y, Zikihara K, Tokutomi S, Terazima M. Dynamics of the amino-terminal and carboxyl-terminal helices of Arabidopsis phototropin 1 LOV2 studied by the transient grating. J Phys Chem B (2013) 117(49):15606–13. doi:10.1021/jp406109j
41. Mirdita M, Schütze K, Moriwaki Y, Heo L, Ovchinnikov S, Steinegger M. ColabFold: Making protein folding accessible to all. Nat Methods (2022) 19(6):679–82. doi:10.1038/s41592-022-01488-1
42. Tsuji A, Yamashita H, Hisatomi O, Abe M. Dimerization processes for light-regulated transcription factor Photozipper visualized by high-speed atomic force microscopy. Sci Rep (2022) 12(1):12903. doi:10.1038/s41598-022-17228-6
43. Sicoli G, Kress T, Vezin H, Ledolter K, Kurzbach D. A switch between two intrinsically disordered conformational ensembles modulates the active site of a basic-helix-loop-helix transcription factor. J Phys Chem Lett (2020) 11(21):8944–51. doi:10.1021/acs.jpclett.0c02242
44. Vázquez ME, Caamaño AM, Mascareñas JL. From transcription factors to designed sequence-specific DNA-binding peptides. Chem Soc Rev (2003) 32(6):338–49. doi:10.1039/B206274G
45. Gierasch LM, Gershenson A. Post-reductionist protein science, or putting Humpty Dumpty back together again. Nat Chem Biol (2009) 5(11):774–7. doi:10.1038/nchembio.241
46. Ignatova Z, Gierasch LM. Monitoring protein stability and aggregation in vivo by real-time fluorescent labeling. Proc Natl Acad Sci U S A (2004) 101(2):523–8. doi:10.1073/pnas.0304533101
47. Igarashi R, Sakai T, Hara H, Tenno T, Tanaka T, Tochio H, et al. Distance determination in proteins inside Xenopus laevis oocytes by double electron-electron resonance experiments. J Am Chem Soc (2010) 132(24):8228–9. doi:10.1021/ja906104e
48. Martorana A, Bellapadrona G, Feintuch A, Di Gregorio E, Aime S, Goldfarb D. Probing protein conformation in cells by EPR distance measurements using Gd3+ spin labeling. J Am Chem Soc (2014) 136(38):13458–65. doi:10.1021/ja5079392
49. Fleck N, Heubach CA, Hett T, Haege FR, Bawol PP, Baltruschat H, et al. Slim: A short-linked, highly redox-stable trityl label for high-sensitivity in-cell EPR distance measurements. Angew Chem Int Ed (2020) 59(24):9767–72. doi:10.1002/anie.202004452
50. Serber Z, Keatinge-Clay AT, Ledwidge R, Kelly AE, Miller SM, Dötsch V. High-resolution macromolecular NMR spectroscopy inside living cells. J Am Chem Soc (2001) 123(10):2446–7. doi:10.1021/ja0057528
51. Selenko P, Serber Z, Gadea B, Ruderman J, Wagner G. Quantitative NMR analysis of the protein G B1 domain in Xenopus laevis egg extracts and intact oocytes. Proc Natl Acad Sci U S A (2006) 103(32):11904–9. doi:10.1073/pnas.0604667103
52. Sakakibara D, Sasaki A, Ikeya T, Hamatsu J, Hanashima T, Mishima M, et al. Protein structure determination in living cells by in-cell NMR spectroscopy. Nature (2009) 458(7234):102–5. doi:10.1038/nature07814
53. Norahan MJ, Horvath R, Woitzik N, Jouy P, Eigenmann F, Gerwert K, et al. Microsecond-resolved infrared spectroscopy on nonrepetitive protein reactions by applying caged compounds and quantum cascade laser frequency combs. Anal Chem (2021) 93(17):6779–83. doi:10.1021/acs.analchem.1c00666
54. Süss B, Ringleb F, Heberle J. New ultrarapid-scanning interferometer for FT-IR spectroscopy with microsecond time-resolution. Rev Sci Instrum (2016) 87(6):063113. doi:10.1063/1.4953658
55. Biskup T, Hitomi K, Getzoff ED, Krapf S, Koslowski T, Schleicher E, et al. Unexpected electron transfer in cryptochrome identified by time-resolved EPR spectroscopy. Angew Chem Int Ed (2011) 50(52):12647–51. doi:10.1002/anie.201104321
56. Selenko P, Frueh DP, Elsaesser SJ, Haas W, Gygi SP, Wagner G. In situ observation of protein phosphorylation by high-resolution NMR spectroscopy. Nat Struct Biol (2008) 15(3):321–9. doi:10.1038/nsmb.1395
57. Zheng W, Zhang Z, Ye Y, Wu Q, Liu M, Li C. Phosphorylation dependent α-synuclein degradation monitored by in-cell NMR. Chem Commun (2019) 55(75):11215–8. doi:10.1039/c9cc05662a
58. Davis CM, Cooper AK, Dyer RB. Fast helix formation in the B domain of protein A revealed by site-specific infrared probes. Biochemistry (2015) 54(9):1758–66. doi:10.1021/acs.biochem.5b00037
59. Donten ML, Hassan S, Popp A, Halter J, Hauser K, Hamm P. pH-jump induced leucine zipper folding beyond the diffusion limit. J Phys Chem B (2015) 119(4):1425–32. doi:10.1021/jp511539c
60. Resler T, Schultz BJ, Lórenz-Fonfría VA, Schlesinger R, Heberle J. Kinetic and vibrational isotope effects of proton transfer reactions in channelrhodopsin-2. Biophys J (2015) 109(2):287–97. doi:10.1016/j.bpj.2015.06.023
Keywords: aureochrome, blue light photoreceptor, diatom, flavin, ICIRD, infrared, LOV (light-oxygen-voltage), transcription factor
Citation: Goett-Zink L, Baum E and Kottke T (2023) Time-resolved infrared difference spectroscopy in cells: Response of the basic region leucine zipper of aureochrome. Front. Phys. 11:1150671. doi: 10.3389/fphy.2023.1150671
Received: 25 January 2023; Accepted: 06 March 2023;
Published: 16 March 2023.
Edited by:
Carsten Kötting, Ruhr University Bochum, GermanyReviewed by:
Janne Ihalainen, University of Jyväskylä, FinlandCopyright © 2023 Goett-Zink, Baum and Kottke. This is an open-access article distributed under the terms of the Creative Commons Attribution License (CC BY). The use, distribution or reproduction in other forums is permitted, provided the original author(s) and the copyright owner(s) are credited and that the original publication in this journal is cited, in accordance with accepted academic practice. No use, distribution or reproduction is permitted which does not comply with these terms.
*Correspondence: Lukas Goett-Zink, bHVrYXMuZ29ldHQtemlua0B1bmktYmllbGVmZWxkLmRl; Tilman Kottke, dGlsbWFuLmtvdHRrZUB1bmktYmllbGVmZWxkLmRl
Disclaimer: All claims expressed in this article are solely those of the authors and do not necessarily represent those of their affiliated organizations, or those of the publisher, the editors and the reviewers. Any product that may be evaluated in this article or claim that may be made by its manufacturer is not guaranteed or endorsed by the publisher.
Research integrity at Frontiers
Learn more about the work of our research integrity team to safeguard the quality of each article we publish.