Abstract
Graph energy is defined to be the p-norm of adjacency matrix associated to the graph for p = 1 elaborated as the sum of the absolute eigenvalues of adjacency matrix. The graph’s spectral radius represents the adjacency matrix’s largest absolute eigenvalue. Applications for graph energies and spectral radii can be found in both molecular computing and computer science. On similar lines, Inverse Sum Indeg, (ISI) energies, and (ISI) spectral radii can be constructed. This article’s main focus is the ISI energies, and ISI spectral radii of the generalized splitting and shadow graphs constructed on any regular graph. These graphs can be representation of many physical models like networks, molecules and macromolecules, chains or channels. We actually compute the relations about the ISI energies and ISI spectral radii of the newly created graphs to those of the original graph.
1 Introduction
Since the proof of Kirchhoff’s renowned matrix-tree theorem in 1876, the relationship between graph eigenvalues and graph structure has been well established. It has been a quest whether the structure of a graph can be described by the eigenvalues of some matrix associated to the graph. In network sciences, many real-world problems can be described in terms of a graph or a network. In most of these problems, eigenvalues play a significant role. One of the best-known applications is the epidemic control model, where nodes indicate either healthy peers who are vulnerable to infection or diseased peers [1]. The detection of such nodes can be done using the spectrum of the graph. It has been proven that there exists a logarithmic growth relationship between the average distance and the overall number of nodes, [2]. The connection between Laplacian energy and network coherence was studied by Liu et al. [3]. Fractional derivative of the Gabor—Morlet wavelet is computed by Guariglia et al. in [4]. X. Zheng et al. proposed a new framework of adaptive multiscale graph wavelet decomposition for signals in [5]. Guariglia et al. in [6] analyzed Chebyshev wavelets properties by computing their Fourier transform. Some properties relating to operators which approximate a signal at a given resolution has been given in [7]. Some aspects of fractional calculus of zeta functions along with application of Shannon entropy has been discussed in [8]. The dimer problem and Huckel’s theory are two examples of usage of graph spectra in statistical physics and chemistry, respectively [9]. Applications in physics and chemistry provided inspiration for the theory of graph spectra to be developed. In physics, treating the membrane vibration problem by approximatively solving the related partial differential equation results in examination of the eigenvalues of a graph that is a discrete model of the membrane [10]. The topic of membrane vibration served as the inspiration for the first mathematical publication on graph spectra [11]. The Huckel molecular orbital theory, which describes unsaturated conjugated hydrocarbons, uses graph spectra as one of its primary tools in chemistry. Several statistical physics issues contain the spectra of specific matrices that are strongly related to adjacency matrices [12–14]. The process of counting 1-factors takes into account the eigenvalues and walks in the associated graphs [10]. The problem of counting the number of 1-factors in a graph becomes the dimer problem in physics. The enumeration of 1-factors can be used to solve a variety of issues in physics, not only the dimer problem. The famous Ising problem that emerged from the idea of ferromagnetism is the most well-known [12, 13]. Physicists are interested in the graph-walk problem for reasons other than the 1-factor enumeration problem. The random-walk and self-avoiding-walk problems are two such examples [12, 13]. The eigenvalues can also be used to calculate the independence number, chromatic number, partitioning, ranking, and epidemic spreading in networks and clustering [15]. The second largest eigenvalue of a regular graph can be used in coding theory to represent the minimum Hamming distance of a linear code [16, 17]. According to Shannon information theory, the eigenvalues of the channel graph can be used to represent the channel capacity, which is the maximum amount of information that can be communicated over a channel or stored in a storage medium [17, 18]. For a given code, an encoder or decoder is constructed based on the spectral radius of the channel graph. A graph is used in quantum chemistry to represent the skeleton of an unsaturated hydrocarbon. In such molecules, the eigenvalues of molecular graph correspond to electron energy levels. A close relationship exists between the spectrum of the graph and the stability of the molecules [19]. The idea of using the spectral radius of the graph G as a gauge of branching was first put forth by Cvetkovic and Gutman in 1977 [20]. After this, spectral radii have been discussed extensively for different purposes [20–23].
In this article, we only restrict to a regular graph G without isolated vertices referred as base graph. ISI matrix was established by Zangi et al. having entries when i ∼ j, all entries are 0 elsewhere, [24]. It has been established that ISI index would be a good indicator of the total surface area of the octane isomers. A number of topological indices are used to define the energy of a graph, many of which are useful in chemistry. This article relates the ISI energies and ISI spectral radii of larger graphs with ISI energies and ISI spectral radii of the base graph. Gutman et al. first proposed the idea of ɛ(G) in 1978 [25]. This idea is currently gaining a lot of attention due to its usage and applications in different areas. The symbol A(G) represents the adjacency matrix of the graph G, whose all entries are 1 when vertices are adjacent and 0 when vertices are not adjacent. There are several uses for the greatest eigenvalue of the A(G) matrix in algebraic graph theory, which is also known as the graph’s spectral radius and is indicated by the symbol ℘(G). Billal et al. established closed relations among different versions of energies and spectral radii of splitting and shadow graphs with energies and spectral radii of the base graph, [26–28]. The following [29–31] provides information and sources related to spectral radii. It is possible to obtain ISI Spectral radius and ISI energy using Nordhaus-Gaddum-type results, [32]. Some lower bounds for the adjacency spectral radius and the Laplacian spectral radius in terms of the degrees and the 2-degrees of vertices are presented by Yu et al. in [33]. Zhou et al. in [34] provided lower and upper bounds for the distance energy and spectral radius of bipartite graphs. Matrix analysis has been studied in relation to graph energies by Gatmacher [35]. Meenakshi et al. discussed several energies connected to a graph and the bounds of various matrices energies connected to a graph in a survey [36].
One-splitting and two-shadow graphs of simple connected graph were constructed by Samir et al. [37], and it was demonstrated that the adjacency energies of these newly created graphs are constant multiples of the energies of the original graph. Later, Samir et al. [38] developed these ideas and came up results relating to adjacency energies. Liu et al. investigated distance and adjacency energies of multilevel wheel networks in [39]. In [40] Chu et al. established the signless Laplacian and Laplacian energies as well as their spectra using multilevel wheels. Gutman et al. discussed graph energy and its applications that provided details on more than a hundred different varieties of graph energies and their applications in diverse areas, [41]. We refer to [42] for additional information and fundamental concepts on graph energies. Various applications of graph energies can be traced down in [43–45]. There are crystallographic uses for various graph energies [46, 47], the theory of macromolecules [48, 49], protein sequencing [50–52], biology [53], challenges related to air travel [54], and construction of spacecraft [55].
Present article focuses on the ISI spectral radii and energy of the generalized splitting and shadow graphs. To be more precise, we link the spectral radii and energies of the new graph to those of the base graphs. The ISI spectral radius and energy of the p-splitting graph are determined in Section 2. We obtain further results relating to shadow graphs Section 3.
2 Preliminaries
We outline the main ideas and background data related to our main findings in this section. For additional details and sources relevant to this section, see [24]. According to [24], the inverse sum indeg matrix [ISI(G)] for the graph G has entries kij.
The degrees of the vertices vi and vi are di and dj, respectively. The distinct eigenvalues of the Inverse Sum Indeg ISI matrix of the graph G are ζ1, ζ2, ⋯ζn. If different ISI eigenvalues of the graph G have multiplicities of m1, m2, ⋯mn, respectively, then
Then ISI energy is defined as
The spectral radius for ISI matrix iswhere the eigenvalues of the ISI matrix are ζ1, ζ2, … , ζn. It is worth mentioning that these two invariants are quite different as the ISI energy is the sum whereas the ISI spetral radius is the largest value. Our findings are fundamentally dependent on the following definitions. In order to generate the p-splitting graph Splp(G) of the graph G, new p vertices are added to each vertex v of the graph G, ensuring that each of the new vertices is also connected to each vertices that is adjacent to v in G, [56]. Base graph C4 is given in Figure 1 and 1-splitting graph of C4 is given in Figure 2.
FIGURE 1
FIGURE 2
A fresh p copy of the graph G is first considered when creating the p-shadow graph Shp(G) of the graph. The neighbors of the corresponding vertex V in Gj are then connected to each vertex U in Gi. The 4-shadow graph of C4 is given in Figure 3.
FIGURE 3
Let AϵRm×n, BϵRp×q. Then A⊗B [38], is given by
The following proposition will be frequently used to prove the main results. In fact, it relates the eigenvalues of the tensor product of two matrices with the eigenvalues of these matrices.
Proposition 1.1[57] Assuming that α is an eigenvalue of A and β is an eigenvalue of B. Then an eigenvalue of A⊗B is αβ.
3 ISI energies and ISI spectral radii of p splitting graph of G
The ISI energies and ISI spectral radii of the p-splitting graph of G and the ISI energies and ISI spectral radii of the base graph are compared in this section. We wish to reiterate that G is any regular graph.
The relation between theISIenergy of the base graphGand theISIenergy of thep-splitting graph ofGis
Proof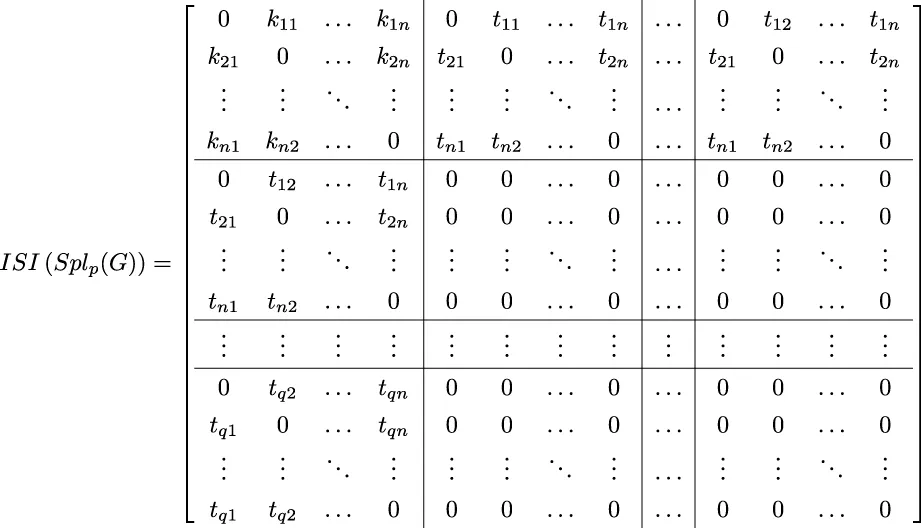 ISI(Splp(G)) matrix may be written as followsMatrix ℵ1 is given by ℵ1 = (p + 1)ISI(G). Matrix ℵ2 is given by .Let [A] = cij having entriesWe are looking for ISIɛ(Splp(G)), therefore obtaining all eigenvalues of [A] is necessary. The eigenvalues of [A] are being calculated right now. Due to its rank, [A] has only two non-zero eigenvalues. The eigenvalues of [A] are represented by the symbols α1 and α1. Clearly, then, we haveTrace of the matrix A is denoted by tr(A). Consider [A2] = dij having entriesThenEqs 3.1, 3.2 when solved yield the following resultsandThe notation Ch(A) stands for the characteristic equation of [A]. Finally, we may find Ch(A), which is denoted by .Consequently, we reach at the following spectrum,In light of the fact that ISI(Splp(G)) = ISI(G)⊗A. By applying Proposition 1.1, we get
Proposition 3.1ISIenergy ofp-splitting graph ofCsis
ProofSince each vertex in Cs has degree 2 because Cs is a 2 regular graph, we getISI eigenvalues of Cs are easily observed as followsThen utilizing Theorem 6 of [58], we haveTheorem 1 can be used to get the desired result since cycle graph is a regular graph.Base graph K4 is given in Figure 4 and 1-splitting graph of K4 is given in Figure 5.
FIGURE 4
FIGURE 5
Proposition 3.2ISIenergy ofp-splitting graph ofKsis.
ProofSince each vertex in Ks has a degree of s − 1 because Ks is a s − 1 regular graph, we get..Finally, we haveTheorem 1 can be used to get the desired result since complete graph is a regular graph.Base graph K3,3 is given in Figure 6 and 1-splitting graph of K3,3 is given in Figure 7.
FIGURE 6
FIGURE 7
Proposition 3.3ISIenergy ofp-splitting graph ofKs,sis.
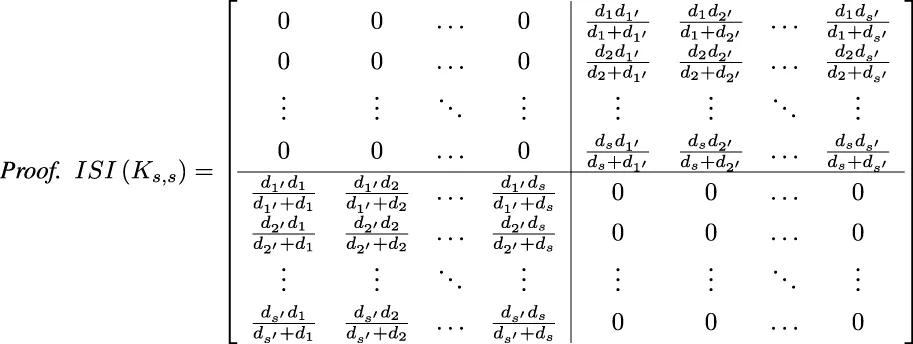 .Since each vertex in Ks,s has a degree of s because Ks,s is a s-regular graph, we get
 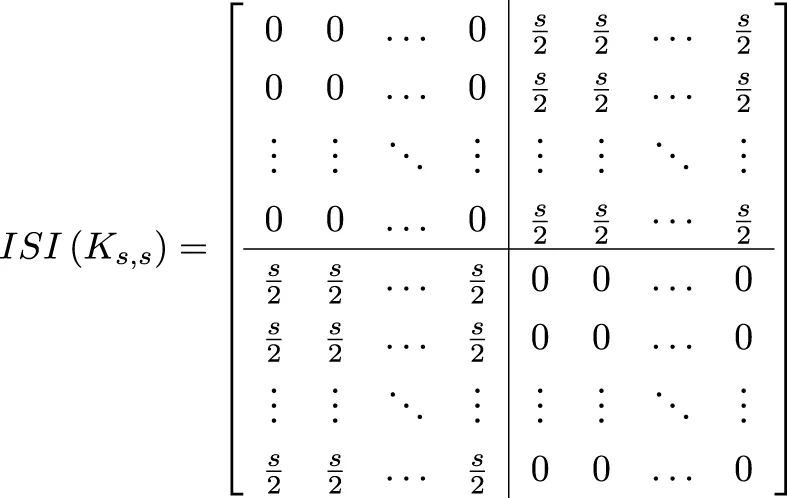 ...Finally, we haveTheorem 1 can be used to get the desired result since complete graph is a regular graph.
The relation between theISIspectral radius of the base graphGand theISIspectral radius of thep-splitting graph ofGis.
Proof Using the same justifications as Formula 3.5 in Theorem 1,In light of the fact that ISI(Splp(G)) = ISI(G)⊗A. By applying Proposition 1.1, we get
Proposition 3.4ISIspectral radius ofp-splitting graph ofCsis.
Proof Using Eq. 3.6, all eigenvalues of Cs areThe largest absolute eigenvalue of Cs is 2. So, we arrive atTheorem 2 can be used to get the desired result since cycle graph is a regular graph.The following result give the ISI spectral radius of p-splitting graph of Ks.
Proposition 3.5ISIspectral radius ofp-splitting graph ofKsis.
Proof Using the same justifications as Formula 3.8 in Proposition 3.2,The largest absolute eigenvalue of Ks is . So, we arrive atTheorem 2 can be used to get the desired result since complete graph is a regular graph.
Proposition 3.6ISIspectral radius ofp-splitting graph ofKs,sis.
Proof Using the same justifications as Formula 3.10 in Proposition 3.3,The largest absolute eigenvalue of Ks,s is . So, we arrive atTheorem 2 can be used to get the desired result since complete bipartite graph is a regular graph.
4 ISI energies and ISI spectral radii of p-shadow graph of G
The ISI energies and ISI spectral radii of the p-shadow graph of G and the ISI energies and ISI spectral radii of the base graph are compared in this section. We wish to reiterate that G is any regular graph.
The relation between theISIenergy of the base graphGand theISIenergy of thep-shadow graph ofGis
Proof You may write ISI(Shp(G)) matrix as followsMatrix ℵ3 is given by ℵ3 = (p)ISI(G).Let [M] = mij having entriesWe are looking for ISIɛ(Shp(G)), therefore obtaining all eigenvalues of M is necessary. The eigenvalues of [M] are being calculated right now. Due to its rank, [M] has only one non-zero eigenvalue. The notation Ch(M) stands for characteristic equation of [M]. Finally, we may find Ch(M), which is denoted byCh(M) = αp−1(α − p2) = 0.Consequently, we reach at the following spectrum,In light of the fact that ISI(Shp(G)) = ISI(G)⊗M. By applying Proposition 1.1, we get
Proposition 4.1ISIenergy ofp-shadow graph ofCsisISIɛ(Shp(Cs)) .
Proof Using the same justifications as Formula 3.7 in Proposition 3.1, we haveISIɛ(Cs) = . Theorem 3 can be used to get the desired result since cycle graph is a regular graph.2-shadow graph of K4 is given in Figure 8.
FIGURE 8
Proposition 4.2ISIenergy ofp-shadow graph ofKsis
ProofUsing the same justifications as Formula 3.9 in Proposition 3.2, we haveTheorem 3 can be used to get the desired result since complete graph is a regular graph.2-shadow graph of K3,3 is given in Figure 9.
FIGURE 9
Proposition 4.3ISIenergy ofp-shadow graph ofKs,sis
Proof Using the same justifications as Formula 3.11 in Proposition 3.3, we haveISIɛ(Ks,s) = s2.Theorem 3 can be used to get the desired result since complete bipartite graph is a regular graph.
The relation between theISIspectral radius of the base graphGand theISIspectral radius of thep-shadow graph ofGis
Proof Using the same justifications as Formula 4.1 in Theorem 3,In light of the fact that ISI(Shp(G)) = ISI(G)⊗M. By applying Proposition 1.1, we get
Proposition 4.4ISIspectral radius ofp-shadow graph ofCsis
Proof Utilizing Eq. 3.12 of Proposition 3.4, we haveTheorem 4 can be used to get the desired result since cycle graph is a regular graph.
Proposition 4.5ISIspectral radius ofp-shadow graph ofKsis
Proof Utilizing Eq. 3.13 of Proposition 3.5, we haveTheorem 4 can be used to get the desired result since complete graph is a regular graph.
Proposition 4.6ISIspectral radius ofp-shadow graph ofKs,sis
Proof Utilizing Eq. 3.14 of Proposition 3.6, we haveTheorem 4 can be used to get the desired result since complete bipartite graph is a regular graph.
5 Conclusion and applications
Most well known theories in spectral graph theory are graph energy and the spectral radius. These thoughts establish a connection between mathematics and chemistry. The literature contains a huge amount of writing on these ideas. Exploring the spectral radii and energies of bigger graphs is a task that we must rise to. By focusing on splitting and shadow graphs, we arrived at the conclusions that the spectral radii and energies of the newly developed graphs are multiples of the spectral radii and energies of the original graphs. As propositions, we derived these particular relations for the basic families of graphs such as cycle, complete and complete bipartite graphs.
Recently it has been observed that physical and chemical properties of anticancer drugs were well correlated with ISI energies and spectral radius. Moreover, this work implied that these anticancer drugs may be utilized for further study by pharmacists and chemists in designing new drugs, using the concept of these topological indices. The more correlated drugs may have a better impact on the treatment of cancer. For a better treatment of cancer, a future study may be carried out by interdisciplinary researchers as a joint venture, [59]. ISI energy and its variants have diverse, amazing and, to some extent, unanticipated utilizations in crystallography and total surface are of octane isomers [60]. ISI energy has some connection with protein sequences [49, 52]. ISI energies and ISI spectrum has applications in network analysis and resilience [54, 61, 62]. Similarly other key invariants of graphs like chromatic number can be estimated using ISI energy.
Statements
Data availability statement
The original contributions presented in the study are included in the article/supplementary material, further inquiries can be directed to the corresponding author.
Author contributions
Article was conceived by MMM, computations have been done by AB and MIQ and drafted by MA.
Conflict of interest
The authors declare that the research was conducted in the absence of any commercial or financial relationships that could be construed as a potential conflict of interest.
Publisher’s note
All claims expressed in this article are solely those of the authors and do not necessarily represent those of their affiliated organizations, or those of the publisher, the editors and the reviewers. Any product that may be evaluated in this article, or claim that may be made by its manufacturer, is not guaranteed or endorsed by the publisher.
References
1.
AbiadACoutinhoGFiolMANogueiraBZeijlemakerS. Optimization of eigenvalue bounds for the independence and chromatic number of graph powers. Discrete Math (2022) 345(3):112706. 10.1016/j.disc.2021.112706
2.
LiuJBBaoYZhengWT. Analyses of some structural properties on a class of hierarchical scale-free networks. Fractals (2022) 30(7):2250136. 10.1142/s0218348x22501365
3.
LiuJBBaoYZhengWTHayatS. Network coherence analysis on a family of nested weighted n-polygon networks. Fractals (2021) 29(8):2150260. 10.1142/s0218348x21502601
4.
GuarigliaESilvestrovS. Fractional-wavelet analysis of positive definite distributions and wavelets on D’(C) D’(C). In: Engineering mathematics II: Algebraic, stochastic and analysis structures for networks, data classification and optimization. New York, NY: Springer International Publishing (2016).
5.
ZhengXTangYYZhouJ. A framework of adaptive multiscale wavelet decomposition for signals on undirected graphs. IEEE Trans Signal Process (2019) 67(7):1696–711. 10.1109/tsp.2019.2896246
6.
GuarigliaEGuidoRC. Chebyshev wavelet analysis. J Funct Spaces (2022) 2022:1–17. 10.1155/2022/5542054
7.
MallatSG. A theory for multiresolution signal decomposition: The wavelet representation. IEEE Trans Pattern Anal Machine Intell (1989) 11:674–93. 10.1109/34.192463
8.
GuarigliaE. Fractional calculus, zeta functions and Shannon entropy. Open Math (2021) 19(1):87–100. 10.1515/math-2021-0010
9.
CvetkovicDDoobMSachsH. Spectra of graphs—theory and application. New York: Academic Press (1979).
10.
CvetkovicDDoobMSachsH. Spectra of graphs, theory and application. 3rd. Leipzig: Johann Ambrosius Barth Verlag (1995).
11.
CollatzLSinogowitzU. Spektren endlicher grafen. Abh Math Sem Univ Hamburg (1957) 21:63–77. 10.1007/BF02941924
12.
KasteleynPW. Graph theory and crystal psysics. In: HararyF, editor. Graph theory and theoretical physics. London: Academic Press (1967). p. 43–110.
13.
MontrollEW. Lattice statistics. In: BeckenbachEF, editor. Applied combinatorial mathematics. New York, NY: Wiley (1964). p. 96–143.
14.
PercusJK. Combinational methods. Berlin, Heidelberg: Springer-Verlag (1969).
15.
SpielmanD. Constructing error-correcting codes from expander graphs. In: HejhalDAFriedmanJGutzwillerMCOdlyzkoAM, editors. Emerging applications of number theory. New York, NY: Springer (1999).
16.
CalkinNJWilfHS. The number of independent sets in a grid graph. SIAM J Discrete Math (1998) 11(1):54–60. 10.1137/s089548019528993x
17.
CohnM. On the channel capacity of read/write isolated memory. Discrete Math (1995) 56:1–8. 10.1016/0166-218x(93)e0130-q
18.
ImminkK. Codes for mass data storage systems. The Netherlands: Shannon Foundation Publishers (1999).
19.
CvetkovicDMDoobMSachsH. Spectra of graphs. 3rd. Leipzig: Johann Ambrosius Barth Verlag (1995).
20.
CvetkovicDMGutmanI. Note on branching. Croat Chem Acta (1977) 47:115–21.
21.
RandicMVrackoMNovicM. Eigenvalues as molecular decriptors. In: DiudeaMV, editor. QSPR/QSAR studies by molecular descriptors. Huntington: Nova (2001). p. 147–211.
22.
GutmanIVidovicD. Two early branching indices and the relation between them. Theor Chem Acc (2002) 108:98–102. 10.1007/s00214-002-0362-x
23.
FischermannMGutmanIHoffmannARautenbachDVidovicDVolkmannL. Extremal chemical trees. Z Naturforsch (2002) 57:49–52. 10.1515/zna-2002-9-1006
24.
ZangiSGhorbaniMEslampourM. On the eigenvalues of some matrices based on vertex degree. Iranian J Math Chem (2018) 9(2):149156.
25.
GutmanI. The energy of a graph. Ber Math Statist Sekt Forschungsz Graz (1978) 103:1–22. 10.1016/j.laa.2004.02.038
26.
ZhangXBilalAMunirMMRehmanHMU. Maximum degree and minimum degree spectral radii of some graph operations. Math Biosciences Eng (2022) 19(10):10108–21. 10.3934/mbe.2022473
27.
BilalAMunirMM. ABC energies and spectral radii of some graph operations. Front Phys (2022) 10:1053038. 10.3389/fphy.2022.1053038
28.
BilalAMunirMM. Randic and reciprocal randic spectral radii and energies of some graph operations. J Intell Fuzzy Syst (2022) 44(4):5719–29. 10.3233/JIFS-221938.1–11
29.
CvetkovicDDoobMSachsH. Spectra of graphs theory and applications. 2nd ed.New York, NY: Academic Press (1982).
30.
CvetkovicDRowlinsonP. The largest eigenvalue of a graph. A survey. Linear and Multilinear Algebra (1990) 28(1-2):333. 10.1080/03081089008818026
31.
YuanH. Upper bounds of the spectral radius of graphs in terms of genus. J Comb Theor Ser B (1998) 74(2):153–9. 10.1006/jctb.1998.1837
32.
HavareOC. On the inverse sum indeg index (ISI), spectral radius of ISI matrix and ISI energy. Open J Math Sci (2022) 6(1):2534.
33.
YuALuMTianF. On the spectral radius of graphs. Linear Algebra its Appl (2004) 387:4149. 10.1016/j.laa.2004.01.020
34.
ZhouaBIlicA. On distance spectral radius and distance energy of graphs. MATCH Commun Math Comp Chem (2010) 64:261280.
35.
GantmacherFR. The theory of matrices. 10. New York, NY: Chelsea (1959).
36.
MeenakshiSLavanyaS. A survey on energy of graphs. Ann Pure Appl Math (2014) 8:183191.
37.
VaidyaSKPopatKM. Some new results on energy of graphs. MATCH Commun Math Comp Chem (2017) 77:589594.
38.
VaidyaSKPopatKM. ENERGY OF m-SPLITTING AND m-SHADOW GRAPHS. Far East J Math Sci (Fjms) (2017) 102(8):1571–8. 10.17654/ms102081571
39.
LiuJBMunirMYousafANaseemAAyubK. Distance and adjacency energies of multi-level wheel networks. Mathematics (2019) 7(1):43. 10.3390/math7010043
40.
ChuZQMunirMYousafAQureshiMILiuJB. Laplacian and signless laplacian spectra and energies of multi-step wheels. Math Biosciences Eng (2020) 17(4):3649–59. 10.3934/mbe.2020206
41.
GutmanIFurtulaB. On graph energies and their application. Bulletin (Academie Serbe Des Sciences Et Des Arts. Classe Des Sciences Mathematiques Et Naturelles. Sciences Mathematiques) (2019) 44:2945.
42.
LiXShiYGutmanI. Graph energy. New York, NY: Springer (2012).
43.
SylvesterJJ. Chemistry and algebra. Nature (1878) 17(432):284284. 10.1038/017284a0
44.
BalabanAT. Applications of graph theory in chemistry. J Chem Inf Model (1985) 25(3):334–43. 10.1021/ci00047a033
45.
RandicM. Characterization of molecular branching. J Am Chem Soc (1975) 97(23):6609–15. 10.1021/ja00856a001
46.
YugeK. Extended configurational polyhedra based on graph representation for crystalline solids. Trans Mater Res Soc Jpn (2018) 43(4):233–6. 10.14723/tmrsj.43.233
47.
DhanalakshmiARaoKSSivakumarK. Characterization of α -cyclodextrin using adjacency and distance matrix. Indian J Sci (2015) 12:7883.
48.
PraznikarJTomicMTurkD. Validation and quality assessment of macromolecular structures using complex network analysis. Sci Rep (2019) 9:1678. 10.1038/s41598-019-38658-9
49.
WuHZhangYChenWMuZ. Comparative analysis of protein primary sequences with graph energy. Physica A (2015) 437:249–62. 10.1016/j.physa.2015.04.017
50.
Di PaolaLMeiGDi VenereAGiulianiA. Exploring the stability of dimers through protein structure topology. Curr Protein Pept Sci (2015) 17(1):30–6. 10.2174/1389203716666150923104054
51.
SunDXuCZhangY. A novel method of 2D graphical representation for proteins and its application. MATCH Commun Math Comp Chem (2016) 75:431446.
52.
YuLHangYZGutmanIShiYDehmerM. Protein sequence comparison based on physicochemical properties and the position-feature energy matrix. Sci Rep (2017) 7:46237. 10.1038/srep46237
53.
GiulianiAFilippiSBertolasoM. Why network approach can promote a new way of thinking in biology. Front Genet (2014) 5:83. 10.3389/fgene.2014.00083
54.
JiangJZhangRGuoLLiWCaiX. Network aggregation process in multilayer air transportation networks. Chin Phys Lett (2016) 33:108901. 10.1088/0256-307x/33/10/108901
55.
PuglieseANilchianiR. Complexity analysis of fractionated spacecraft architectures. In: Amer. Institute Aeronautics Astronautics Space Forum; September 12-14, 2017; Orlando, FL (2017).
56.
SampathkumarEWalikarHB. On splitting graph of a graph. J Karnatak Univ Sci (1980) 25(13):13–6.
57.
HornRAJohnsonCR. Topics in matrix analysis. Cambridge: Cambridge University Press (1991).
58.
HafeezSFarooqR. Inverse sum indeg energy of graphs. IEEE Access (2019) 7:100860–6. 10.1109/access.2019.2929528
59.
AltassanARatherBAImranM. Inverse sum indeg index (energy) with applications to anticancer drugs. Mathematics (2022) 10:4749. 10.3390/math10244749
60.
YugeK. Graph representation for configurational properties of crystalline solids. J Phys Soc Jpn (2017) 86:024802. 10.7566/jpsj.86.024802
61.
RichterH. Properties of network structures, structure coefficients, and benefit-to-cost ratios. Biosystems (2019) 180:88–100. 10.1016/j.biosystems.2019.03.005
62.
ShattoTACtinkayaEK. Variations in graph energy: A measure for network resilience. In: Proceedings of the 9th International Workshop on Resilient Networks Design and Modeling (RNDM); September 4-6, 2017; Alghero, Italy. p. 1–7.
Summary
Keywords
ISI spectral radius, splitting graph, ISI energy, shadow graph, eigenvalues
Citation
Bilal A, Munir MM, Qureshi MI and Athar M (2023) ISI spectral radii and ISI energies of graph operations. Front. Phys. 11:1149006. doi: 10.3389/fphy.2023.1149006
Received
20 January 2023
Accepted
25 May 2023
Published
13 June 2023
Volume
11 - 2023
Edited by
Emanuel Guariglia, São Paulo State University, Brazil
Reviewed by
Weigang Sun, Hangzhou Dianzi University, China
Petrus Henrique Ribeiro Dos Anjos, Universidade Federal de Catalão, Brazil
Updates
Copyright
© 2023 Bilal, Munir, Qureshi and Athar.
This is an open-access article distributed under the terms of the Creative Commons Attribution License (CC BY). The use, distribution or reproduction in other forums is permitted, provided the original author(s) and the copyright owner(s) are credited and that the original publication in this journal is cited, in accordance with accepted academic practice. No use, distribution or reproduction is permitted which does not comply with these terms.
*Correspondence: Muhammad Mobeen Munir, mmunir.math@pu.edu.pk
Disclaimer
All claims expressed in this article are solely those of the authors and do not necessarily represent those of their affiliated organizations, or those of the publisher, the editors and the reviewers. Any product that may be evaluated in this article or claim that may be made by its manufacturer is not guaranteed or endorsed by the publisher.