
94% of researchers rate our articles as excellent or good
Learn more about the work of our research integrity team to safeguard the quality of each article we publish.
Find out more
ORIGINAL RESEARCH article
Front. Phys., 03 May 2023
Sec. Optics and Photonics
Volume 11 - 2023 | https://doi.org/10.3389/fphy.2023.1146208
This article is part of the Research TopicAdvances in High-Power Lasers for Interdisciplinary ApplicationsView all 23 articles
 Junyu Chai1,2,3
 Wenguang Liu1,2,3*
 Xiaolin Wang1,2,3*Qiong Zhou1,2,3Kun Xie4
 Yujun Wen1,2,3
 Jiangbin Zhang1,2,3Pengfei Liu1,2,3
 Hanwei Zhang1,2,3Dan Zhang1,2,3Zongfu Jiang1,2,3Guomin Zhao1,2,3
Up till now, the spatial and temporal dynamics of transverse mode instability (TMI) in fiber laser oscillator have increasingly attracted a worldwide attention. Here, we develop a high-speed modal decomposition (MD) system to analyze the modal coupling for fiber laser oscillator above the TMI threshold. A set of angular-multiplexing transmission functions (TFs) are designed for simultaneous MD and monitoring the far-field beam profile. The TMI threshold of the deployed fiber laser oscillator is 181 W at a co-pumping power (CPP) of 279 W. As the CPP increases from 318 W to 397 W, the power fluctuations of the output laser become more drastic. The changes of the far-field beam profile and the centroid of far-field spot (COFFS) indicate an increased velocity of energy transfer between modes. The high-speed MD verifies above process and analyzes the modal components, indicating that the single cycle of modal coupling decreases from 11 ms to 4 ms. Otherwise, the strong mode coupling occurs between modes with relatively large weights. The high-speed MD provides a powerful tool to research the TMI effect.
With the remarkable progress of high-power fiber laser (HPFL) in recent years [1, 2], the demands of large-mode-area (LMA) fibers have been increasing. The LMA fibers are commonly referred to as few mode fibers. The V-number of this fiber is normally greater than the cut-off value for single-mode operation (i.e., V = 2.405), since it has a larger core diameter than the single mode fiber (i.e., 8 μm–10 μm) [3]. This leads to an increase weight in the higher-order mode (HOM). Although the HOMs can be reduced by the bending and coiling of optical fiber, the existence of HOMs will cause transverse mode instability (TMI) [4]. When the power reaches a certain threshold, the beam quality degrades [5].
The conventional beam diagnostic methods mainly include the records of spectrum, power and beam quality. However, mode coupling in fiber laser after the occurrence of TMI has not been fully researched. Modal decomposition (MD) is used to analyze transverse mode components in LMA fibers. In recent years, a variety of MD methods have been proposed, involving the spatially and spectrally resolved imaging (S2) [6, 7], low-coherence interferometry [8, 9], numerical analysis [10], wavefront analysis [11], and ring-resonators [12, 13]. The method of S2 and low-coherence interferometry are realized by measuring the interference between different transverse modes according to their different group velocities in the fiber. They are completed by spatial scanning or wavelength scanning, thus consuming several minutes [14]. For numerical analysis, it is mainly based on the iterative optimization algorithm [15]. It takes over hundreds of steps and several minutes due to the large number of optimization parameters. Even though there are several reports based on S2 and numerical analysis with a high-speed, they need off-line data processing [16]. The wavefront analysis relies on the use of wavefront sensors [17]. The method of ring-resonators involves a piezo translator (PZT) [13]. However, the error of these two methods exceeds 10% since the measurement accuracy of HOMs cannot be guaranteed. Compared with other techniques, optical correlation filter (OCF) is suitable for high-speed MD because it only requires straightforward algebraic calculation to obtain the modal weights with a high accuracy above 95% [18]. The implementation of high-speed cameras and high-performance processors using OCF can help to achieve a fast MD.
In this paper, we propose a method of high-speed modal analysis based on OCF, which is beneficial to analyze modal coupling when the TMI occurs. A set of transmission functions (TF)s for the measurement of modal weight and monitoring far-field beam profile are designed and encoded into one computer-generated hologram (CGH). In addition to the use of conventional beam diagnostic methods, the change of modal weight with the increase of pumping power after the occurrence of TMI is monitored.
The weakly guided fibers commonly used in HPFL systems are step-index fibers (SIFs) with a small refractive index difference between the core and the cladding. In the weakly guiding approximation, the electromagnetic fields can be recognized as linearly polarized (LP) modes system [19]. The optical field of each polarization component can be expressed by using the orthogonal basis functions:
where
with
The OCF is a powerful technique for modal analysis [20–22]. The core of OCF is TFs by design, which play key roles as matched filters. The TF is composed of amplitude and conjugate phase information related to eigenmode of LMA fiber laser
where,
Since the Ytterbium (Yb)-doped fiber (YDF) of the fiber laser oscillator to be test has a core diameter of 30 μm (NA = 0.064), the supported eigenmodes at an operating wavelength λ of 1,080 nm are LP01, LP11e, LP11o, LP21e, LP21o, LP02, LP31e, LP31o, LP12e, and LP12o. The mode filtering can be realized via certain bending and coiling of fiber [24–26]. After repeated experiments, we find ten eigenmodes can be limited to six by coiling the YDF in a ∞ shape with a minimum bend diameter of 85 mm. The other four higher HOMs of LP31e, LP31o, LP12e and LP12o sustain complete transmission loss. Thus, we design a total TF which can measure the contents of six modes simultaneously. Removing the TFs of non-transmission modes can help to shrink the range of interest (ROI) of far-field camera to increase the computational efficiency. Besides, a mirror-like TF with a tilting phase is added to monitor the far-field beam profile.
The final TF in our experiments can be expressed as
Then, the final TF is encoded into a phase-only CGH via a coding technique introduced by Arrizón et al. [27].
The experimental system mainly involves an all-fiber laser oscillator and beam diagnostic equipment, as shown in Figure 1. The all-fiber laser oscillator is co-pumped via fiber-coupled laser diodes (LDs) with a stabilized emission wavelength of 976 nm. A number of pump LDs are grouped by a co-sided (6 + 1) × 1 pump-signal combiner (Co-PSC) and inject into the laser oscillation cavity. Three pump ports of the Co-PSC are applied, and the central pump port of the Co-PSC is angle cleaved to prevent facet reflection. The remaining three ports are not used in this experiment. The co-pumping light enters the laser cavity through a high reflection fiber Bragg grating (HR-FBG). The gain fiber is a length of ∼20 m YDF with 30/400 μm core/cladding diameters (NAcore = 0.064), which is coiled in a ∞ shape with a minimum bend diameter of about 85 mm. The length, bend diameter and shape of YDF mainly affect TMI threshold and the number of transmission modes in the fiber. The HR-FBG is inscribed on the end of YDF, which provides a reflectivity of ∼99.9% with a 3 dB bandwidth of ∼4 nm around a central wavelength of ∼1,080 nm. The transmitted light goes through an output coupler fiber Bragg (OC-FBG) with a reflectivity of ∼10% and a 3 dB bandwidth of ∼1.7 nm at a central wavelength of ∼1,080 nm. Then, it is received by a length of 3 m delivery fiber (30/400 μm) and the laser beam output via a quartz block head (QBH). A part of the polymer cladding of delivery fiber is stripped and the inner cladding is coated with high refractive index ointment. The entire all-fiber laser oscillator is water-cooled to avoid thermal damage.
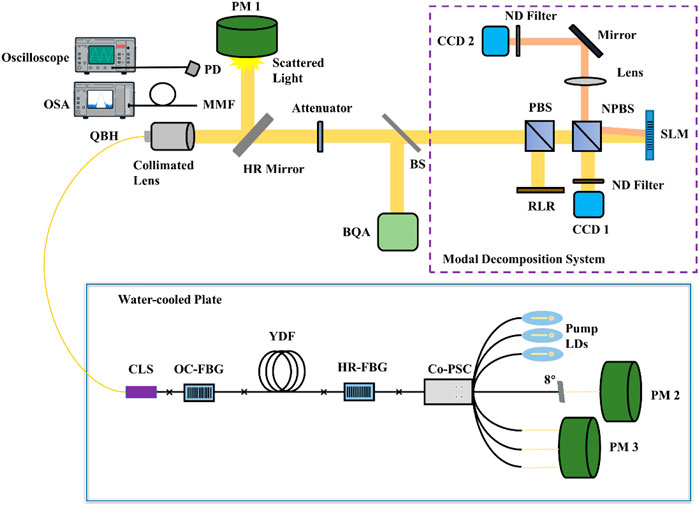
FIGURE 1. A setup of all-fiber laser oscillator and beam diagnostic system.
(OSA: Optical spectrum analyzer; PD: Photodiode; MMF: Multimode fiber; QBH: Quartz block head; PM: Power meter; HR: High reflection; BS: Beam splitter; BQA: Beam quality analyzer; PBS: Polarizing beam splitter; RLR: Residual light receiver; NPBS: Non-Polarizing beam splitter; ND: Neutral density; CCD1: Near-field camera; SLM: Spatial light modulator; CCD2: Far-field camera; CLS: Cladding light stripper; OC: Output coupler; FBG: Fiber Bragg grating; YDF: Ytterbium-doped fiber; Co-PSC: Co-sided pump-signal combiner; LD: Laser diode).
In the experiment, the spectrum, temporal trace, beam quality, and modal content are monitored simultaneously as shown in Figure 1. The collimated beam first passes through a high reflection (HR) mirror. The 99.99% of the light is reflected into the power meter 1 (PM1), and the remaining 0.01% of the light is weaken by the attenuator and then split into two beams via a beam splitter (BS). A beam of light directs to the beam quality analyzer (BQA) to obtain the data of M2, and the second beam of light enters the MD system. The near-field beam profile is monitored by charge-coupled device 1 (CCD1, pixel size: 10 μm, 62.23 fps) for the calibration of the entire optical path before the experiment and the investigation of the beam at a fixed time under test. The specially designed CGH is loaded on the SLM (resolution: 1920 × 1,152, pixel size: 9.2 μm). The beam illuminates the CGH, and then the reflected light is Fourier transformed by a lens. The +first order diffracted light in the far-field plane is recorded via a CCD2 (pixel size: 4.5 μm, 2000 fps) for modal analysis. Besides, the scattered light from the photosensitive surface of PM1 is received by optical spectrum analyzer (OSA), photodetector (PD) and oscilloscope to record the data of spectrum and temporal trace. PM2 and PM3 are applied to monitor the power vibrations of the end-face reflected light and the residual pump light.
The spectrum, output power and beam quality are measured in the experiment. Figure 2A depicts that the central wavelength of the output laser at 100 W is around 1,080 nm, and the full width at half maxima (FWHM) is ∼2 nm. Figure 2B shows the change of standard deviation (STD) of the temporal trace with the increase of co-pumping power (CPP). This fiber laser oscillator has a TMI threshold of 181 W under a CPP of 279 W. The power changes of output laser, residual pump light and end-face reflected light with the increase of CPP are depicted in Figure 2C. After the occurrence of TMI, the output power continues to decrease from 181 W to 100 W with the increase of CPP from 318 W to 397 W. The decrease of the output laser results in the increase of residual pump light and end-face reflected light. Compared with drastic vibrations of the output laser and the residual pump light, the change of the end-face reflected light is relatively weak, i.e., only from 0.7 W to 6.2 W. The is because that the central pump port of Co-PSC is cleaved with an angle of 8, which weakens the return light. When there is no TMI, the beam quality remains at 1.55. Figure 2D shows that the beam quality is about 1.81 at the TMI threshold of 181 W.
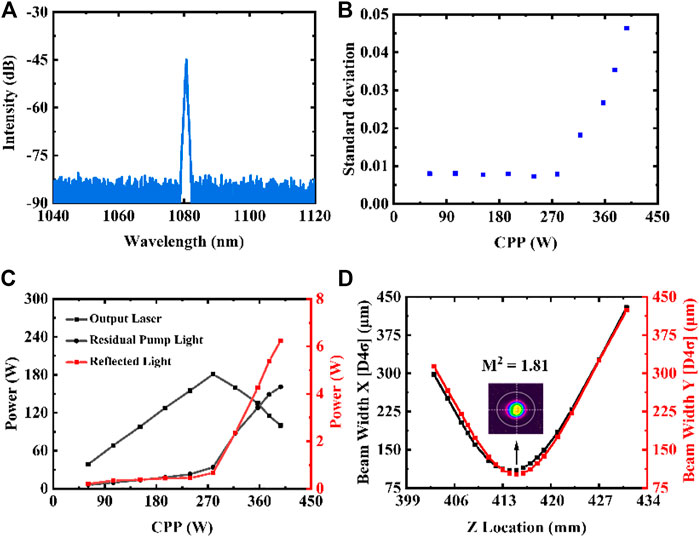
FIGURE 2. Laser output characteristics. (A) The spectrum at 100 W. (B) The STD variation of the temporal trace with the increase of CPP. (C) The power changes of output laser, residual pump light and end-face reflected light with the increase of CPP. (D) The beam quality at 181 W.
When TMI occurs, the near-field beam profile is captured via CCD1. Figure 3A extracts ten frames of the pictures during 132 m at 318 W. Even the low-speed of 63.2 fps can catch the beam fluctuation. The far-field beam profile is recorded via CCD2 with a speed of 2000 fps. Figure 3B depicts the variation in the first 5 ms at multiple CPPs (318 W, 357 W, 377 W, and 397 W). It can be clearly seen that the velocity of energy transfer is accelerated with the increase of CPP. Especially when the CPP is 397W, the far-field beam profile is obviously split from one lobe to two lobes. This implies intense modal couplings between fundamental mode and higher-order modes.
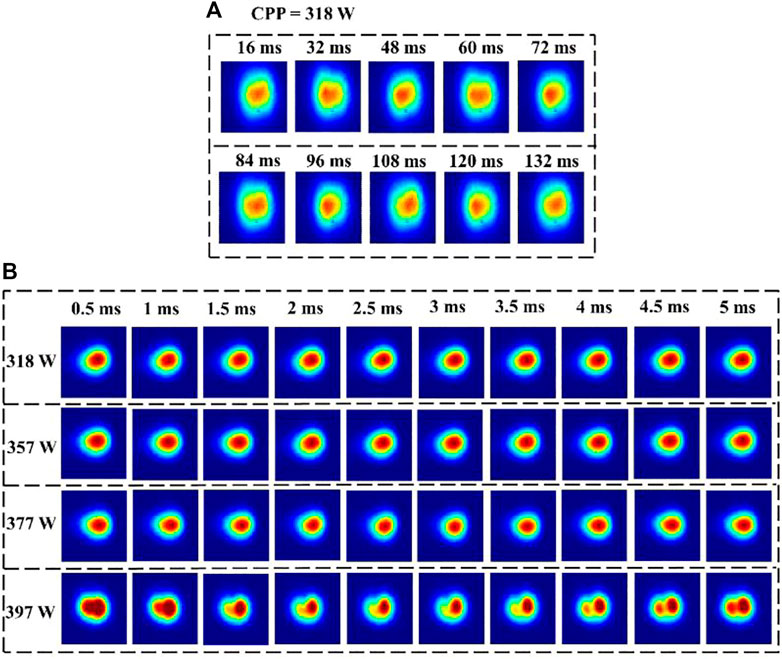
FIGURE 3. The beam profiles of near-field (A) and far-field (B) captured from CCD1 and CCD2.
To clearly investigate beam fluctuation above the TMI threshold, we compute the centroid of the far-field spot (COFFS) at each CPP, as shown in Figure 4. At the beginning of TMI, the area of COFFS is only within one pixel (Figure 4A). Then, it is mainly distributed within seven pixels (Figure 4B) and nine pixels (Figure 4C) at the CPP of 357 W and 377 W. As the CPP reaches 397 W, it is further broadened to ten point five pixels (Figure 4D). This gradual expansion implies an intensified strength of the multimode coupling.
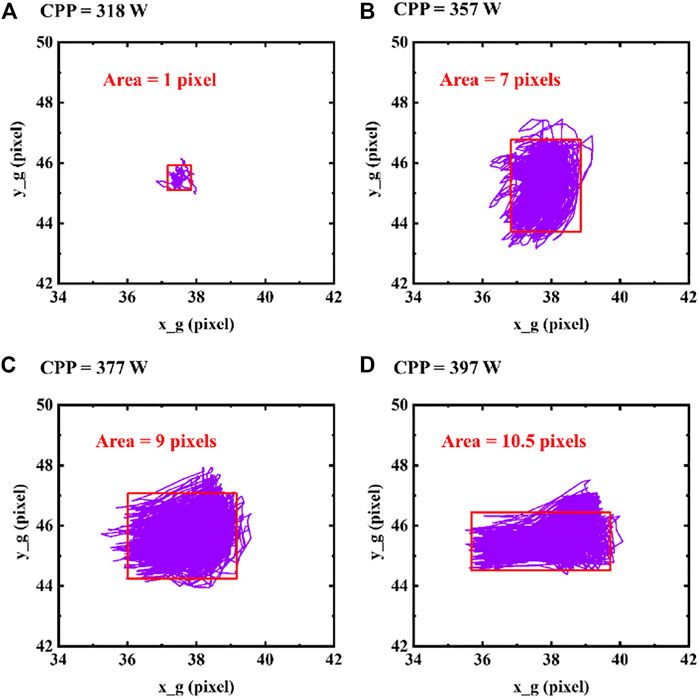
FIGURE 4. The fluctuation of the COFFS at the CPP of (A) 318 W, (B) 357 W, (C) 377 W, and (D) 397 W.
To analyze the change of modal component, we carry out a high-speed MD with a rate of 2 kHz.The MD results are shown in Figure 5, and the accuracies are about 98%. The modal coupling reflects the energy transfer between multimode and it clearly shows periodic change within the selected 50 ms window at multiple CPPs. At the onset of TMI, modal coupling is mainly among LP01, LP11e, LP11o, and LP02, while LP21e and LP21o are relatively stable (Figure 5A). As the CPP increases from 318 W to 397W, the single coupling cycle shortens from 11 ms to 4 ms, indicating an increased velocity of energy transfer (Figure 5A–D). More modes (LP21e and LP21o) are involved in the coupling process from 357 W. The MD results demonstrate the modal coupling becomes complex with the increase of CPP. Otherwise, there is a drastic modal coupling between modes with large modal weights (LP01, LP11e, LP11o, and LP02), while those with less modal weight (LP21e and LP21o) have relatively weak coupling. Thus, it is inferred that TMI can be suppressed by mainly breaking the coupling between modes with large modal weight.
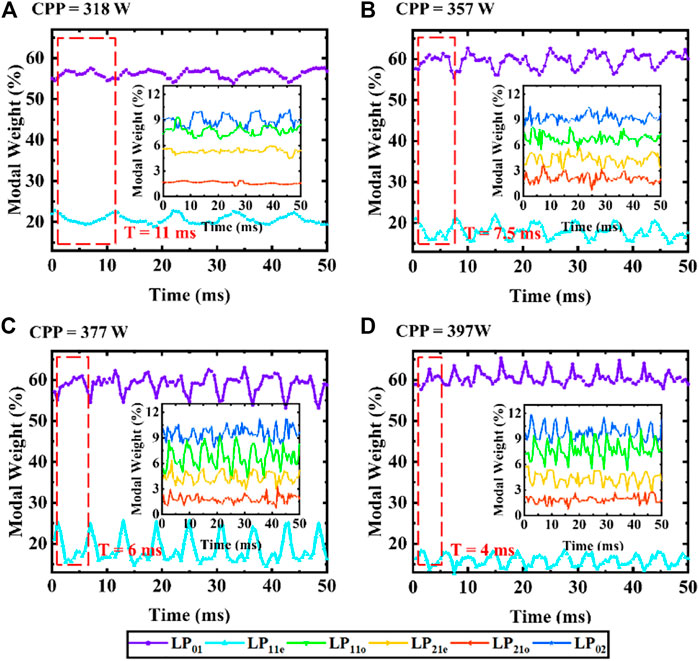
FIGURE 5. MD results in 50 ms windows at the CPP of (A) 318 W, (B) 357 W, (C) 377 W, and (D) 397 W.
Furthermore, the rate of MD depends on the performance of far-field camera and processors. The high-performance processors in current system are based on FPGA with a bandwidth of 100 kHz. To realize a faster MD for investigating TMI with even faster coupling speed, multi-element PD with pin-holes can be used to replace the far-field camera. Each beam of + first diffracted light with modal information illuminates on a photosensitive surface. Then, the intensities on the sub-optical axes are collected by the multi-element PD with pin holes, and they are transmitted to the FPGA for the calculation of modal weights. Then, the performance of this MD system can be improved to∼100 kHz with current processors. However, it is complicated to calibrate the optical path and locate the modal detection point, since the beam profile cannot be viewed via the multi-element PD. Besides, the power of diffracted light behind the hole is weak to a few nanowatts and hard to be detected, thus an extra system for weak opto-electrical signal processing is needed.
In summary, we present a high-speed MD to characteristic modal coupling properties above the TMI threshold. A set of angular-multiplexing TFs is designed for simultaneous MD and monitoring the far-field beam profile. The TMI threshold of the deployed fiber laser oscillator is 181 W at a CPP of 279 W. We find the velocity of energy transfer accelerates with the increase of CPP from 318 W to 397 W. The high-speed MD demonstrates this and analyzes the change of modal components. The MD results show the single cycle of modal coupling decreases from 11 ms to 4 ms. The strong modal coupling occurs mainly between modes with relatively large weight. The characteristic of modal coupling obtained from high-speed MD is conducive to evaluate the effect of TMI mitigation in fiber lasers.
The original contributions presented in the study are included in the article/supplementary material, further inquiries can be directed to the corresponding author.
Investigation, JC, WL, and XW; resources, QZ, PL, HZ, DZ, ZJ, KX, and YW; writing—original draft preparation, JC; writing—review and editing, JC, JZ, and XW; supervision, WL and GZ. All authors have read and agreed to the published version of the manuscript.
This work was supported by National Natural Science Foundation of China (12074432, 12204540); Science and Technology Innovation Program of Hunan Province (2021RC3038).
The authors would like to thank Lingfa Zeng, Penglin Zhong, and Xiaoyong Xu for their assistance in the whole experiment.
The authors declare that the research was conducted in the absence of any commercial or financial relationships that could be construed as a potential conflict of interest.
All claims expressed in this article are solely those of the authors and do not necessarily represent those of their affiliated organizations, or those of the publisher, the editors and the reviewers. Any product that may be evaluated in this article, or claim that may be made by its manufacturer, is not guaranteed or endorsed by the publisher.
1. Nilsson J, Payne DN. High-power fiber lasers. Science (2011) 332:921–2. doi:10.1126/science.1194863
2. Zervas MN, Codemard CA. High power fiber lasers: A review. IEEE J Sel Top Quan Electron. (2014) 20:219–41. doi:10.1109/jstqe.2014.2321279
3. Richardson DJ, Fini JM, Nelson LE. Space-division multiplexing in optical fibres. Nat Photon (2013) 7(5):354–62. doi:10.1038/nphoton.2013.94
4. Jauregui C, Limpert J, Tünnermann A. High-power fibre lasers. Nat Photon (2013) 7(11):861–7. doi:10.1038/nphoton.2013.273
5. Jauregui C, Stihler C, Limpert J. Transverse mode instability. Adv Opt Photon (2020) 12:429–84. doi:10.1364/aop.385184
6. Nicholson JW, Yablon AD, Ghalmi S. Spatially and spectrally resolved imaging of modal content in large-mode-area fibers. Opt Express (2008) 16:7233–43. doi:10.1364/oe.16.007233
7. Nicholson JW, Yablon AD, Fini JM, Mermelstein MD. Measuring the modal content of large-mode-area fibers. IEEE J Sel Top Quan Electron. (2009) 15:61–70. doi:10.1109/jstqe.2008.2010239
8. Ma YZ, Sych Y, Onishchukov G, Ramachandran S, Peschel U, Schmauss B, et al. Fiber-modes and fiber-anisotropy characterization using low-coherence interferometry. Appl Phys B (2009) 96:345–53. doi:10.1007/s00340-009-3517-9
9. Demas J, Ramachandran S. Sub-second mode measurement of fibers using C^2 imaging. Opt Express (2014) 22:23043–56. doi:10.1364/oe.22.023043
10. Brüning R, Gelszinnis P, Schulzes C, Flamm D, Duparré M. Comparative analysis of numerical methods for the mode analysis of laser beams. Appl Opt (2013) 52:7769–77. doi:10.1364/ao.52.007769
11. Paurisse M, Lévèque L, Hanna M, Druon F, Georges P. Complete measurement of fiber modal content by wavefront analysis. Opt Express (2012) 20:4074–84. doi:10.1364/oe.20.004074
12. Andermahr N, Theeg T, Fallnich C. Novel approach for polarization-sensitive measurements of transverse modes in few-mode optical fibers. Appl Phys B (2008) 91:353–7. doi:10.1007/s00340-008-3011-9
13. Andermahr N, Fallnich C. Interaction of transverse modes in a single-frequency few-mode fiber amplifier caused by local gain saturation. Opt Express (2008) 16:8678–84. doi:10.1364/oe.16.008678
14. Gray DR, Sandoghchi SR, Wheeler NV, Jasion GT, Wooler JP, Petrovich MN, et al. Towards real-time mode content characterization of multimode fibers. In: 2014 The European Conference on Optical Communication (ECOC); 21-25 September, 2014; Cannes, France (2014). p. 1–3.
15. Shapira O, Abouraddy AF, Joannopoulos JD, Fink Y. Complete modal decomposition for optical waveguides. Phys Rev Lett (2005) 94:143902. doi:10.1103/physrevlett.94.143902
16. Stutzki F, Otto H-J, Jansen F, Gaida C, Jauregui C, Limpert J, et al. High-speed modal decomposition of mode instabilities in high-power fiber lasers. Opt Lett (2011) 36:4572–4. doi:10.1364/ol.36.004572
17. Lizhi D, Wenjin L, Ping Y, Hu Y, Xiang L, Shuai W, et al. Transformations of high-order mode Hermite–Gaussian beams using a deformable mirror. Laser Phys (2013) 23:035004. doi:10.1088/1054-660x/23/3/035004
18. Xie K, Liu W, Zhou Q, Huang L, Jiang Z, Xi F, et al. Adaptive phase correction of dynamic multimode beam based on modal decomposition. Opt Express (2019) 27:13793–802. doi:10.1364/oe.27.013793
19. Flamm D, Schulze C, Naidoo D, Schroter S, Forbes A, Duparre M. All-digital holographic tool for mode excitation and analysis in optical fibers. J Lightwave Technol (2013) 31(7):1023–32. doi:10.1109/jlt.2013.2240258
20. Kaiser T, Flamm D, Schröter S, Duparré M. Complete modal decomposition for optical fibers using CGH-based correlation filters. Opt Express (2009) 17:9347–56. doi:10.1364/oe.17.009347
21. Flamm D, Schmidt OA, Schulze C, Borchardt J, Kaiser T, Schröter S, et al. Measuring the spatial polarization distribution of multimode beams emerging from passive step-index large-mode-area fibers. Opt Lett (2010) 35:3429–31. doi:10.1364/ol.35.003429
22. Schulze C, Naidoo D, Flamm D, Schmidt OA, Forbes A, Duparré M. Wavefront reconstruction by modal decomposition. Opt Express (2012) 20:19714–25. doi:10.1364/oe.20.019714
23. Chai J, Liu W, Zhang J, Xie K, Lu Y, Li C, et al. Influence of aberrations on modal decomposition for LMA fiber laser systems. Front Phys (2022) 9. doi:10.3389/fphy.2021.796666
24. Hansen K, Alkeskjold T, Broeng J, Lægsgaard J. Theoretical analysis of mode instability in high-power fiber amplifiers. Opt Express (2013) 21(2):1944–71. doi:10.1364/oe.21.001944
25. Tao R, Wang X, Xiao H, Zhou P, Liu Z. Theoretical study of the threshold power of mode instability in high-power fiber amplifiers. Acta Opt Sin (2014) 34(1):0114002. doi:10.3788/aos201434.0114002
26. Tao R, Su R, Ma P, Wang X, Xiao H, Zhou P. Suppressing mode instabilities by optimizing the fiber coiling methods. Laser Phys Lett (2017) 14(2):025101. doi:10.1088/1612-202x/aa4fbf
Keywords: transverse mode instability, mode decomposition, modal coupling, fiber laser, optical correlation filter
Citation: Chai J, Liu W, Wang X, Zhou Q, Xie K, Wen Y, Zhang J, Liu P, Zhang H, Zhang D, Jiang Z and Zhao G (2023) High-speed modal analysis of dynamic modal coupling in fiber laser oscillator. Front. Phys. 11:1146208. doi: 10.3389/fphy.2023.1146208
Received: 17 January 2023; Accepted: 20 April 2023;
Published: 03 May 2023.
Edited by:
Bofeng Zhu, Nanyang Technological University, SingaporeCopyright © 2023 Chai, Liu, Wang, Zhou, Xie, Wen, Zhang, Liu, Zhang, Zhang, Jiang and Zhao. This is an open-access article distributed under the terms of the Creative Commons Attribution License (CC BY). The use, distribution or reproduction in other forums is permitted, provided the original author(s) and the copyright owner(s) are credited and that the original publication in this journal is cited, in accordance with accepted academic practice. No use, distribution or reproduction is permitted which does not comply with these terms.
*Correspondence: Wenguang Liu, bHdnLmtldmluQDE2My5jb20=; Xiaolin Wang, Y2hpbmFwaG90b25pY3NAMTYzLmNvbQ==
Disclaimer: All claims expressed in this article are solely those of the authors and do not necessarily represent those of their affiliated organizations, or those of the publisher, the editors and the reviewers. Any product that may be evaluated in this article or claim that may be made by its manufacturer is not guaranteed or endorsed by the publisher.
Research integrity at Frontiers
Learn more about the work of our research integrity team to safeguard the quality of each article we publish.