
95% of researchers rate our articles as excellent or good
Learn more about the work of our research integrity team to safeguard the quality of each article we publish.
Find out more
ORIGINAL RESEARCH article
Front. Phys. , 03 March 2023
Sec. Optics and Photonics
Volume 11 - 2023 | https://doi.org/10.3389/fphy.2023.1145882
This article is part of the Research Topic Advances in Bio-Optical Imaging View all 7 articles
 Dan Cheng1†
 Ziyi Zhang2†
 Yilin Qiao1
 Yufeng Ye1
 Xueying Zhu1
 Kaiming Ruan1
 Meixiao Shen1Kaiyuan Liu2Jiwei Tao1Yiqi Chen3
 Lijun Shen3*
 Peng Li2,4*
Purpose: To evaluate the feasibility of an intraoperative optical coherence tomography angiography (iOCTA) system integrated with a surgical microscope, and further investigate the real-time retinal vascular change in intraocular pressure fluctuation during surgery in rabbits.
Methods: The feasibility of this system was confirmed through fundus angiography imaging in 12 rabbit eyes during simulated surgeries in 4 groups, 30 mmHg infusion pressure (IP), 60 mmHg IP, 100 mmHg IP, and control groups. The eyes were removed after seven days. Retinal ganglion cell (RGC) damage was analyzed histologically.
Results: The OCTA technique can acquire images of retinal capillaries in rabbit eyes and quantitatively analyzing the vessel density. In the 30 mmHg IP group, there was no significant difference in the retinal vasculature during the operation. The OCTA signal and the RGCs decreased significantly in the 60 and 100 mmHg groups.
Conclusions: The system can real-timely monitor the human retinal vasculature in high-resolution images and help surgeons to make decision during intraocular surgery.
Intraocular surgery with fluid infusion induces substantial fluctuations in intraocular pressure (IOP). Wide fluctuations in IOP have been documented during cataract surgery and vitrectomy in human studies and animal models [1–5]. These fluctuations might lead to perioperative complications such as expulsive choroidal hemorrhage, retinal ischemia, paracentral acute middle maculopathy (PAMM), non-arteritic anterior ischemic optic neuropathy (NAION), and further retinal ischemia-reperfusion (IR) injury [6–8]. Rapidly fluctuating IOP blocks the retrograde transport of neurotrophic factors through retinal axons, thus impeding the delivery of essential neurotrophins to the retina and leading to various retinal pathological changes [1, 9]. Retinal ganglion cell injury is reported to be one of the most susceptible injuries to retinal ischemia [10, 11].
Recognizing real-time variation in retinal blood circulation according to the transient IOP could improve the safety of intraocular surgery. However, inconsistent changes in retinal vasculature after surgery were found though similar fluctuations in IOP were observed during surgery [6, 7]. In particular, eyes with compromised retinal and/or optic nerve blood flow are more susceptible to IOP fluctuation [4]. But limited information is available on intraoperative retinal microvasculature, mainly due to technical insufficiency [12].
Intraoperative optical coherence tomography (iOCT) technology has markedly developed in the past few years [13]. More recently, microscope-integrated optical coherence tomography angiography (MIOCTA) has provided new insights into retinal vascular disease [14–16]. Numerous clinical applications have demonstrated that the use of iOCT provides instructive guidance for surgeons to modify intraoperative decisions [17, 18]. However, the current iOCT does not allow for real-time tracking display and require surgeons to stop the operation. Previous OCTA systems were mostly designed as tabletop units for adults and cooperative children, or neonatal intensive care units and operating rooms in neonates with retinopathy of prematurity (ROP). In our previous work, we proposed an intraoperative OCT and OCTA system based on a standard surgical microscope to record the corneal and fundus image of the subject in real time and help surgeons to make decisions during surgery [19]. In this study, we combined the system with the GPU-based real-time data processing pipeline for real-time and high-quality iOCT angiographic imaging [20]. Furthermore, we applied the system in the rabbit model of intraocular surgery for real-time fundus OCT and OCTA images. We further investigated the real-time retinal vascular change in IOP fluctuation during surgery and correlated it with retinal ganglion cell injury after surgery in rabbits.
A schematic diagram of the overall optical path structure of the intraoperative OCTA system involved in the current study is presented in Figure 1. The system is mainly divided into an OCT module and an operating microscope module. The OCT module is based on a typical spectral-domain OCT structure, and its core components include a light source, reference arm, sample arm, and detector. The light source used was an SLD broadband light source with a center wavelength of 850 nm and a full width at half maximum of 100 nm. The detector uses a spectrometer equipped with a high-speed line array camera, which can provide a line scan rate of 120 kHz, axial resolution of 2.3 um in air, imaging depth of 2.6 mm and signal-to-noise ratio of 102 dB. After the optical path of the sample arm passed through the XY scanning galvanometer device, it was coupled with the imaging optical path of the operating microscope from the side through the second auxiliary interface of the operating microscope (OPMI Lumera 300, Carl Zeiss, Germany), to maintain the ergonomic design of the operating microscope in the axial direction. The designed coupling device matches the threaded structure of the assistant mirror interface, such that the OCT module and surgical microscope module can share a microscope objective lens with a focal length of 200 mm and realize the synchronous focus of the imaging optical path. The operating microscope module uses a non-contact surgical 200D ophthalmoscope system (Oculars, Germany) to achieve fundus imaging, a charge-coupled device (CCD) area camera to obtain real-time imaging results of the microscope, and a three-axis translation stage to carry the subject. During the operation, the surgeon can observe the tissue surface of the subject either through the real-time CCD camera screen of the display user interface or the eyepiece of the surgical microscope, and observe the tissue information in depth of the subject through the real-time OCT or OCTA screen of the user interface. The GPU-based real-time data processing pipeline was developed using CUDA version 11.0, on a 64-bit Windows 10 operating system based on a custom GPU parallel program, equipped with NVIDIA GeForce RTX 2080 Ti GPU, Intel Core i7-9700k 3.60 GHz CPU, and 32.0 GB RAM. Acquired data were transferred from data acquisition buffer to the GPU device memory and sequentially processed by MIOCTA kernel for the computing of intensity, iSNR, and decorrelation matrices. The blood flow signals were generated according to the iSNR, decorrelation matrices and an auto-optimized threshold. Maximum value projection was performed to obtain enface OCTA images. Further, the OCTA images were transferred to the CPU buffer for real-time display. The availability of this program has been identified in our former study [20]. The GPU-based iOCTA data processing pipeline provides ∼174 kHz line processing rate and presents a ∼48 times improvement in processing speed compared to the traditional CPU-based data processing pipeline.
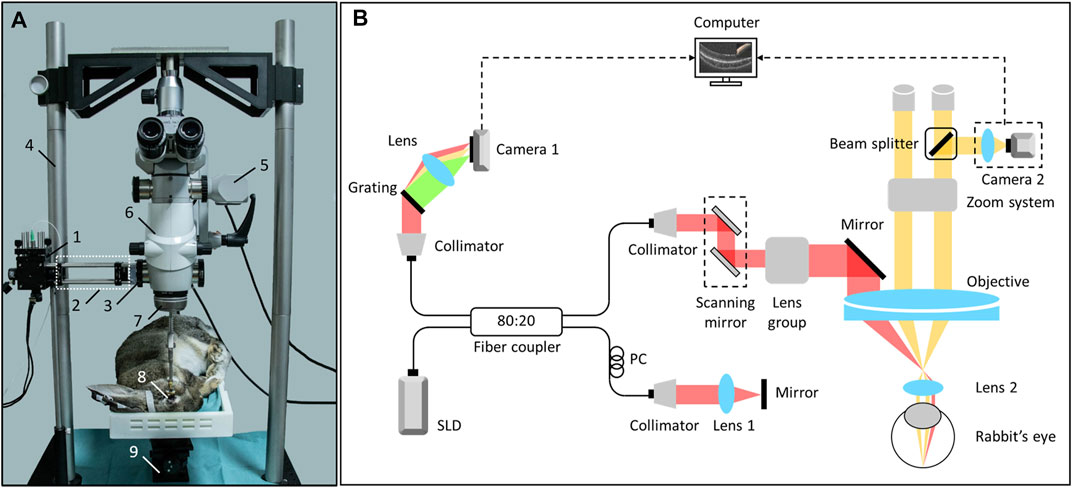
FIGURE 1. The iOCTA system based on a standard surgical microscope. (A) The sample arm and experimental rabbit. 1. scanning mirror, 2. lens group, 3. the coupler for integrating microscope and OCT, 4. custom support used for fixing the surgical microscope, 5. camera 2, 6. main body of the surgical microscope, 7. non-contact surgical 200D ophthalmoscope system (Oculars, German), 8. experimental rabbit’s eye, 9. adjustable stage. (B) Schematic of the system setup, and Lens two is the non-contact lens. OCTA, optical coherence tomography; iOCTA, intraoperative optical coherence tomography angiography.
This study was approved by the Animal Care and Ethics Committee of Wenzhou Medical University (Wenzhou, China), and animal treatment and care were performed according to the ARVO Statement for the Use of Animals in Ophthalmic and Vision Research. Twelve healthy male pigmented rabbits weighing 2.5–3.0 kg were purchased from Zhejiang Academy of Medical Sciences (Hangzhou, China). The right eye of each rabbit was used as the experimental eye and the left eye was used as a control. The animals were reared under a daily 12-h light/12-h dark cycle in animal facilities where the room temperature was kept at 20–26°C and the relative humidity was 40%–70%. The animals had free access to standard food and were provided with fresh vegetables twice a day.
The rabbits were pretreated via intramuscular injections of xylazine (0.1 mL/kg) and anesthetized using ear vein injections of pentobarbital sodium solution (42 mg/kg). The cornea was topically anesthetized with proparacaine 0.5% and the pupil was dilated with topical tropicamide 1%.Pigmented rabbits were placed in a custom-built animal holder. The transient high-infusion model was created using a scleral 23-gauge puncture knife into the vitreous cavity at a 2 mm-distance from the limbus. The trocar was connected to a perfusion tube and bottle of balanced salt solution (BSS). Rabbits were divided according to three different infusion pressures (IP: 30 mmHg for the low IP group, 60 mmHg for the moderate IP group, and 100 mmHg for the high IP group). We adjusted the height of the BSS bottle according to the formula (40.8 cm for low IP group, 81.6 cm for moderate IP group and 136.0 cm for high IP group) [21, 22]. The bottle of the control group was kept at the same level as the perfusion incision in the eye. The bottle was then raised to a level within 1 min of the target height. The bottle was kept for 10 min and then lowered to the initial level within 1 min. Each group consisted of three eyes and all the procedures were performed by a single surgeon.
The OCTA images were captured at several representative time points as follows: before puncture; immediately after puncture; 1, 3, 5, and 10 min during perfusion; and 1, 3, 5, 10, 15, 20, 25, 30, 40, 50, and 60 min after removal of perfusion. The cornea was kept moist with a balanced salt solution to obtain good-quality images. We used the OCTA algorithm based on the inverse signal-to-noise ratio and decorrelation to achieve three-dimensional blood perfusion imaging [23–25].
An area of retinal blood flow was selected and binarized using the same threshold. Assuming that the total number of pixels in the selected area is Np, the calculation formula for the vessel density (VD) of the blood flow signal VD(i) is
where (X, Y) represents the pixel index of the binarized image, A(X, Y) represents the pixel value of the binarized image. To describe the fluctuation of retinal VD during surgery in rabbit eyes, the VD (i = 2) immediately after puncture was used as the baseline value, and each VD value was normalized to obtain the relative VD(RVD) value. The formula for calculating the (i) is
The RVD in each time point was calculated three times and averaged.
The animals were killed 7 days after the surgical procedures. After enucleation, the 3-mm-long optic nerve was preserved. The eyes were fixed in 2% paraformaldehyde and 2.5% glutaraldehyde in phosphate buffered saline (PBS, 10 mmol/L) for 24 h. The eyeball tissue was dehydrated with gradient alcohol, made transparent in xylene, embedded in wax, and sliced through the optic nerve head to obtain 5 μm continuous thick sections. The sections were stained with hematoxylin and eosin (H&E) and analyzed using Case Viewer 2.4.0. To calculate the density of the remaining retinal ganglion cells (RGCs), the number of RGCs was determined within 4–5 mm of the temporal optic nerve by two investigators (YQ and DC) three times per eye*400 fields. The remaining RGC counts in each group were expressed as mean ± standard deviation (SD).
The current study included 12 gray male rabbits that were divided into four groups: 30 mmHg IP, 60 mmHg IP, 100 mmHg IP, and the control group. Each group consisted of three rabbits. In the OCT tomographic image, a retinal structure at the optic disc of the rabbit eye was observed (Figure 2A) and the iOCTA system could record retinal capillaries (Figure 2C). The OCTA and retinal blood vessel images captured by the surgical microscope camera (Figures 2B, C) revealed consistent blood vessel distribution and morphology, and the OCTA image recorded the retinal capillaries more clearly, while quantifying the blood vessel density.
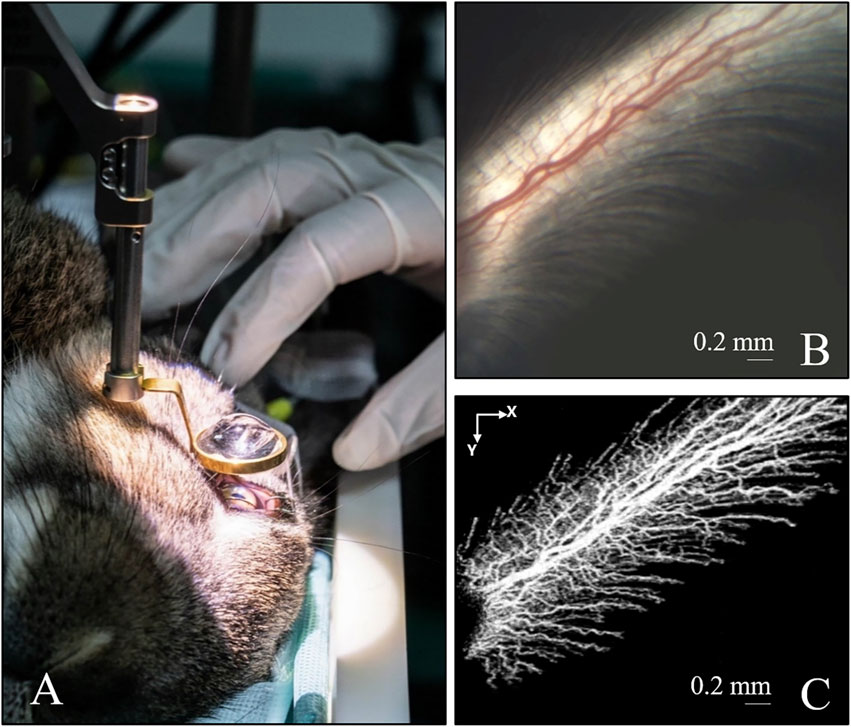
FIGURE 2. Imaging of the retinal blood vessel in rabbit’s eye. (A) Rabbit eye under non-contact surgical 200D ophthalmoscope system. (B) Image captured by the camera of the iOCTA system. (C) The OCTA image of (B) OCTA, optical coherence tomography angiography; iOCTA, intraoperative optical coherence tomography angiography.
The OCTA technique combined with a surgical microscope is a powerful tool for monitoring variations in intraoperative blood perfusion changes, and can acquire images of retinal capillaries in rabbit eyes, while quantitatively analyzing the VD. The control group underwent intraoperative imaging before puncture and within 20 min after puncture, and the RVD value was used as the baseline of the change curve. Three rabbit eyes in the different IP groups were subjected to simulated surgery, and the red curve in the graph shows the mean (n = 3) and standard deviation.
Figure 3 depicts the dynamic changes in the retinal vasculature of the rabbit eyes during surgery in the low IP group. The OCTA images showed that there were no significant differences in the retinal vasculature status at each stage of the 30 mmHg IP group during the operation, including large vessel diameter, capillary distribution, and morphology (Figure 3A). The quantitative analysis curve showed that within 10 min, when IP was acutely increased and maintained at 30 mmHg, the mean RVD decreased steadily (Figure 3B). When the intraoperative IP acutely decreased to the initial value, the mean RVD increased slightly within 3 min, and the highest value was within 110% of the baseline value.
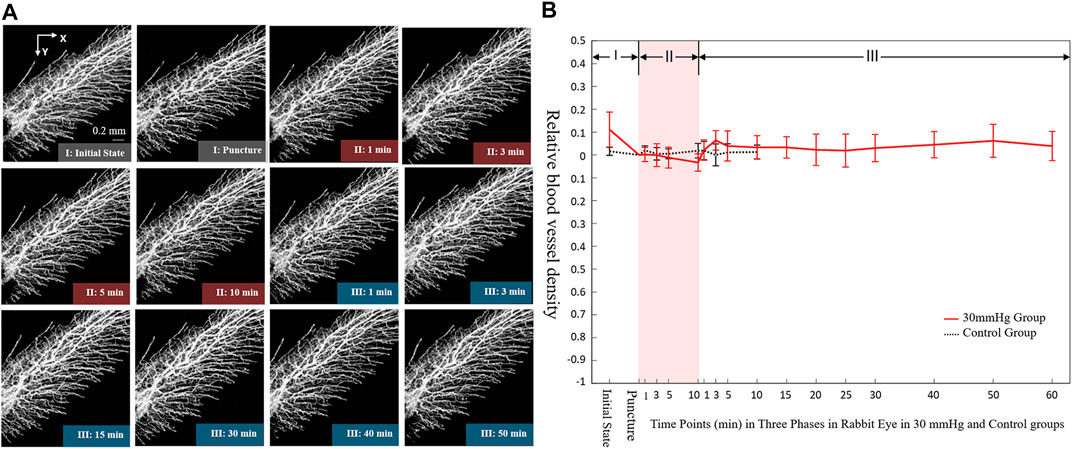
FIGURE 3. Dynamic changes of blood microvasculature by iOCTA (A) and relative blood vessel density (B) in rabbit’s retina during 30 mmHg intraocular perfusion fluctuation. Phase I: Initial state without intraocular perfusion. Phase II: 30 mmHg intraocular perfusion. Phase III: Intraocular perfusion decreased acutely and maintained at the initial state. iOCTA, intraoperative optical coherence tomography angiography.
Figure 4 shows the dynamic changes in the retinal vasculature of rabbit eyes during surgery in the 60 mmHg IP group. The OCTA images showed the various stages of the intraoperative moderate IP fluctuation (Figure 4A). When the IP acutely increased to 60 mmHg, the retinal blood flow was significantly reduced within 1 min. The diameter of the large blood vessels was slightly reduced and the capillary signal almost disappeared. Retinal blood perfusion tended to gradually decrease within 10 min of maintaining an IP of 60 mmHg. Subsequently, the IP was acutely reduced to the initial value, and the RVD quickly recovered within 3 min. The quantitative analysis curve demonstrated that when the IP increased acutely, the mean retinal relative VD decreased significantly to less than 20% of the baseline value within 1 min (Figure 4B). After maintaining a pressure of 60 mmHg for 10 min, the RVD decreased slowly. When the IP was acutely reduced to the initial value, the retinal RVD increased rapidly within 3 min, reaching 120% of the baseline value.
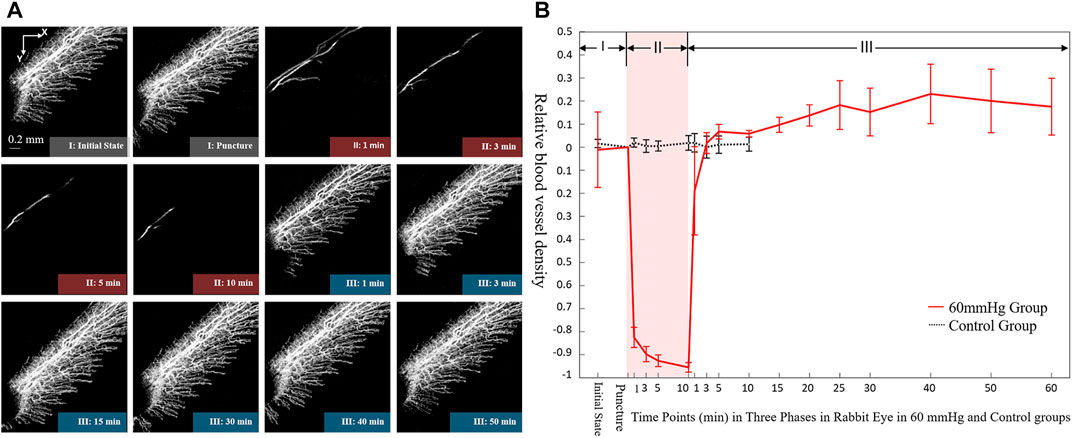
FIGURE 4. Dynamic changes of blood microvasculature by iOCTA (A) and relative blood vessel density (B) in rabbit’s retina during 60 mmHg intraocular perfusion fluctuation. Phase I: Initial state without intraocular perfusion. Phase II: 60 mmHg intraocular perfusion. Phase III: Intraocular perfusion decreased acutely and maintained at the initial state. iOCTA, intraoperative optical coherence tomography angiography.
Figure 5 shows the dynamic changes in the retinal vasculature of rabbit eyes during surgery in the 100 mmHg IP group. The OCTA images showed that when the IP was acutely increased and maintained at 100 mmHg during the operation, the retinal blood flow signal disappeared within 1 min (Figure 5A). When IP was acutely reduced to the initial value, the retinal blood flow recovered within 30 min. The blood flow of the large vessels first began to recover, followed by that of the capillaries. After the IP was stabilized for 30 min, the retinal blood flow exceeded the initial value. The quantitative analysis curve showed that when the IP was acutely increased within 10 min and maintained at 100 mmHg, the retinal relative VD decreased significantly within 1 min and disappeared (Figure 5B). When the IP acutely decreased to the initial value, the retinal relative VD began to recover within 1 min, rose slowly to exceed the initial value within 15 min, and reached > 120% of the baseline value after 50 min.
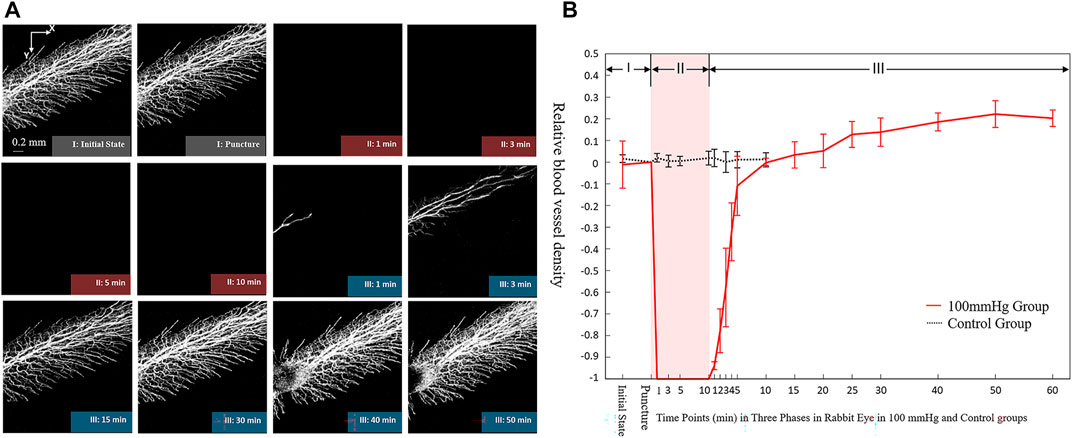
FIGURE 5. Dynamic changes of blood microvasculature by iOCTA(A) and relative blood vessel density (B) in rabbit’s retina during 100 mmHg intraocular perfusion fluctuation. Phase I: Initial state without intraocular perfusion. Phase II: 100 mmHg intraocular perfusion. Phase III: Intraocular perfusion decreased acutely and maintained at the initial state.
Among the representative graphs of HE staining in different groups, the retinal structure, especially the RGC of the control group, was clear and complete (Figure 6A), with an RGC count of 41.0 ± 23.5. In the 30 mmHg IP group, there was no obvious loss of RGC (Figure 6B) and the RGC count was 40.9 ± 20.1. In the 60 mmHg IP group, the RGCs were slightly reduced (Figure 6C), and the RGC count was 38.7 ± 18.0. In the 100 mmHg IP group, the RGCs were significantly reduced and the RGCs count was 19.6 ± 1.84 (Figure 6D). The current study shows that acute IP elevation leads to significant damage to the RGCs.
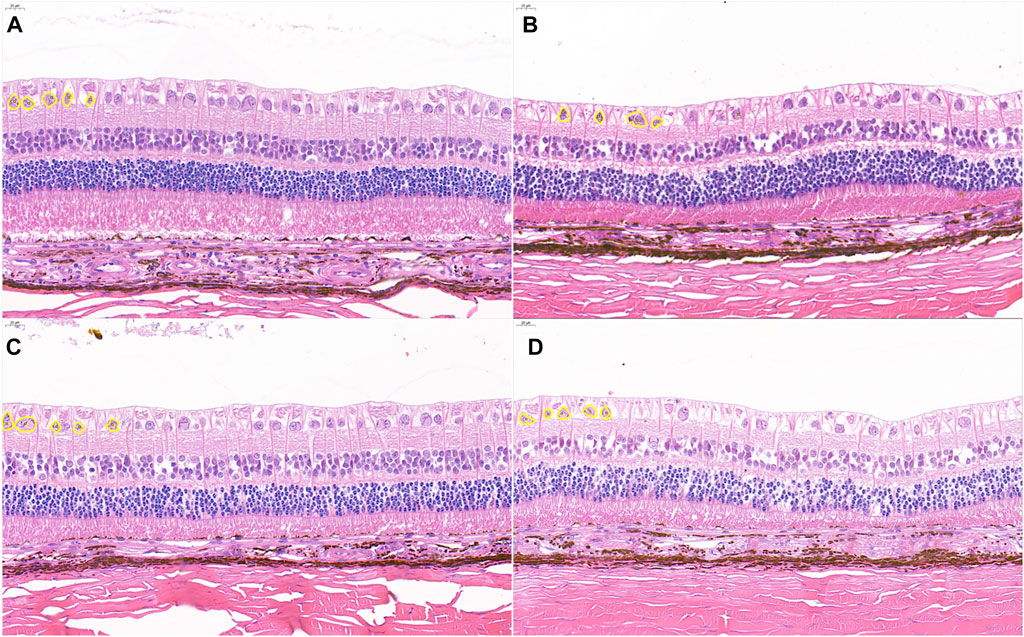
FIGURE 6. Representative photomicrographs showing histological appearance with H&E staining. (A) Control group. (B) 30 mmHg IP group. (C) 60 mmHg IP group. (D) 100 mmHg IP group. Retinal ganglion were outlined with yellow circle. Scale bars: 20 μm. H&E, hematoxylin and eosin; IP, intraocular perfusion.
The current study proposes an iOCTA system combined with the GPU-based real-time data processing pipeline for real-time monitoring of the retinal structure and vasculature in high-resolution images during intraocular surgery. Combining the dynamic process of retinal blood flow with IP in rabbit eyes and the analysis of RGC damage in retinal slices, under low intraoperative IP fluctuations, the retinal blood flow status was stable overall, and the number of RGCs was similar to that of the control group. In the moderate IP group, the retinal vasculature fluctuated with IP. At peak IP, the retinal relative VD decreased to less than 10% of the baseline value, the capillaries had no blood signal, and the RGCs were slightly reduced. In the high IP group, the fluctuation of the retinal vasculature with IP was more significant, and there was no obvious blood signal under peak IP. Furthermore, RGCs were significantly reduced. Assuming that the residual RGCs represent to a certain extent the degree of postoperative retinal damage, the feasibility of the iOCTA system for real-time monitoring of intraoperative retinal structure and blood flow changes was further confirmed.
In the current study, no significant difference of retinal vasculature and no obvious loss of RGC were found in the 30 mmHg group. However, the OCTA signal and the RGCs decreased significantly in the 60 and 100 mmHg groups, which indicated that the OCTA imaging reflect the simultaneous fundus vasculature damage rather than IOP fluctuation. This was consistent with previous studies that similar intraoperative IOP fluctuations would lead to inconsistent changes in retinal blood flow [6, 7]. When IOP exceed the mean ocular perfusion pressure, the retinal vascular perfusion will be insufficient and even disappeared. The recovery of blood flow will cause retinal ischemia reperfusion injury (RIRI) [26, 27]. RGC plays a key role in the process of advanced visual processing, and is vulnerable to ischemia and hypoxia [28]. The RIRI caused by acute IOP fluctuation is related to the degree of ischemia, which leads to different degrees of RGC apoptosis.
In recent years, OCT has been introduced into the operating room and has brought new insights into the surgical management of ophthalmic conditions [13]. Using intraoperative OCT, surgeons are able to obtain immediate feedback on the status of the surgical procedures, including lamellar keratoplasty, full-thickness penetrating keratoplasty, cataract surgery, glaucoma, and vitreous surgeries [18, 29]. In 2019, Christian et al presented the initial handheld OCT angiography images from healthy adult volunteers and young children under anesthesia [15], predicting the possibility of intraoperative OCTA. OCTA can provide similar information without fluorescein dye injection, and could be used to visualize both retinal and choroidal vasculature in theory. The MIOCTA was demonstrated to be used in young children with retinal vascular disease, and allow study of pathological changes in smaller retinal vessels in the retinal periphery that were obscured in fluorescein angiography by leakage or staining [14–16].During vitreoretinal surgery, this system would potentially be applied to monitor global or regional loss or gain in perfused vessels, such as on removal of fibrovascular proliferation and release of traction both for adults and children. Moreover, the system also could be applied to the intraoperative guidance of retinal laser photocoagulation for confirming the boundary of non-perfusion zone.
Through a simple and reliable coupling structure, the OCTA technology and surgical microscope were integrated to monitor the retinal blood flow during ophthalmic surgery in rabbit eyes. Furthermore, the MIOCT system was able to quantitatively analyze the dynamic variation of the retinal vasculature with intraocular perfusion. Based on a phase-stabilized spectral domain OCT system, the current study obtained images with an axial resolution of 2.3 μm and a signal-to-noise ratio of 102 dB at an A-line acquisition speed of 120 kHz. Compared with previous technical indicators of the existing OCTA research [16, 19], this iOCTA system achieved higher signal-to-noise ratio imaging at a faster imaging speed, and the obtained blood flow image had a better axial resolution and contrast angiography contrast. Improved image capture and processing speed will allow real-time feedback. Furthermore, real-time monitoring of dynamic changes in retinal capillaries during intraocular surgery is helpful for intraoperative decision-making and postoperative visual function assessment in intraocular surgery, such as corneal surgery, phacoemulsification, or vitrectomy.
The iOCTA system still has its limitations. Although this system achieved intraoperative high-resolution blood flow imaging, it is necessary to further improve the utilization of light energy and real-time imaging, and eliminate the image artifacts. To improve the utilization rate of light energy, because the visible light band is the optimal imaging band of the existing commercial surgical microscope, the transmittance of the objective lens in the OCT imaging band is approximately 90%, and there is a certain loss of light energy. Therefore, future research is needed to improve the coating of the microscope objective so it can have the highest possible transmittance in both visible light and OCT imaging bands. In contrast, a spectrometer line-scan camera with a higher line-scan rate can be used. The imaging speed can be improved without affecting the lateral pixel resolution in a smaller scan range, for example, a 2 × 2 mm2 area of the retina in a rabbit eye. To eliminate imaging artifacts of different types, eye-tracking systems and motion correction techniques can be used to eliminate the artifacts caused by eye movements [30–32].In addition, the MIOCTA system has a limited imaging field to the midperiphery. Further image processing and optimization of image capture might improve this shortcoming.
The current study developed an iOCTA system integrated with a surgical microscope and combined with the GPU-based real-time data processing pipeline. To real-timely reflect the intraoperative damage of retinal blood flow and provide feedback to surgeons, we realized the in vivo synchronous recording of fundus blood perfusion in the rabbit eye using the iOCTA system. Further optimization of this system may provide important information of human retinal vasculature during surgery.
The raw data supporting the conclusion of this article will be made available by the authors, without undue reservation.
The animal study was reviewed and approved by the Animal Care and Ethics Committee of Wenzhou Medical University.
LS and PL initiated the study design. ZZ and KL improved the iOCTA system. DC, ZZ, and YQ performed the experiment. DC, XZ, and KR assisted in the collation and analysis of the data. DC wrote the paper. MS, JT, and YC provided the essential suggestions. All authors reviewed the study protocol and approved the final manuscript.
National Natural Science Foundation of China (Grant No. 81900910 and No. 62075189), Zhejiang Provincial Natural Science Foundation of China (No. LR19F050002, No. LQ19H20003), Basic Scientific Research Project of Wenzhou (No. Y20210194).
The authors declare that the research was conducted in the absence of any commercial or financial relationships that could be construed as a potential conflict of interest.
All claims expressed in this article are solely those of the authors and do not necessarily represent those of their affiliated organizations, or those of the publisher, the editors and the reviewers. Any product that may be evaluated in this article, or claim that may be made by its manufacturer, is not guaranteed or endorsed by the publisher.
1. Moorhead LC, Gardner TW, Lambert HM, O'Malley RE, Willis AW, Meharg LS, et al. Dynamic intraocular pressure measurements during vitrectomy. Arch Ophthalmol (2005) 123(11):1514–23. doi:10.1001/archopht.123.11.1514
2. Kim YJ, Park SH, Choi KS. Fluctuation of infusion pressure during microincision vitrectomy using the constellation vision system. Retina (2015) 35(12):2529–36. doi:10.1097/iae.0000000000000625
3. Vasavada V, Raj SM, Praveen MR, Vasavada AR, Henderson BA, Asnani PK. Real-time dynamic intraocular pressure fluctuations during microcoaxial phacoemulsification using different aspiration flow rates and their impact on early postoperative outcomes: A randomized clinical trial. J Refract Surg (2014) 30(8):534–40. doi:10.3928/1081597x-20140711-06
4. Sugiura Y, Okamoto F, Okamoto Y, Hiraoka T, Oshika T. Intraocular pressure fluctuation during microincision vitrectomy with constellation vision system. Am J Ophthalmol (2013) 156(5):941–7.e1. doi:10.1016/j.ajo.2013.06.016
5. Xu J, Li Y, Song S, Cepurna W, Morrison J, Wang RK. Evaluating changes of blood flow in retina, choroid, and outer choroid in rats in response to elevated intraocular pressure by 1300 nm swept-source OCT. Microvasc Res (2019) 121:37–45. doi:10.1016/j.mvr.2018.09.003
6. Nakashima H, Iwama Y, Tanioka K, Emi K. Paracentral acute middle maculopathy following vitrectomy for proliferative diabetic retinopathy: Incidence, risk factors, and clinical characteristics. Ophthalmology (2018) 125(12):1929–36. doi:10.1016/j.ophtha.2018.07.006
7. Mansukhani SA, Chen JJ, Fairbanks AM, Foster RC, Erie JC, Baratz KH, et al. A population-based study of anterior ischemic optic neuropathy following cataract surgery. Am J Ophthalmol (2021) 222:157–65. doi:10.1016/j.ajo.2020.08.020
8. Hartsock MJ, Cho H, Wu L, Chen WJ, Gong J, Duh EJ. A mouse model of retinal ischemia-reperfusion injury through elevation of intraocular pressure. J Vis Exp (2016) 113:54065. doi:10.3791/54065
9. Li X, Ye Z, Pei S, Zheng D, Zhu L. Neuroprotective effect of minocycline on rat retinal ischemia-reperfusion injury. Mol Vis (2021) 27:438–56.
10. Resta V, Novelli E, Vozzi G, Scarpa C, Caleo M, Ahluwalia A, et al. Acute retinal ganglion cell injury caused by intraocular pressure spikes is mediated by endogenous extracellular ATP. Eur J Neurosci (2007) 25(9):2741–54. doi:10.1111/j.1460-9568.2007.05528.x
11. Galindo-Romero C, Aviles-Trigueros M, Jimenez-Lopez M, Valiente-Soriano FJ, Salinas-Navarro M, Nadal-Nicolas F, et al. Axotomy-induced retinal ganglion cell death in adult mice: Quantitative and topographic time course analyses. Exp Eye Res (2011) 92(5):377–87. doi:10.1016/j.exer.2011.02.008
12. Ung C, Miller JB. Intraoperative optical coherence tomography in vitreoretinal surgery. Semin Ophthalmol (2019) 34(4):312–6. doi:10.1080/08820538.2019.1620811
13. Ehlers JP. Intraoperative optical coherence tomography: Past, present, and future. Eye (Lond) (2016) 30(2):193–201. doi:10.1038/eye.2015.255
14. Song S, Zhou K, Xu JJ, Zhang Q, Lyu S, Wang R. Development of a clinical prototype of a miniature hand-held optical coherence tomography probe for prematurity and pediatric ophthalmic imaging. Biomed Opt Express (2019) 10(5):2383–98. doi:10.1364/boe.10.002383
15. Viehland C, Chen X, Tran-Viet D, Jackson-Atogi M, Ortiz P, Waterman G, et al. Ergonomic handheld OCT angiography probe optimized for pediatric and supine imaging. Biomed Opt Express (2019) 10(5):2623–38. doi:10.1364/boe.10.002623
16. Chen X, Viehland C, Carrasco-Zevallos OM, Keller B, Vajzovic L, Izatt JA, et al. Microscope-integrated optical coherence tomography angiography in the operating room in young children with retinal vascular disease. JAMA Ophthalmol (2017) 135(5):483–6. doi:10.1001/jamaophthalmol.2017.0422
17. Ehlers JP, Modi YS, Pecen PE, Goshe J, Dupps WJ, Rachitskaya A, et al. The DISCOVER study 3-year results: Feasibility and usefulness of microscope-integrated intraoperative OCT during ophthalmic surgery. Ophthalmology (2018) 125(7):1014–27. doi:10.1016/j.ophtha.2017.12.037
18. Ehlers JP, Dupps WJ, Kaiser PK, Goshe J, Singh RP, Petkovsek D, et al. The prospective intraoperative and perioperative ophthalmic ImagiNg with optical CoherEncE TomogRaphy (PIONEER) study: 2-year results. Am J Ophthalmol (2014) 158(5):999–1007.e1. doi:10.1016/j.ajo.2014.07.034
19. Zhang Z, Zhu T, Cao T, Gong Z, Yao L, Liu K, et al. Swept source intraoperative OCT angiography. J Innovative Opt Health Sci (2021) 14(01):2140009. doi:10.1142/s1793545821400095
20. Deng X, Liu K, Zhu T, Guo D, Yin X, Yao L, et al. Dynamic inverse SNR-decorrelation OCT angiography with GPU acceleration. Biomed Opt Express (2022) 13(6):3615–28. doi:10.1364/boe.459632
21. Zhou L, Chen W, Lin D, Hu W, Tang Z. Neuronal apoptosis, axon damage and synapse loss occur synchronously in acute ocular hypertension. Exp Eye Res (2019) 180:77–85. doi:10.1016/j.exer.2018.12.006
22. Shao Z, Wu J, Du G, Song H, Li SH, He S, et al. Young bone marrow Sca-1 cells protect aged retina from ischaemia-reperfusion injury through activation of FGF2. J Cel Mol Med (2018) 22(12):6176–89. doi:10.1111/jcmm.13905
23. Huang L, Fu Y, Chen R, Yang S, Qiu H, Wu X, et al. SNR-adaptive OCT angiography enabled by statistical characterization of intensity and decorrelation with multi-variate time series model. IEEE Trans Med Imaging (2019) 38(11):2695–704. doi:10.1109/tmi.2019.2910871
24. Li H, Liu K, Cao T, Yao L, Zhang Z, Deng X, et al. High performance OCTA enabled by combining features of shape, intensity, and complex decorrelation. Opt Lett (2021) 46(2):368–71. doi:10.1364/ol.405751
25. Zhang Y, Li H, Cao T, Chen R, Qiu H, Gu Y, et al. Automatic 3D adaptive vessel segmentation based on linear relationship between intensity and complex-decorrelation in optical coherence tomography angiography. Quant Imaging Med Surg (2021) 11(3):895–906. doi:10.21037/qims-20-868
26. Iomdina EN, Khoroshilova-Maslova IP, Robustova OV, Averina OA, Kovaleva NA, Aliev G, et al. Mitochondria-targeted antioxidant SkQ1 reverses glaucomatous lesions in rabbits. Front Biosci (Landmark Ed (2015) 20(5):892–901. doi:10.2741/4343
27. Jiang N, Li Z, Li Z, Zhang Y, Yu Z, Wan P, et al. Laquinimod exerts anti-inflammatory and antiapoptotic effects in retinal ischemia/reperfusion injury. Int Immunopharmacol (2020) 88:106989. doi:10.1016/j.intimp.2020.106989
28. Almasieh M, Wilson AM, Morquette B, Cueva Vargas JL, Di Polo A. The molecular basis of retinal ganglion cell death in glaucoma. Prog Retin Eye Res (2012) 31(2):152–81. doi:10.1016/j.preteyeres.2011.11.002
29. Gabr H, Chen X, Zevallos-Carrasco OM, Viehland C, Dandrige A, Sarin N, et al. Visualization from intraoperative swept-source microscope-integrated optical coherence tomography in vitrectomy for complications of proliferative diabetic retinopathy. Retina (2018) 38(1):S110–S20. doi:10.1097/iae.0000000000002021
30. Kraus MF, Potsaid B, Mayer MA, Bock R, Baumann B, Liu JJ, et al. Motion correction in optical coherence tomography volumes on a per A-scan basis using orthogonal scan patterns. Biomed Opt Express (2012) 3(6):1182–99. doi:10.1364/boe.3.001182
31. Zhang M, Hwang TS, Campbell JP, Bailey ST, Wilson DJ, Huang D, et al. Projection-resolved optical coherence tomographic angiography. Biomed Opt Express (2016) 7(3):816–28. doi:10.1364/boe.7.000816
Keywords: OCTA, intraocular surgery, GPU, retinal vasculature, vessel density, retinal ganglion cell
Citation: Cheng D, Zhang Z, Qiao Y, Ye Y, Zhu X, Ruan K, Shen M, Liu K, Tao J, Chen Y, Shen L and Li P (2023) Intraoperative optical coherence tomography angiography for intraocular surgery. Front. Phys. 11:1145882. doi: 10.3389/fphy.2023.1145882
Received: 16 January 2023; Accepted: 20 February 2023;
Published: 03 March 2023.
Edited by:
Chenxi Li, Tianjin University, ChinaReviewed by:
Zhenhe Ma, Northeastern University at Qinhuangdao, ChinaCopyright © 2023 Cheng, Zhang, Qiao, Ye, Zhu, Ruan, Shen, Liu, Tao, Chen, Shen and Li. This is an open-access article distributed under the terms of the Creative Commons Attribution License (CC BY). The use, distribution or reproduction in other forums is permitted, provided the original author(s) and the copyright owner(s) are credited and that the original publication in this journal is cited, in accordance with accepted academic practice. No use, distribution or reproduction is permitted which does not comply with these terms.
*Correspondence: Lijun Shen, c2xqQG1haWwuZXllLmFjLmNu; Peng Li, cGVuZ19saUB6anUuZWR1LmNu
†These authors have contributed equally to this work
Disclaimer: All claims expressed in this article are solely those of the authors and do not necessarily represent those of their affiliated organizations, or those of the publisher, the editors and the reviewers. Any product that may be evaluated in this article or claim that may be made by its manufacturer is not guaranteed or endorsed by the publisher.
Research integrity at Frontiers
Learn more about the work of our research integrity team to safeguard the quality of each article we publish.