 Andreas Georg Berg
 Martin Börner
- 1Center for Medical Physics and Biomedical Engineering, MR-Physics, Medical University of Vienna, Vienna, Austria
- 2High Field MR Centre, Medical University of Vienna, Vienna, Austria
- 3Karlsruhe Nano-Micro Facility (KNMFi), Karlsruhe Institute of Technology (KIT), Karlsruhe, Germany
- 4Institute of Microstructure Technology (IMT), KIT, Karlsruhe, Germany
Introduction: The most important assessed quality-control (QC) criteria for improvements in high-resolution imaging are represented by the contrast-to-noise-ratio and spatial resolution. Ultra-High-Field (UHF) Magnetic-Resonance-scanners (B ≥ 7 T) for medical research allowed for the improvement in spatial resolution up to the microimaging and nominal microscopy range [pixel-size: ps < (100 μm)2], even in-vivo on humans just recently. Preclinical MRI- and dedicated MR-microscopy (MRM) scanners already allow for microimaging and MRM (1-256 μm) but lack a sensible spatial resolution phantom for QC and performance improvements in hardware, pulse-sequencing and MRprotocols. In most scientific MRI articles, the spatial resolution is characterized by the ps, though this measurement parameter only limits the actual resolution.
Methods: Here the Modulation-Transfer-Function (MTF) is used as evaluation concept for the determination of the spatial resolution in MRM using simple intensity profiles. The resolution limit is defined using a critical modulation-level. In approaching visual impressions on spatial resolution an additional criterion derived from the Modulation-depth-to-Noise-Ratio (MNR) is proposed. A practical method for assessment based on a concrete phantom design and its realization is shown.
Results: The phantom design consists of several sets of fine grids, specifically featuring high structural anisotropy for optimum SNR and CNR, with different spatial periods ranging from a1 = 256 μm down to a8 = 2 μm, not only for a quick visual qualitative check, but also for quantification of resolution using the MTF for two different spatial encodings in two orthogonal in-plane directions. The challenging demands on the manufacturing technology especially with regard to the aspect-ratio are approached using Deep-X-Ray-Lithography (DXRL) relying on the high brilliance of Synchroton-radiation. Smallest grid plates with width of 4 μm corresponding to 125 line pairs/mm at a plate depth of 100 μm were achieved.
Discussion: MR-microscopic images, originating from a microscopy insert on a human UHF-MR-scanner, were used for demonstration of the evaluation process with two independent resolution-criteria. The developed prototype offers unique possibilities for quantitative resolution QC on UHF human and preclinical MR-scanners. Such a resolution-phantom might be very important for the improvement of MR-pulse-sequences, MR-protocols and even hardware. In principle the phantom can also be used for other microscopic imaging-modalities as for instance μCT and Optical-Coherence-Tomography (OCT).
1 Introduction
The spatial resolution represents one of the most important criteria for the quality of an imaging method especially in the case of medical imaging for the early detection of developing pathologies. The quantitation of spatial resolution therefore represents a relevant task for “Quantitative Medical Imaging”.
With the growing use of MR micro-imaging, and MRM the issue of spatial resolution is of increasing importance.
We would like to illustrate that relevance of high spatial resolution for medical imaging subsequently in Section 1.1. The reader interested in a short overview on factors influencing spatial resolution (Section 1.2) and a short non-encompassing report on the state of the art on methods for quantification of spatial resolution (Section 1.3) and finally the targeted features of the phantom and evaluation procedure (Section 1.4) is referred to the corresponding subsections.
1.1 Advances in high resolution MRI based medical imaging
In the clinical routine of Magnetic Resonance Imaging (MRI) a Voxel Size (VS) of about 300 × 300 × 2000 μm3 can be obtained on humans. High spatial resolution in the microimaging range (pixel size (ps): 100–300 µm) has been reported mainly for small Field of Views (FOV) on human extremities, e.g., fingers or toes for the investigation of Vater-Pacini corpuscles, relevant for the loss of vibrational touch sensing, an early change in diabetes [1,2]. Extremities, investigated by high-resolution MRI, might represent radiological models for a variety of pathologies, e.g., bone erosion, inflammation, psoriatic and rheumatic arthritis [3]. The spatial resolution has been identified as a critical obstacle to clinical investigations based on these easily accessible extremities [3]. In principle, the often used 2D-FT MR-method for spatial encoding with slice selective excitation allows for much higher spatial resolution, if specific hardware can be used and the restrictions on the living biological object or humans to be visualized are lifted, in specific: object diameter, tolerable measurement time and tolerance with regard to the magnetic field gradient strength.
A VS of about 30 x 30 x 200 µm3 [4] may be obtained in preclinicial MR imaging on small animals in vivo, performed for instance for pharmaceutical reasons.
Using such dedicated high-resolution MR-scanners the microscopic spatial range (ps < 100 µm x 100 µm) is already available. MRI with pixel size in that spatial range is therefore called MR-microscopy (MRM) [5]. MR-based histology [6] in the microscopic range has been reported on pathologic structural changes in tissue samples ex-vivo, for arteriosclerosis [7], arthritic changes in cartilage [8], diabetes related changes in the human skin [9] and ovarian cancer [10].
MRM-based histology (ex-vivo) on different tissues has already been demonstrated on high-field (B = 3 and B = 7T) human MR-scanners using additional dedicated hardware [11,12]. A voxel volume of (100 µm)3 has recently been reported on the human brain ex-vivo on a 7T UHF MR-scanner [13].
Even in vivo on human extremities high spatial resolution based on voxel- and pixel-sizes in the microscopic range has recently been demonstrated using prototype MRI rf-detector hardware [2].
1.2 Relevant factors for spatial resolution in MRI
However, the pixel and voxel size represents only a limit to the spatial resolution. The effective resolution may be significantly less due to spatial distortions, e.g., by magnetic field inhomogeneities or chemical shift artifacts. Also, other sample specific and technical factors might impact the actual achievable spatial resolution, e.g., the linewidth, the signal decay due to T2-relaxation, the magnetic field gradient strength (bandwidth) and gradient switching performance, the signal-to-noise (SN) restriction and even the diffusivity of molecules during MR-detection [5]. In parallel imaging the spatial encoding in MRI is based on the local electromagnetic B1-distribution of distant radio-frequency transmitter and receiver elements. Some of these parameters also depend on the investigated sample.
1.3 Methods for proving spatial resolution in MRI: Actual state
Consequently, the qualitative and quantitative check is recommended on defined test structures (phantoms) in several norms and recommendations on Quality Control (QC) of human MR-scanners. Most available phantoms for QC of spatial resolution are based on one dimensional periodic sets of plates or tubes [14–16]. For practical and manufacturing reasons mostly grid or hole structures are proposed and used for qualitative tests of spatial resolution with typical structural sizes of plates and diameter of holes of d = 10 mm down to 0.7 mm [16].
In order to test image quality with regard to spatial resolution, and assess modifications for improvements, using hardware, software and MR-protocol modifications in the spatial range of microimaging and microscopy, an objective test structure (phantom), which allows for the quantitative determination of the spatial resolution, is needed [17–19]. A previous design of a phantom for high-resolution MRI featured a smallest spatial structure width of 0.1 mm suitable for the micro-imaging range (≅ 300–100 µm) [19].
In optical imaging quantitative QC on spatial resolution is mainly based on the MTF-concept [20]. Often glass plates using etched orthogonal grid structures of varying periodic distance (a) are used (see as an example for a design: the United States air force target phantom) [21]. Such structures also allow for a quick qualitative check on spatial resolution in the microscopy range by a simple visual inspection for deciding which of the periodic grid lines are still separated. In Computed Tomography (CT) and µ-CT grid sets for the evaluation of the MTF represent a well-established metric tool for the quantitative characterization of the spatial response of the imaging system [22]. µ-CT phantoms, based on silicon grids, do exist with contrast of silicon absorption against air and resin [23]. Using tungsten as absorber material grids do exist with line dimensions down to 0.1 µm [24]. These µ-CT phantoms are not suited for MR-microscopy because the used metal results in a distortion of the electromagnetic B1-field in MRI. In these µ-CT phantoms the thickness of the absorption material is limited to a maximum of about 1 µm due to the very challenging small spatial dimensions. The lithographic processes used, based on silicon technology feature limited aspect ratios (height-to-width ratios) and consequently the high slice thickness used in MR-microimaging and MRM would result in partial volume coverage and signal modulation loss.
The MTF may also be calculated in principle from the Edge Response (ER) or Line Spread Function (LSF) [25]. Due to the sensitivity of the ER to local noise [25] and necessity for processing steps of measured MR-profiles the ER method for QC in MRI is rather seldomly applied.
In MRI on clinical whole body human scanners, phantoms for checking spatial resolution are designed for typical smallest pixel size of 0.5 mm. But no commercially available test structures (phantoms) do exist for the microscopic (<100 µm) range down to 1 µm. Proposals for such phantoms for the microscopic spatial scale do exist [18] and are reported as technical realization on the basis of, e.g., lithographically processed silicon grids [11,26].
For 2D-FT MRI with slice selective excitation the slice thickness is usually chosen to be much bigger than the in-plane resolution (pixel-size) due to the demands on high gradient strength for slice selection, short radio frequency (rf-) pulses and signal to noise ratio (SNR). Ideal phantoms for standard 2D-FT-MRI should exhibit therefore a strong anisotropy with regard to in-plane lateral distance of the grid bars with reference to their structural height in slice (z-) direction. Usual slice thickness in 2D-FT-microscopy ranges between 50 and 200 µm (see, e.g., [9,12,26]). The demands on the manufacturing technology for offering lateral structures down to 1 μm at height of 50–200 μm, corresponding to aspect ratios of about 50–200 are therefore very challenging. Deep X-ray lithography (DXRL) at KNMF using the high brilliance and small divergence of Synchrotron irradiation is in principle capable for the manufacturing of such structures (aspect ratio AR ≅ 50) in polymers down to below 1 µm [27].
With difference to other medical imaging modalities the spatial position in 2D-FT MRI is encoded by spatial phase (spin warp) and frequency encoding in different spatial dimensions. The different encodings may result in different spatial resolutions in the two different directions. A resolution phantom design therefore should allow for the quantitative evaluation of the MTF in 2 orthogonal directions. This might be achieved by orthogonally arranged grid patterns. The MTF can be obtained using lateral profiles in the image crossing the different orthogonally arranged periodic grid lamellae.
1.4 Conceptual approaches, targeted phantom features, and methods
In this manuscript the subsequent aspects of a resolution phantom including resolution analysis for slice selective 2D-FT-MR- microimaging up to the microscopic range are described. The phantom should allow for QC of spatial resolution on High-Field human scanners, already capable of such high-resolution performance, preclinical (animal) MR-scanners and even experimental MR-imaging devices designed for highest spatial resolution. The design and prototype phantoms should not only allow for quick qualitative checks of spatial resolution by simple visual inspection but also should offer the possibility for a quantitative determination of the spatial resolution using the MTF-concept in two orthogonal, for instance phase and frequency encoding, directions. The manuscript is divided into the subsequent three main subject parts: the first two describing the physico-mathematical concept and the realization of the phantom including its QC; the last one presents a demonstration of the qualitative imaging results and evaluation procedure for quantification of the spatial resolution.
1) Concept for quantitative determination of the spatial resolution in two independent directions using a strongly anisotropic 2D-grid structure based on the MTF including 2 independent resolution criteria.
2) Technical realization of prototype 2D-FT resolution phantoms and their QC.
• Design of a phantom for quantitative determination of the spatial resolution in 2D-FT-MR-microscopy with slice selective excitation up to spatial frequencies of f = 500/mm. This corresponds to a lamella width of 1 µm. The height of the structures should allow for a slice thickness (slth) in MR encoding up to 200 µm (slthmax ≤ 200 µm). The independent evaluation of the MTF in two orthogonal directions with different spatial encodings should be possible.
• Manufacturing of the phantom using Deep-X-ray-Lithography, artefacts and restrictions in technical realization of the phantom design.
3) Exemplary measurement and evaluation of MR-microscopic images for a Turbo-Spin-Echo (TSE) radiofrequency and gradient pulse sequence with:
• simple qualitative interpretation and
• quantitative evaluation of the spatial resolution
2 Materials and methods
2.1 Concept of the Modulation-Transfer-Function (MTF) for the determination of the spatial resolution, defining criteria
The application of linear communication theory to imaging systems offers the possibility to characterize the main features of an imaging apparatus by the point spread-function (PSF) in the spatial domain and the modulation-transfer-function in the spatial frequency domain assuming linearity and isoplanatism in the imaging procedure [17,20]. The modulation-transfer-function (MTF) is defined as the ratio of the spatial Fourier transform I(fx,fy,fz) of the image intensity distribution in space (I(x,y,z)) to that (O(fx,fy,fz)) of the object distribution (O(x,y,z)). For simplicity we refer subsequently to only one spatial dimension (for instance x-direction):
The MTF(fx,fy) in the different spatial dimensions, e.g., in the plane (x, y) might be obtained by simple multiplication of the MTFs in orthogonal directions if independence (invariance) is valid. In the ideal case of a single periodic (spatial period ai) object, the spatial Fourier-component O(1/ai) is equivalent to the amplitude of the object modulation depth O. An ideal test phantom for spatial resolution might be composed of a set of periodically (period ai) arranged grids with different spatial frequencies f = 1/ai covering the typical spatial frequencies of the objects to be investigated. The MTF(f) of an imaging system can then easily be measured using an intensity profile delivering the modulation M(f) with standard image analysis software crossing the grids with different spatial periods [14,17]:
Imax and Imin are referring to the maximum, respectively minimum signal intensity in modulation. The measured intensity modulation M(f) versus the available discrete spatial frequencies 1/ai is representing a discrete sampling of the MTF:
Usually, a rather continuous decrease of the MTF with higher spatial frequencies is observed not only for MRI but also for other imaging modalities. Using grids of plates in MRI only discrete spatial frequencies are available for the measurement of profiles. Interpolation of the Modulation M(f) between these discrete frequencies up to the available highest spatial frequencies determined by the smallest spatial periodic distance might therefore be used for an approximation of the real MTF of the imaging system (see also Figure 12).
In MR imaging devices the relative modulation depth M(f) remains relatively constant at lower spatial frequencies but reduces significantly at higher spatial frequencies. Therefore, a resolution criterion referring to a critical high bandpass cut-off frequency is defined: fcut-off ≅ 1/acut-off. Different criteria on the critical amount of reduction in modulation depth with higher spatial frequencies f = 1/a might be used for the quantification of a spatial cut-off frequency fcut-off, thus defining the spatial resolution, for instance [14]:
or
We propose an additional criterion related to the relative noise rN, as the qualitative decision on the differentiability of an intensity line versus a background signal also depends on noise in the image:
We define the relative noise rN here as the ratio of the standard deviation σ of the background image signal intensity to the maximum modulation depth Imax-Imin present, e.g., at a low spatial frequency, where the object modulation is approaching the maximum modulation in the image:
The coverage factor kp can be set by the user. It represents a parameter, for which a predefined level of confidence for the difference of the modulation Imax-Imin from image noise can be achieved [29]. As an example, a high probability p ≅ 0.95 is achieved for the difference of the signal modulation to noise, setting kp = 1.95 ≈ 2 (assuming a Gaussian distribution for the signal intensity with standard deviation s and the noise being approximated by the standard deviation σ = s of the background signal).
These definitions result in the subsequent criterion for the critical spatial cut-off frequency fcut-off_noise, for which the modulation reaches a non-significant level (kp =! 2):
Other criteria for a higher (kp > 2) or lower level of significance (kp < 2) with a certain probability might be defined for specific imaging modalities and applications.
2.2 Technical realization of the resolution phantom
2.2.1 Design of resolution test structure (phantom) for MR-microimaging and MRM
2D-periodic structures in the form of two orthogonal grids are proposed to serve as a resolution phantom for MR-microimaging and MRM (Figure 1).
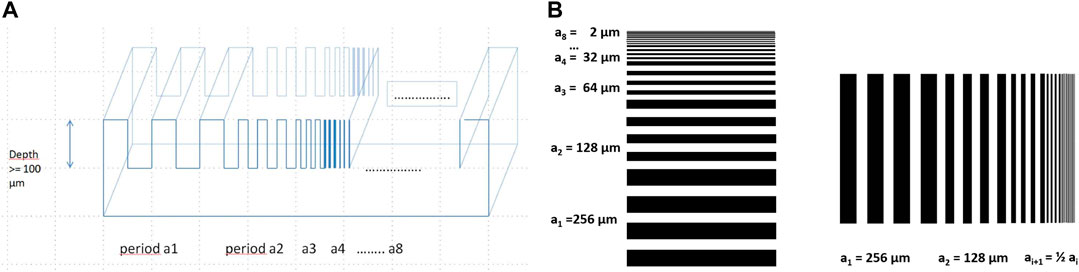
FIGURE 1. (A) (left) Design proposal for the quality control in MR-microscopy. The test structure (phantom) for the qualitative and quantitative determination of the in-plane spatial resolution, shown here only for one dimension, consists of several sets of periodically arranged plate walls (lamellae) characterized by their spatial distance ai/2 at same lateral width (1µm ≤ ai ≤ 256 µm). The envisaged minimum depth of lamellae is designed to be 100 μm, thus featuring strong demands on the aspect-ratio of the manufacturing technology. (B) (right) Frontal view of the design for two orthogonal grids, featuring subsequently size-reduced sets of periodically arranged plates with ai+1 = ½ ai. The periodic length ai is proposed to start at a1 = 256 µm and may range down to a8 = 2 µm. Intermediate steps in DXR-Lithography realization are possible. The two orthogonal arrangements allow for independent analysis of two different spatial directions, e.g., phase (spin warp) and frequency spatial encoding.
The phantom consists of a whole set of individual grids (Figure 1) of cavities or slits in a solid base material, which might consist of semiconductors, e.g., silicon, ceramics or—at best—of polymer type material. The openings are filled with an MR-visible liquid. For the quantitative detection of spatial resolution different sets i of grids with different lateral periodicity ai are to be manufactured ranging from a1 = 256 µm down to about a8 = 2 μm, e.g., in a small connected phantom of periods ai = 2, 4, 8, 16, 32, 64, 128, and 256 µm. Using intensity profiles in MR-imaging a qualitative inspection, which of the grid slits still can be differentiated, might be used for a quick estimation of the spatial resolution achieved using the specific hardware and MR-protocol. The modulation-transfer-function (MTF) may be evaluated from these phantoms using single pixel-wide profiles according to the methods described in the previous Section 2.1; Eqs 1–7. The spatial resolution in MR-microimaging and MRM may be quantitatively determined from the cut-off frequency using a criterion for the relative modulation depth (Eq. 4) or the modulation to noise ratio (Eq. 6 and Eq. 7).
Two orthogonal sets of grids allow for the independent evaluation of the spatial resolution in two different orthogonal directions with potentially two different spatial encoding methods in the plane of the slice selection: e.g., frequency and spin warp (phase) encoding as typical for 2D-FT MRI.
The height of the plates with reference to the width (aspect ratio) is very important for MRI slice selective imaging with strong anisotropic voxels, which is usually the case in standard MR 2D-FT high resolution imaging. The selected slice in optimum fits into the z-dimension of the plate (depth d of the plates), in order to profit from the full modulation depth and high SNR. For the 2D-phantoms the depth d of the periodic structures ai > 20 µm is therefore designed to be at least 100 µm. For the others ai < =16 µm the height is designed to be at least 50 µm (for maximum voxel size and SNR reasons). This design poses high demands on the lithographic fabrication process concerning achievable aspect ratios (AR), defined as ratio of depth/lateral width:
2.2.2 Technical realization of the orthogonal grids, fabrication artefacts and restrictions
The strong anisotropy of the design structure adapted to the usually strong anisotropy of voxels in slice selective MR-microimaging poses high demands on the aspect ratios of the µm-sized structures along with aspect ratios of 50–200. Deep X-Ray Lithography (DXRL) using Synchrotron radiation with low divergence <1 mrad is in principle able to offer such µ-structural details in the µm-range using PMMA with sidewall roughness of 20–30 nm [27]. The principle of the manufacturing process is indicated in Figure 2 (see also [30]).
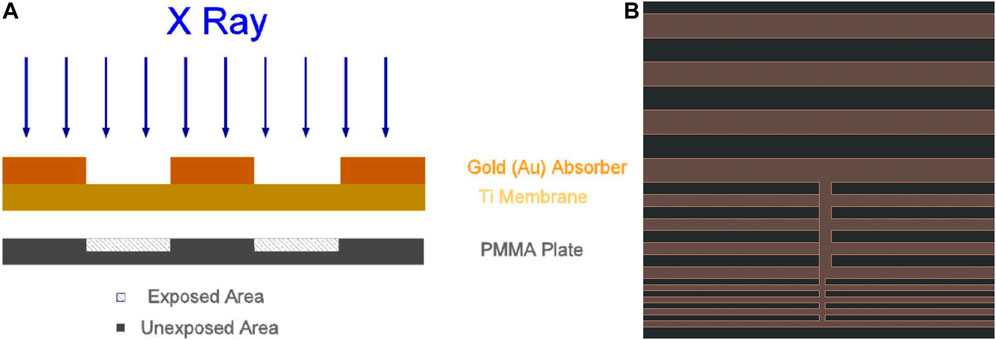
FIGURE 2. (A) Scheme of the lithographic manufacturing process with Synchrotron radiation. The thin titanium (Ti) membrane (brown) serves as a carrier for the thick structured gold mask (dark orange). The gold mask protects the underlying PMMA material from destruction by the high intensity Synchrotron X-ray exposure (blue arrows). (B) Enlargement of the CAD-design for the gold mask in the region of the smaller grid sets (a7 = 4 µm and a8 = 2 µm). For improving the mechanical stability of the thin but deep lamellae, lateral support struts at 1–2 µm size were added.
The manufacturing of the resolution phantom, as designed according to Figure 1, was set-up in several steps (see also Figure 2A).
2.2.3 Manufacturing of a high-resolution X-Ray mask
The high-resolution mask consisted of an X-Ray transparent support membrane (titanium foil with a thickness of 2.3 µm) carrying gold structures (2.2 µm thick) to absorb the synchrotron radiation during X-Ray lithography (Figure 2A). This mask allowed for subsequent spatially selective radiation of the PMMA to make it soluble for a wet chemical developer. A CAD-design was first drafted for manufacturing such a mask using electron beam lithography (EBL). The CAD-design was set-up to manufacture several (4 × 20) orthogonal grid sets ranging from a/2 = 1 µm up to a/2 = 128 µm. Consequently, after the manufacturing process several grid sets with same design had been available. Each of these grids featured at minimum 3.5 periods of the same plate thickness. In order to mechanically stabilize the thin lamellae below 4 µm thickness (at minimum 100 µm height) against tipping, small supporting struts of about 1 µm size were added perpendicular to the plate structure of the mask design (Figure 2B). They were separated from each other by about 250 µm distance in order to not impact the measurement of the image modulation depth.
2.2.4 Synchrotron irradiation
PMMA plates of 900 µm thickness were positioned with X-Ray mask on top to a Synchrotron radiation fan with a width of 100 mm and a Full-Width at Half-Maximum (FWHM) of about 4 mm. Therefore, the whole clamped package of PMMA and mask had to be scanned through the radiation fan to expose the whole design area of 60 × 20 mm2, which consisted of 80 single rectangularly arranged grid design elements (Figure 3A). The whole exposure process took around 2 h to achieve a bottom dose of around 3 kJ/cm³ in a depth of 100 µm. We used the beamline Litho 1 of the Synchrotron radiation source KArlsruhe Research Accelerator (KARA) for that purpose. The Synchrotron radiation is characterized by a small divergence which allows in principle for very steep sidewalls of the remaining PMMA (slope angle α < 1 mrad).
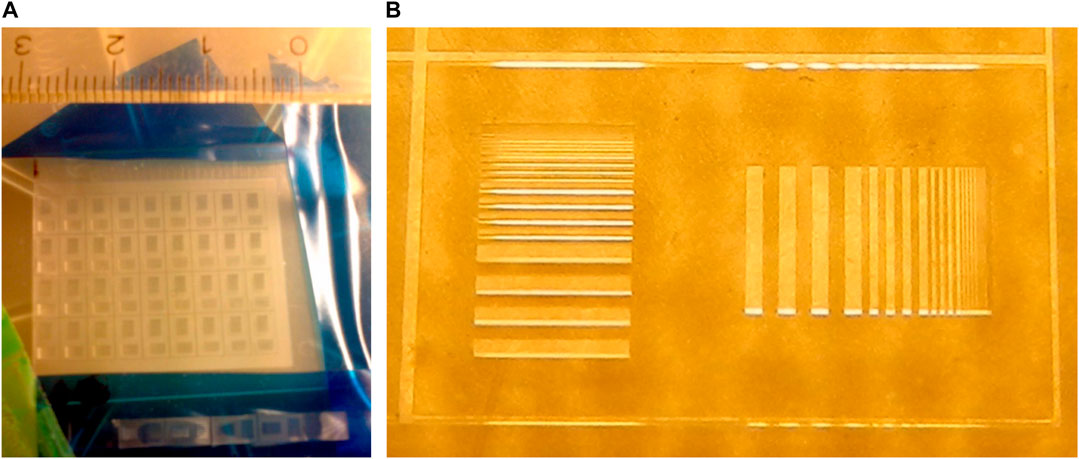
FIGURE 3. (A) Photo of a section of the structured PMMA plate with several resolution phantom grid sets. The realized grid periods ai vary between 256, 128, 64, 32, 16 and 8 µm. The scale indicates cm. (B) Macro photo of one of the phantom prototypes. Two sets of grids are arranged in orthogonal directions for independent analysis of the spatial resolution in phase and frequency encoding direction in 2D-FT MR-imaging. The largest grid with period a1 = 256 µm can be seen, e.g., at the bottom left.
2.2.5 Development of phantom grid-structures in PMMA and final preparation of prototypes
The irradiated parts of the PMMA plate were removed by dissolving in a developer consisting mainly of 2-(2-butoxy-ethoxy)-ethanol (60 vol%) and tetrahydro-1,4-oxazin (20 vol%) for 3 h (GG, developer for PMMA). An additional dissolving step with a mixture of 2-(2-butoxy-ethoxy)-ethanol (BDG) and water for 20 min followed. At the end the developed Polymethyl-Meth-Acrylate (PMMA) 3D-structure was rinsed for 10 min in deionised water for the removal of left particles and developing liquid. Final prototypes of the resolution phantoms were separated from the complete irradiated hard PMMA plate by sawing.
A macroscopic high-resolution photo of a subsection of the set of orthogonal grid series in the PMMA layer is shown in Figure 3A. A single grid set of one element containing two orthogonal grids is visualized in Figure 3B.
2.2.6 Characterization of quality, challenges and artefacts in manufacturing
A set of phantom prototypes was investigated for the achieved fabrication quality with regard to.
• achievable maximum spatial frequencies,
• plate-slit ratio: achieved lateral width of the plates in comparison to the scheduled open areas in between,
• height of the plates with reference to the width (aspect ratio) and slope,
• manufacturing artefacts and mechanical stability.
For this purpose, the subsequent analysis tools have been used: a) frontal optical microscopic image (distances were digitally gauged); b) Scanning Electron Microscopy (SEM) for more accurate measurements in distances, lateral visual inspections, e.g., for determination of the steepness of the walls, details of artefacts and PMMA-structure; c) MR-microscopy was also helpful in the evaluation of overall distances and height of the microstructures.
2.2.6.1 Evaluation of maximum achievable spatial frequency
The final implementation version featured PMMA plates/lamellae of 100 µm depth in PMMA. Stable and correctly aligned plates were observed at best down to a lateral width of 4 µm (Figure 4). This corresponds to a maximum spatial frequency of f = 1/a = 125/mm.
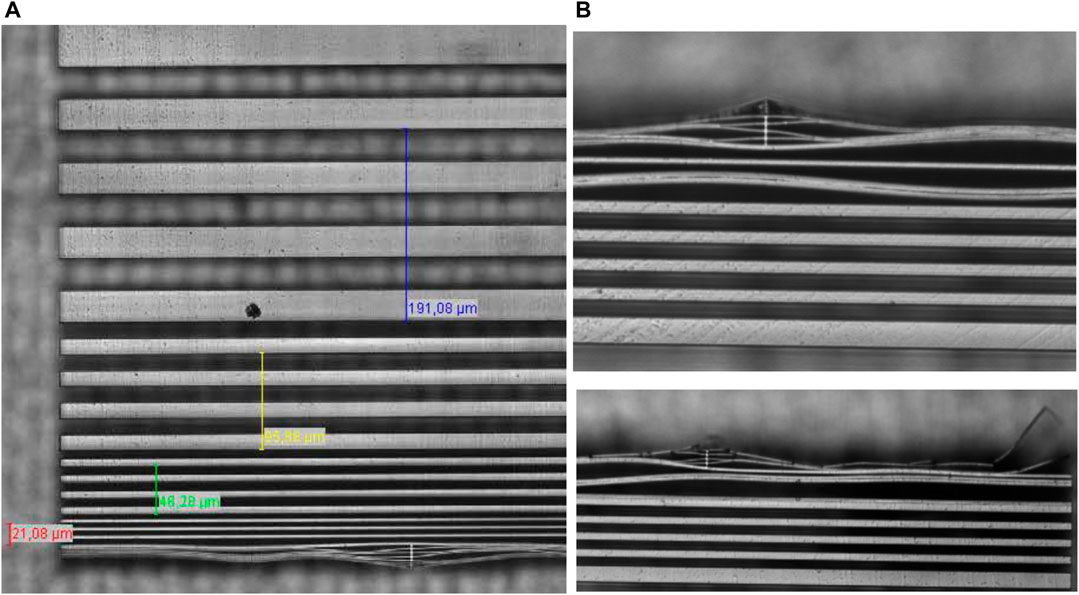
FIGURE 4. (A) Optical microscopic frontal view of the small-scale grids in the XRL phantom. Intact grids with spatial periods of 64 µm (topmost), 32, 16 and 8 µm (lowermost) were observed. The smallest correctly aligned plates featured a spatial width of 4 µm corresponding to a spatial frequency of 125/mm. Plates with even smaller thickness are not aligned parallel anymore and do lack periodicity. The slit to plate thickness ratio is close to one. (B) top High resolution optical microscopic frontal view of the smallest scale grids in the XRL phantom. The thin plates of 2 µm thickness were tilted and interfolded with neighbouring plates due to lacking mechanical rigidity. The rectangular, stabilizing bars (top side) were only capable to keep the spatial distance between the plates for lateral distances to about 10–30 µm. (B) bottom Lamellae below 2 µm thickness (a8/2 = 1 µm) at top side right border of the grid showed splitting off and destruction.
2.2.6.2 Evaluation of slit opening to solid-plate-thickness ratio
The slit width of the open area in between two plates was compared to the plate thickness using the frontal optical views at the topmost position. The ratio is relevant for the intensity modulation in the MR-image evaluation. For the bigger sized structures, the ratio was close to one; the optically derived distances for smallest aligned lamellae however showed slightly bigger slits than plate thickness, which might have been due to the focus depth of the optical microscope and therefore ranges within errors. Scanning Electron Microscopy (SEM) evaluations featured improved accuracy and resolution. They also offered the possibility for lateral views and evaluation at different depth (Figures 5, 6).
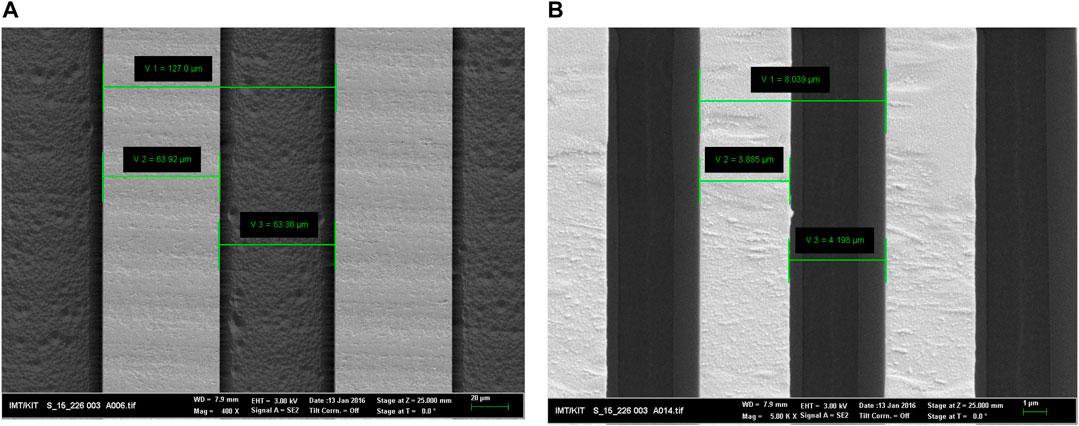
FIGURE 5. (A) SEM frontal view of the grid with nominal spatial period a = 128 µm in the XRL phantom. The slit opening was measured to be 63.4 µm, whilst the width of the bar was indicated to be 63.9 µm. (B) SEM frontal view of the small-scale grids in the XRL phantom. The slit width for the smallest correctly aligned plates featured a little higher distance (4.20 µm) than the solid plate thickness (d = 3.89 µm) at the surface.
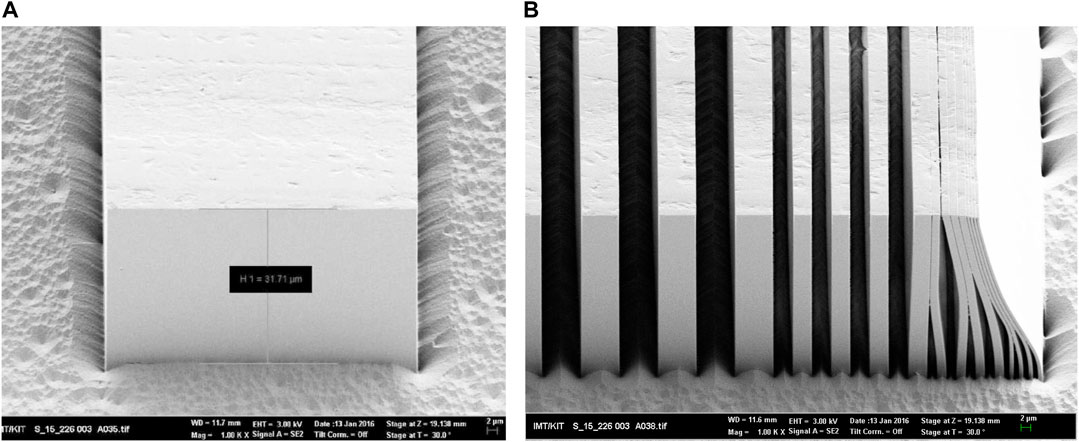
FIGURE 6. (A) SEM lateral view of one plate/lamella (a/2 = 64 µm) for a manufacturing batch with 60 µm nominal structure depth. The actual structure depth was about 63 µm. The orientation of the massive walls against the PMMA-base plate was excellent, close to 90°. Note the small grooves at both sides at the foot of the 64 µm wide plate. Please also note, that the SEM view was obtained with a tilting angle of 30°, which results in a distortion (shortening by factor 2 in indicated scale) in depth direction. (B) SEM view of the DXRL phantom (60 µm depth) in the high spatial frequency region. The grid plates with smallest width, still aligned correctly, feature a spatial distance (a/2) of about 4 µm (aspect ratio: ≅ 15). Note the excellent slope of the rigid PMMA walls close to 90° with no measurable difference between the width at top and bottom position.
The slit-to plate-thickness-ratio (duty cycle) for the highest spatial frequency f = 125/mm amounted to 1.08. The other spatial frequencies featured ratios even closer to one. These values are considered to be excellent in comparison to other manufacturing technologies.
2.2.6.3 Aspect ratio and slope
The height of the plates with reference to their width (aspect ratio) could only be checked using lateral views available with SEM for low lithographic depth of about 30 µm in first batches (Figure 6). The full depth was evaluated in the final batch (depth ≅ 100 µm) using MR-microscopy lateral (sagittal) views.
In etching based lithographic technologies usually the lateral open areas (slit opening) in between the massive bars on top of the structured grids feature a broadening with comparison to the bottom deep areas due to the different time of the lateral etching process. This results in non-rectangularly formed plates and a slope of the side walls deviating from 90°. Using DXRL no differences between top and bottom width of the grid lamellae/plates could be detected within measurement accuracy (slope = 90°). In this work the depth (height) of the massive plates in the different grids was evaluated to be d ≅ 100 µm using MRM. Thus, the highest aspect ratio (AR) was achieved for the intact correctly aligned and mechanically stable plates of 4 µm width: AR = 100 µm/4 µm = 25. The SEM views demonstrated, that smaller lamellae can be obtained in principle by DXRL, but these have not been mechanically stable for the specific phantom design with high lamellae length at 100 µm depth demonstrated by the tilting against each other (Figure 4B and Figure 6B).
2.2.6.4 Artefacts and mechanical stability
The main technological problem in manufacturing of the highly anisotropic grid structures was represented by the mechanical stability of the thin lamellae beyond about 4 µm thickness (Figure 6B). The consequence of the mechanical instability resulted in bowing of the thin plates at 2 µm thickness (Figure 7A). This results in non-aligned parallel plates, such destroying periodicity. The even smaller lamellae tilt against each other and glue together when being flushed with developer liquid. This artefact could already be observed in the optical frontal microscopy views (Figures 4A, B). More details could be observed in the high-resolution SEM images (Figure 7A).
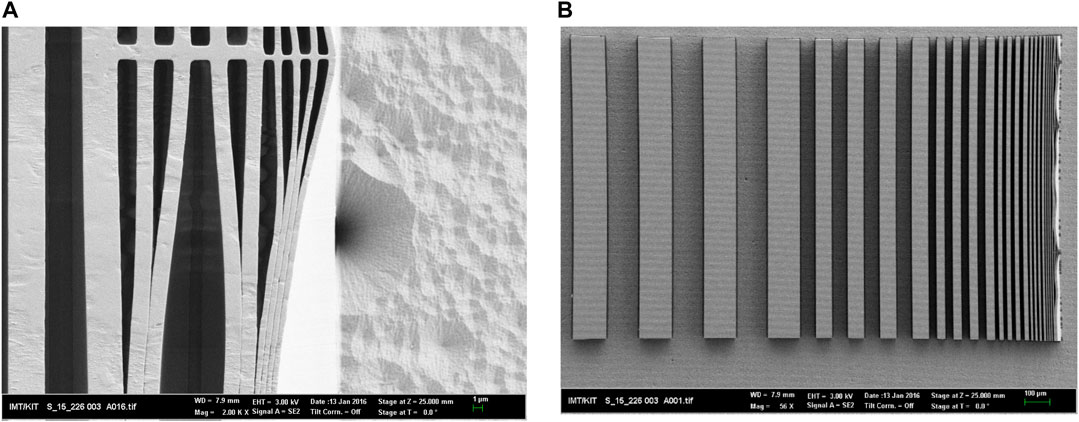
FIGURE 7. (A) SEM frontal view of the section with grid of high spatial frequency. The smallest usable aligned plates featured a width a/2 = 4 µm. The smaller lamellae (2 µm) bowed and tilted against each other destroying periodicity or even miss opening in between. Stabilizing bars rectangular to these lamellae have been implemented in the design (top), but these were only able to keep alignment of the plates on lateral distances of about 10–30 µm. (B) Overview frontal SEM image of a well performing phantom. The grids shown range with periodicity a in between ai/2 = 128 μm, 64, 32 16, 8 and 4 µm. All of them could be used for quantitative evaluation of the MTF [here in x-direction (left-right)]. The smaller ones exhibit bowing and non-aligned lamellae.
For the very thin lamellae below 2 µm width, additional bars rectangular to the plane of the lamellae are added to mechanically stabilize height and distance. This principle worked but only for lateral distances of about 10–30 µm length.
There had been differences in the quality of the final phantom grids, some of them showing hardly any destruction in the outermost lamellae. The areas close to the stabilizing rectangular bars could in principle be used to check spatial resolutions with f = 250/mm or even 500/mm in the direction rectangular to the stabilized lamellae (e.g., x-direction), if the associated lateral (y-) pixel size would be chosen to be smaller than the bowing distance, for example, in the shown example: about 5–10 µm.
A frontal overview of a well manufactured prototype is shown in Figure 7B. Note the excellent parallel alignment of the grid plates down to lamellae of 4 µm width, corresponding to spatial frequencies of f = 125/mm at about 100 µm height. According to our knowledge this frequency is sufficient for checking the spatial resolution of all commercially available MRM systems.
2.3 Aspects of phantom sample preparation for optimum quantification of resolution in MRI-microimaging
Please note that the PMMA structure cannot be visualized directly as the T2-relaxation time is too short for standard MR-spin echo encoding. Therefore, the final phantom was designed such that the solid PMMA-grid is open to at least two different lateral directions. This design allows for the quick entering of the MR-visible liquid, for instance water or silicon oil. The prototype phantom grids were positioned inside of a small glass tube (inner diameter di = 4 mm), which was filled with silicon oil instead of water in order to avoid the disposition of air bubbles especially in the small slits, often observed for water fillings (Figure 8). Water, in general, exhibits high dielectric permittivity (with reference to silicon oil) related to low wavelength of the used radiofrequency fields in MRI, which might result in dielectric resonances and B1 inhomogeneity artifacts for large body phantoms [31]. However, this feature of water represents no problem for the usage of small sized phantom containers as proposed here. The fixation of the PMMA grid phantom plate was performed by styrene foam, as we observed movements of some of the tiny grids during the measurements.
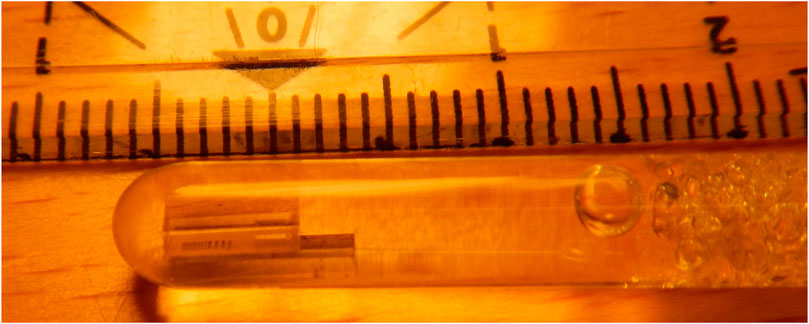
FIGURE 8. Macroscopic photo of the final resolution phantom in a small glass tube (inner diameter di = 4 mm). The PMMA-layer with the two orthogonal grids is embedded in silicon oil, which acts as MR-active filling liquid in the slits. The resolution phantom is fixed in this prototype design using a styrene foam showing air bubbles at right hand side (scale numbers indicating cm).
2.4 MR-microimaging and microscopy
2.4.1 Hardware and MR-protocols
MR-microimaging and MRM for checking the suitability of the manufactured prototype test pattern was performed on a high-field (7 T) human MR-scanner (Siemens Magnetom 7T) equipped with a prototype strong gradient system (G = 750 mT/m) and sensitive radio-frequency detectors (rf-coils) [12].
A slice-selective (2D-FT) Turbo-Spin-Echo (TSE) sequence (“tse2d1_10”) with different spatial encoding in the two orthogonal directions (frequency (x) and phase encoding (y)) was evaluated using different nominal spatial resolution with PS = 78 × 78 μm2 down to PS = 31 × 31 μm2 in-plane and a slice thickness of 120 µm (Figure 9).
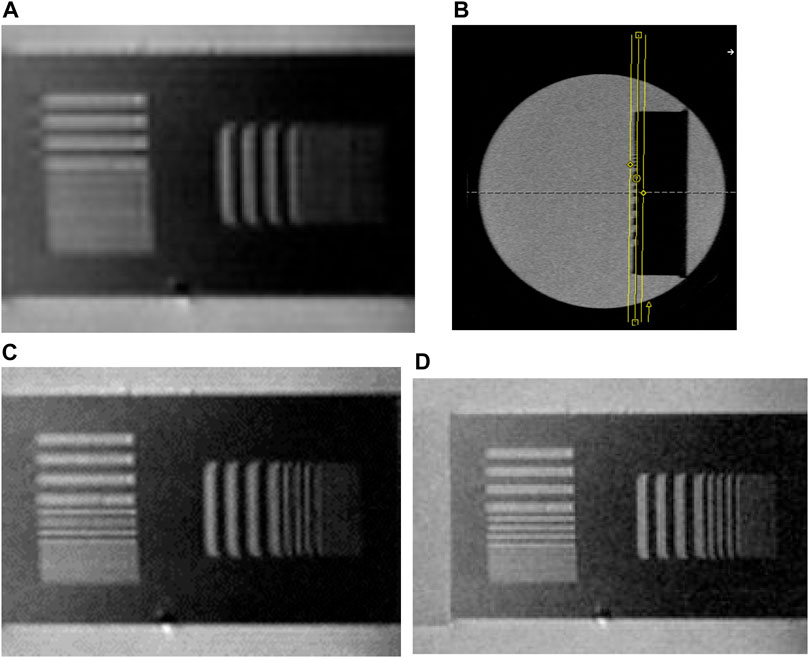
FIGURE 9. (A) In-plane (coronal) slice selective MRM-scan (pixel-size ps: 78 × 78 μm2; slth = 120 μm; Matrix Mtx: 64 × 128, FOV: 5 × 10 mm2). Only the grid with periodicity a1/2 = 128 µm can be detected in frequency (x) and phase encoding direction (y). The smaller ones cannot be resolved. From qualitative inspection the resolution of the MR-scan is proved to be at minimum 128 µm. (B) MR-axial scan of the phantom used as localizer for accurate placement of the MR-excited slice in the plane of the 2 orthogonal grids. The transverse (axial) scan crosses the vertical grid and thus allows for positioning of the slice. (C) In-plane slice selective MRM-scan (Voxel-Size VS.: 50 × 51 × 120 μm3). Mtx: 96 × 192, middle of 3 slices, phase encoding direction: (y). Only the grids with half periodicity ai/2 = 128 μm, and 64 µm can be differentiated. The smaller ones cannot be resolved. From qualitative inspection the resolution of the MR-scan is proved to be at minimum 64 µm. Note the apparently lower modulation depth for the second slit of the a2/2 = 64 µm grid in phase-encoding (y-) direction which appears at lower intensity than the other maxima due to partial volume coverage of the tiny slit by the neighbouring pixels. (D) In-plane (coronal) slice selective MRM-scan (ps: 39 × 39 μm2, slth = 120 µm). Mtx: 128 × 256, middle of 3 slices, phase encoding direction: (y). Only the grids with periodicity a1/2 = 128 μm, and a2/2 = 64 µm can be differentiated. The partial volume coverage artefact, as observed in (C) for one slit in phase encoding direction disappeared. The smaller grid lamellae cannot be resolved. From qualitative inspection the resolution of the MR-scan is proved to be at minimum 64 µm.
3 Magnetic resonance exemplary evaluation
3.1 Quality control on spatial resolution: Procedure for qualitative check
A quick qualitative determination of the spatial resolution might easily be obtained from a visual inspection of the MR-image. An example of such an evaluation is shown in Figure 9.
Firstly the reference slice is carefully aligned with the plane of the two rectangular grids (see Figure 9B). Using a 64 × 128 Mtx a pixel size of 78 × 78 μm2 for the microscopy regime is obtained (Figure 9A). The grids with periodicity a down to a1/2 = 128 µm can be differentiated. A minimum resolution of 128 µm can be proved for both frequency (left-right) and phase (top-bottom) encoding direction for the Turbo-Spin-Echo sequence (band-width bw = 100 Hz). However, the single lamellae at lateral width and distance of 64 µm of the grid with half periods a2/2 = 64 µm cannot be differentiated any more.
Increasing the matrix size to 96 × 192 at similar FOV (4.8 × 9.8 mm2) results in smaller pixels (50 × 51 μm2). The nominally higher resolution can be proved by qualitative inspection of the MR-microscopic images (Figure 9C). The slits with a2/2 of 64 µm in phase (y-) and frequency encoding (x-) direction can be differentiated. Please note, that two slits of the grid lamellae in phase encoding direction can hardly be separated due to partial volume coverage of the neighbouring pixels. Such an appearance is typical for a case when the pixel size approaches the grid pattern with regard to size (Moiré-effect). It is hardly observed any more, if the pixel size is further reduced to, e.g., ps: 39 × 39 μm2 (Figure 9D).
3.2 Quality control on spatial resolution: Procedure for quantitative check
The procedure is explained on the example of an MR-microscopic image (pixel size ps: 31 × 31 μm2, Mtx: 160 × 320, 3 slices, slth = 120 μm, TA = 96 s, bw = 100 Hz) positioned in the plane of the grid (coronal) using a slice selective Turbo-Spin-Echo sequence (TSE) with phase encoding in y- and frequency encoding in x-direction (Figure 10).
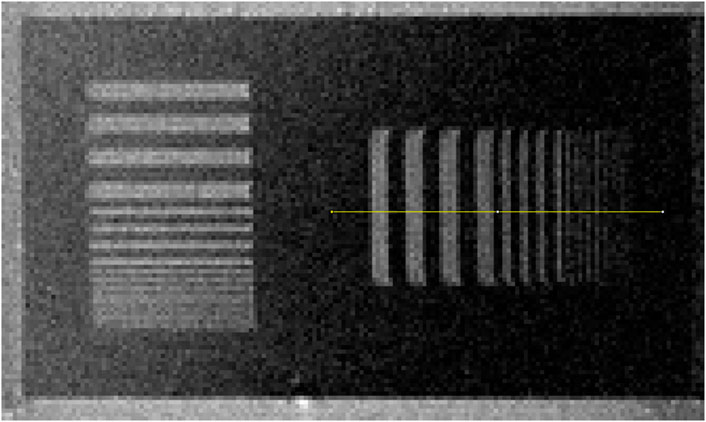
FIGURE 10. 2D-FT MR-scan with slice selective excitation in the layer of the 2 orthogonal grid sets (cor, VS.: 31 × 31 × 120 μm; Mtx: 160 × 256). The grid with a3/2 = 32 µm is difficult to be detected. For quantitative evaluation using the MTF the path of a profile of 1 pixel width for the evaluation of the modulation depth (Figure 11B) in frequency encoding direction (x: left-right) is indicated. The noise is calculated as standard deviation σ in a ROI close to the profile outside of the grid (σ = 73.4).
The example demonstrates a case where a) the pixel size (31 µm) is close to one of the grid modulations periods (a3/2 = 32 µm) and b) the modulation to noise is rather low (signal to noise ratio ≅ 672/73 ≅ 9 for the signal originating from the largest grid).
The modulations are determined as mean values of differences between the separate maxima and minima in intensity (Imax-Imin) for all of the 4 periods with the same spatial slit distance. For the grid-period featuring a slit width (a/2) close to the pixel size only the maximal 2 amplitudes (1 maximum 2 minima) are evaluated [14] due to the problem of possible unfavourable phase shifts between pixel grid and phantom grid (Moiré-pattern effect, see subsection below). Table 1 indicates the measured modulation depth from the profile using Imax-Imin data from fig. 10 and 11. For the low spatial frequencies also a systematic regression analysis using sine functions may be used. (Figure 11 blue and green colour lines). The data is normalized to the modulation Imax-Imin (K=2π/256 µm) of the lowest spatial frequency.
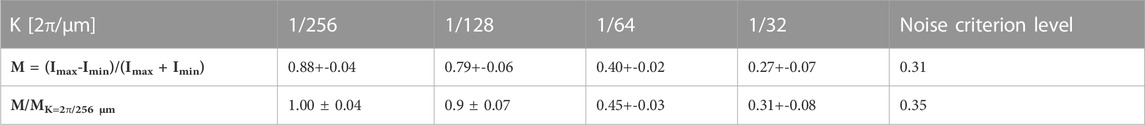
TABLE 1. Calculated data for the modulation depth originating from a single line profile (Figure 10 and Figure 11). The noise criterion level is calculated from Eq. 7 from the noise defined for practicability as the standard deviation (s = σbackground) in a Region of Interest (ROI) outside of the grid but close to the path of the profile (σbackground = 73.4).
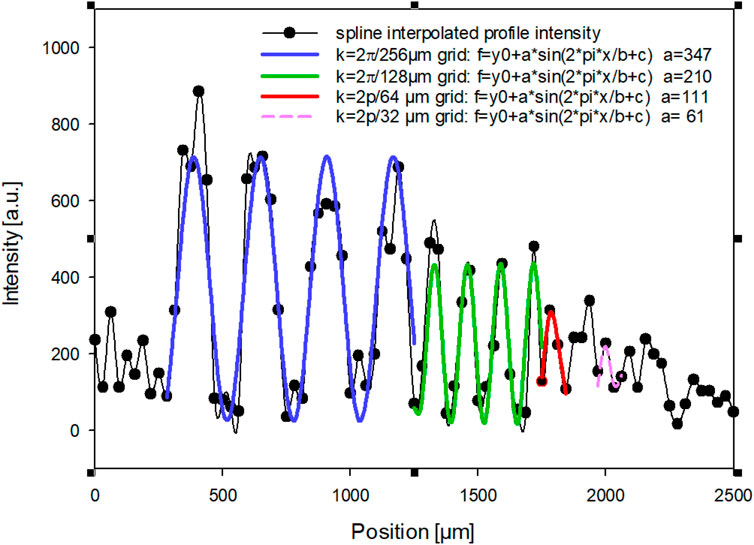
FIGURE 11. Intensity profile along the path indicated in Figure 10 for evaluation of the relative modulation depth and the MTF. Evaluated regions for determination of maxima and minima are indicated by colour encoded lines (fit data for modulations with high SNR are plotted). The profile line is only one pixel wide (31 µm) and features a modulation to noise ratio for the lowest spatial frequency (left) MNR(K=2π/256 µm), ≅ 9.2.
The normalized data on modulation variation with spatial frequency is visualized in Figure 12 as plot of the modulation-transfer function.
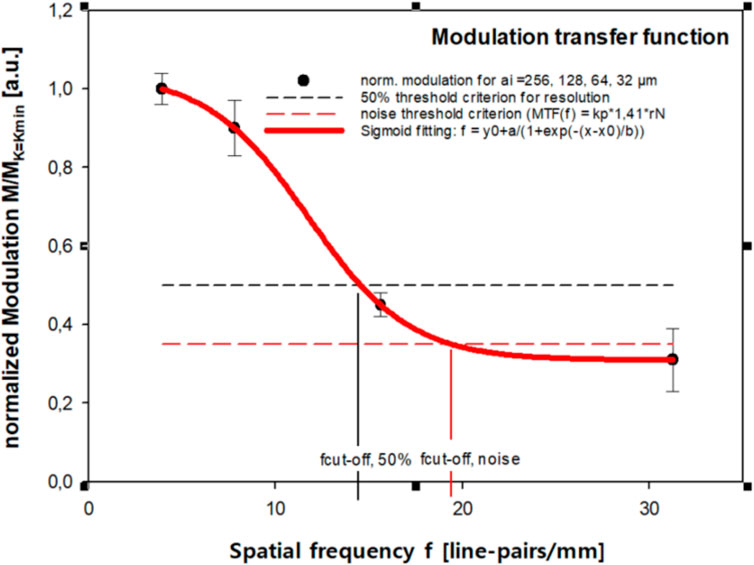
FIGURE 12. Normalized Modulation transfer function (MTF). The modulation of the signal intensity normalized to the signal modulation at lowest spatial frequency M/MK=Kmin (Table 1; Figure 11) is plotted vs. the spatial frequency f. A sigmoidal function (4 parameter fit) describes the data well and may be used for the evaluation of the cut-off frequency corresponding to the two different resolution criteria by interpolation. The resolution criterion level (50%-MTF level: fcut-off50% = 14.5 line pairs/mm) is indicated by the dashed horizontal black line. The Modulation-to Noise-criterion (Mcrit = kp √2 σnoise/<Imax-Imin>; kp = 2) is also shown as red dashed line (fcut-off_noise = 19.40 line pairs/mm).
The cut-off frequency fcut-off, 50% = K50%/2π can be determined from the regression analysis (sigmoidal fitting curve in Figure 12) reading the spatial frequency on x-axis for the 50% level for the MTF (black horizontal dashed line): fcut-off, 50% = 14.5 line pairs/mm. This spatial frequency corresponds to a half period a/2 = 34.5 µm.
The cut-off frequency for the modulation to noise criterion (Eq. 7) results in a higher spatial frequency: fcut-off, noise = 19.4 line pairs/mm corresponding to a half period a/2 = 26 µm close to the phantom slit width of 32 µm. For this reason, the grid (slit width 32 µm) still can be qualitatively detected by visual inspection (Figure 10), though in single line profiles the modulation disappears for some slits (unfavorable pixel position to slit-bar position and low SNR).
4 Discussion
Quality control regarding the spatial resolution in MR-microimaging and MRM was mainly performed by qualitative inspection using objects with known structural sizes in the range of the assumed spatial resolution, mostly close to the pixel size, e.g., tiny polymer beads [32]. The relevance of the concept of the MTF and Point Spread Function (PSF) for describing principal limits in spatial resolution in MRI has long been recognized [17,33]. Systematic investigations based on the MTF however, have been rare and, when performed in the context of MR-microimaging or MRM, have been mainly relying on lithographically etched structures using silicon wafer material as available for microelectronics [11,26].
Pixel sizes down to 1 × 4 μm2 have been reported [26] using an experimental MR-microscopy system with strong gradients (G = 12 T/m). The authors also indicated the necessity for tools for proving spatial resolution up to this 1 µm regime. They indicated their limitation to letter lines of 3 μm at 75 µm depth. The corresponding MR images were characterized by high slice thickness and anisotropic voxels (∆V = 1 × 4 × 75 µm3). Two lines of 5 µm width were resolved. The same authors also reported about the difference between pixel size and spatial resolution and the challenges in the manufacturing of resolution phantoms and objects with strong anisotropy necessary for high slice thickness and SNR. Their approach for manufacturing of phantoms with advanced deep lithographic etching processes was based on anisotropic plasma etching in silicon.
With difference, we demonstrate the use of an alternative deep anisotropic lithographic method based on Synchrotron irradiation (DXRL) for the manufacturing of sets of orthogonal grids.
Technical realizations featuring a full set of grids with varying spatial frequencies were restricted in structural depth mainly due to the limited aspect ratio achievable in standard lithographic etching processes, as an example to about 32 µm slit width at about 160 µm structural depth (AR ≅5) [11]. High aspect ratios (ratio of lateral structural width to structural depth) in small grids allow for the positioning of MR-selected slices within the grid plane and simultaneous QC on spatial resolution in two independent spatial directions. In standard 2D-FT imaging these are connected to different spatial encoding principles, i.e., phase and frequency encoding. The possibility for in plane detection of two orthogonal grids at high structural depth allows for high SNR due to the higher voxel size even, when single, one pixel wide profile lines are used. Moreover it opens potential for the adjustment and increase of the SNR by the selection of broader line profiles.
Apart from lateral etching the use of silicon phantoms may also suffer from the inherent magnetic susceptibility difference between the silicon material and the MR-visible liquid. In MRI QC the liquid chosen is usually a water solution with added paramagnetic salts for reducing the repetition time TR and subsequently the measurement time. The susceptibility difference might result in spatial magnetic field fluctuations resulting in spatial distortions dependent on the phantom and its orientation to the magnetic field. Such phantom-induced spatial distortions due to susceptibility differences increase with magnetic field strength. Silicon based resolution phantoms might, therefore, not be ideally suited for MR-microscopy, which is typically performed on high magnetic field magnets in order to benefit from increased signal to noise ratio.
Both of these restrictions are overcome using PMMA phantoms fabricated by DXRL [34] along with chemically inert silicon oil used as an MR-visible liquid, which also is less sensitive to air bubble appearance than water solutions.
The structural draft was designed for the very challenging minimum structural width of 1 μm at 100 µm depth (AR = 100). Actually, aspect ratios of AR = 4 µm/100 µm = 25 at very steep side walls along with high duty cycles could be achieved using the very low divergence of the Synchrotron radiation for structuring the PMMA polymer down to 4 µm sized plates (lamellae). The main restriction in the manufacturing of the phantoms was represented by the mechanical stability of the thin lamellae plates below 4 μm at height of 100 µm. SEM and OM results showed that the lateral stabilization by bars rectangular to the grid lamellae was successful only to lateral length of about 30 μm at maximum, nevertheless thus confirming the effectiveness of the supporting tiny side bars with regard to the mechanical stability in principle. Future realizations with thin bar width at about 30 µm interval distance could permit the production of grids with 4 µm slit width or even smaller plates.
The phantom application was demonstrated for several examples of protocols with QC for spatial resolution on a microscopy insert to a high-field 7T human scanner. A quick qualitative check of spatial resolution in two different spatial directions for phase and frequency encoding could be performed in the microscopy regime (ps < 100 µm) at the same time using a coronal or sagittal slice positioned within the plane of the grid. The spatial distortions due to susceptibility differences are small even at low bandwidth for this phantom. Also, the procedure for the quantitative evaluation of the interpolated MTF of an MRM TSE protocol was demonstrated on principle within an example of low SNR. The cut-off frequency for a predefined modulation threshold (50%) has been determined by interpolation of the discrete MTF evaluations. In addition, the spatial resolution, limited by the modulation-to-noise (MNR) criterion, could be determined using the MTF graph with inserted noise level indication. From our experience there might be some practical problems, inaccuracies and uncertainties in quantitative evaluations on grid structures with regard to the proposed MTF procedure, which are shortly discussed below.
4.1 Pixel position with reference to grid modulation (Moiré-pattern effect)
In unfavourable situations, when pixel size is close to the smallest slits, one pixel might be positioned such that ½ of it is covering a massive bar (no signal) and the other half is situated in the slit with the MR-active liquid (max. signal); the next pixel might experience a similar situation. In such a case (phase difference between the pixel grid and the phantom grid Δϕ = π/2) there is hardly any difference in signal observed (medium grey level for both pixels: the modulation disappears for neighbouring pixels (M = 0). If these pixels would be shifted by half the slit width against the grid such that the phase shift between the pixel and grid pattern vanishes (Δϕ = 0), the modulation could be maximal (one pixel covering the slit, the next pixel covering the bar): Mth = 1 (problem of dependence of modulation depth on the phase difference between pixel grid and phantom grid modulation phase: aliasing or Moiré-effect).
This effect might be effectively reduced by slightly tilting the profile path against the investigated encoding direction. The procedure results in a varying phase shift for the 4 different slits and the modulation for the slit and bar with maximum modulation depth may be evaluated as proposed in [14].
4.2 Noise overlay on modulation
For quantitative evaluation of the modulation depth the evaluation of intensity maxima Imax and minima Imin does include the additional contributions of the noise. A quantitatively potentially more precise procedure would therefore include a regression analysis (fitting) of the periodically modulated intensity by a set of periodic rectangular functions for the amplitudes including a constant intensity offset y0 and a phase fitting parameter for each spatial frequency of the phantom grid (Ki = 2π/ai) thus removing noise fluctuations. However, this approach fails if the pixel size approaches the grid pattern half period due to aliasing (Moiré-effect). In practice the influence of noise on the measurement might be reduced by averaging of the several different maxima-minima differences in order to obtain a mean modulation for all of the 4 slit bar periods.
4.3 Interpolation inaccuracy
The cut-off frequency is determined using a regression analysis for the discrete Ki measured MTF data and interpolation from this fitting procedure. The evaluation is subject to errors in the indiviudal modulation measurement. The measurement of modulation is limited to discrete spatial frequencies and interpolation might not accurately represent actual modulation values. The interpolation related inaccuracy could be improved using smaller steps ΔKi, e.g., by adding a grid with slit width of 48 µm in between 32 and 64 µm width or adding in design two sets of grids in parallel, one starting at a1/2 = 128 µm (64 32, … 4 µm) and the second starting at 96, 48, … 2 µm. However, this 2-grid solution demands for two profiles for the improved discretized MTF evaluation.
The investigated prototype phantom offered maximum spatial frequencies corresponding to the 4 µm slit width (f = 1/(8 µm) = 125 mm−1, 125 lp/mm) in manufacturing, which would have been sufficient for presumably more than 99% of the published MR-microscopy reports.
4.4 Position of slice and ROI for MNR evaluation, B1-inhomogeneity
The measurement of noise, estimated by the standard deviation in a ROI outside of the MR visible object, might be varying with the position of the ROI. An example might be represented by sensitivity encoding with several rf-coils as the noise might depend on the distance to the most relevant rf-sensor. Each MRI-sensor (rf-coil) features a local sensitivity distribution. This might result in a local variation of signal intensity and modulation. We therefore propose, to position the ROI for noise measurement as close as possible to the measured modulation profile (see comment in the legends of Figure 10).
The slice should be positioned as accurately as possible in the level layer of the grid. Otherwise, the measured image and profile could pass regions outside of the grid resulting in additional offset intensity with a) positive sign (if the image slice is located above the grid in the MR-active liquid) or b) negative if the slice is located in the massive plate giving no signal to modulation. The necessity for accurate positioning is especially relevant, if the slice thickness approaches the grid height.
4.5 Sample dependent spatial resolution
We would like to point within this discussion also to a more general aspect of QC on spatial resolution: the impact of sample specific characteristics on the capability of an MR-imaging system to differ spatially between neighboring objects.
There are several physical and chemical properties of the sample itself, which might have impact on the spatial resolution of an MR imaging device (see, e.g., [5,35]). These are for instance: the magnetic susceptibility and its inhomogeneity, the chemical environment of the detected 1H-nuclei (chemical shift difference between neighboring voxels), the diffusivity of the molecules, the molecular mobility, the MR-signal dephasing, characterized by T2* with regard to the linewidth of the spectral signal and the signal decay by T2 in Multi-echo-encoding pulse sequences. Though the discussion of all of these factors is beyond the scope of this article, we would like to demonstrate this impact by an example:
We might consider the extreme case of porous media, where magnetic susceptibility differences between the solid material and the enclosed liquids or gases are estimated to result in internal magnetic field gradients Gint up to few 10ths of T/m [36]. Such strong internal gradients result in high linewidth (lw ≅ γ Gint ∆x) for the individual volume at interest at pixel size ∆x and very short T2* decay of the MR-signal. Assuming a pixel size and distance of 10 µm and an internal sample specific field gradient Gint = 20 T/m for the extreme case of a porous rock media, a high linewidth of the MR-signal (lw ≅ 8.52 kHz/pixel) is expected. Even maximum available gradient hardware on special microscopy systems as, for instance, featuring a gradient strength G = 12 T/m [26], are not capable to separate these two pixels at 10 µm distance in frequency encoding direction (not considering limitations due to the necessity for quick acquisition of data during the fast signal decay).
The actual achieved spatial resolution in MRI (close to the limits of an apparatus) might be sample specific (as is the case for other imaging modalities) and the spatial resolution in vivo on humans might differ between regions close to “porous media” like the lung or close to the ear channel and homogenous (with regard to B-field) regions, e.g., the cerebellum in the human brain. A typical linewidth in human tissue after shimming is in the order of 70 Hz, similar to the linewidth we have measured for the resolution phantom with silicon oil (lw ≅ 65 Hz).
Actually, this sample specific aspect represents the reason, why phantoms with defined MR-relevant properties and low magnetic susceptibility differences are proposed for QC on spatial resolution and recommended in guidelines for QC on spatial resolution [14–16]. Strong susceptibility differences resulting potentially in strong magnetic field local gradients are present around air bubbles in water and should be avoided in phantoms for QC for geometric accuracy or spatial resolution. For avoiding air bubbles and susceptibility differences we used silicone oil, which - in connection to the PMMA material - resulted in a low value of the spectral linewidth of the phantom.
The availability of a standardized resolution phantom, without necessity for dealing with varying biological tissue characteristics with impact on resolution, facilitates the systematic improvements and optimization of MR-scanner hardware, pulse sequences and even MR protocol optimization. With regard to spatial resolution the phantom, in principle, allows to study not only the impact of gradient performance, e.g., strength and switching behavior, but the influence of most of the multifold factors originating from the individual local specific MR-apparatus installation. This includes the impact of main hardware components, magnetic field (B0-) homogeneity, rf-transmission and reception (rf-coils), postprocessing of data including nominal resolution enhancement by Deep Learning and AI-routines. Even MR-protocol parameters (like shimming protocols, bandwidth, Turbo factors in TSE, EPI-factor, GRAPPA factor, fast, and slow gradient switching) usually adjustable by the operator on the MR-scanner might be evaluated for their impact on the spatial resolution of the image.
Consequently, the described phantom might be a very useful tool for optimizing MR-protocols for improving resolution in the microimaging range, available now also on clinical MR-scanners. In addition, the microscopy range of animal scanners and even hardware performance of the best performing MR-microscopy scanners could profit from such a resolution phantom. We wish to offer these phantoms for systematic QC to interested users for research and resolution improvement on their specific MR-scanner, if we are asked for, as long as already manufactured phantoms are available.
4.6 Perspectives for usage with other imaging modalities
In principle the manufactured phantoms, prospectively, can also be used for other high-resolution imaging methodologies, for example, µCT [22, 23, 24] or Optical Coherence Tomography (OCT) [37]. There are options for varying the contrast in these imaging modalities by adding different add-ons to the MR-visible liquid. Such a resolution phantom for MR-microscopy and perspectives for other imaging modalities did not yet exist.
5 Summary and conclusion
A phantom design for the quality control on spatial resolution in MR-microimaging and microscopy is proposed. In specific the grid test structure is designed for the qualitative inspection based on the minimum distinguishable grid pattern and the quantitative measurement of the MTF for spatial resolution up to 500 lp/mm. Several prototypes, specifically designed for slice selective 2D-FT encoding, were manufactured using the extraordinarily high aspect ratios available with Synchrotron based Deep X-Ray Lithography (DXRL) in the polymer PMMA. They were checked for the achieved maximum spatial frequencies, aspect ratio and duty cycle using optical and electron microscopy. A minimum slit width (amin/2 = 4 µm) at about 100 µm lamellae depth was achieved corresponding to 125 lp/mm.
This phantom for QC allows for a quick qualitative check on spatial resolution in two independent spatial encoding directions at high SNR due to the usability at high slice thickness with small pixel sizes as typically used for 2D-FT slice selective MRI. Examples for visual qualitative inspection are shown for several MR-protocols with pixel size in the MR-microscopic regime (ps < 100 µm).
A simple physico-mathematical practical procedure is proposed for MR-evaluation for deriving a quantitative number on spatial resolution based on the MTF. The critical level of modulation for defining a resolution criterion is fixed and the practical method for the evaluation of the cut-off frequency is shown. In approaching visual impressions on spatial resolution in images an additional criterion derived from the modulation depth to noise ratio (MNR) is suggested. Two different spatial encoding methods (e.g., frequency and spin warp encoding) can be evaluated using one single MRI measurement of this prototype phantom. The evaluation is demonstrated on the example of a slice selective fast Turbo-spin-echo (TSE) MRM protocol with low SNR. The spatial distortions due to susceptibility differences are considerably low with comparison to silicon based phantoms with water from our experience, thus offering best performance also for high field MR-scanners. The prototype phantom not only offered the possibility for a quick qualitative visual impression of the spatial resolution via grid pattern differentiation but also allows for the determination of quantitative numbers on the spatial resolution. Though the envisaged minimum structural size of 1 µm in the realized specimen could not be achieved, the developed prototype offers already unique possibilities for the quantitative evaluation of 2D spatial resolution within QC in slice selective 2D-FT imaging for commercial preclinical and prototype research MR-microscopy systems.
Due to the improvements in hardware, effective spatial encoding by small rf-coil arrays and high sensitivity achieved especially at Ultra-High-Field human MR-scanners the microscopic range with pixel size below 100 µm becomes more relevant for the early medical diagnosis of pathologies and already has been reached in specific applications. The quantitative proof of the actual spatial resolution and improvements might be achieved using the described phantom or similar designs not only for preclinical high-resolution MRM, but also for such UHF human scanners. DXRL is especially suited for the anisotropic voxel sizes typical for slice selective 2DFT.
The proposed phantoms might also be used for systematic improvement of MRI hardware for spatial encoding, pulse sequence optimization and adjustment of MR-protocol parameters. In principle the manufactured phantoms prospectively can also be used for other high resolution imaging methodologies as, for example, µCT or optical coherence tomography (OCT). Such a resolution phantom for MR-microscopy did not yet exist.
Data availability statement
The raw data supporting the conclusion of this article will be made available by the authors, without undue reservation.
Author contributions
Concept and idea: AB; project author: AB; project manager at KNMF: MB; DXRL realization: MB; SEM-quality control images: MB; MR-microimaging and microscopy: AB; postprocessing and evaluation: AB; manuscript draft: AB; discussion and correction: MB + AB; corresponding author: AB.
Funding
Financial support via KNMFi-project 2015-013-006488 and Basic Funding by the Center for Medical Physics and Biomedical Engineering, Medical University of Vienna is acknowledged.
Acknowledgments
We acknowledge the Karlsruhe Nano Micro Facility (KNMF) (www.kit.edu/knmf) of the Karlsruhe Institute of Technology (KIT) for provision of access to instruments at their laboratories and equipment.
Conflict of interest
AGB is owner of a patent on MR-microscopy phantoms [18].
The remaining authors declare that the research was conducted in the absence of any commercial or financial relationships that could be construed as a potential conflict of interest.
The handling editor EW declared a past collaboration with the author(s) AGB.
Publisher’s note
All claims expressed in this article are solely those of the authors and do not necessarily represent those of their affiliated organizations, or those of the publisher, the editors and the reviewers. Any product that may be evaluated in this article, or claim that may be made by its manufacturer, is not guaranteed or endorsed by the publisher.
References
1. Széles JC, Csapó B, Klarhöfer M, Balássy C, Hoda R, Berg A, et al. In vivo magnetic resonance micro-imaging of the human toe at 3 Tesla. Magn Reson Imaging (2001) 19(9):1235–8. doi:10.1016/s0730-725x(01)00461-1
2. Laistler E, Dymerska B, Sieg J, Goluch S, Frass-Kriegl R, Kuehne A, et al. In vivo MRI of the human finger at 7 T. Magn Reson Med (2018) 79:588–92. EPub March 10, (2017). doi:10.1002/mrm.26645
3. Rogelj L, Dolenec R, Tomšič MV, Laistler E, Simončič U, Milanič M, et al. Anatomically accurate, high-resolution modeling of the human index finger using in vivo magnetic resonance imaging. Tomography (2022) 8(5):2347–59. doi:10.3390/tomography8050196
4.Bruker Bruker.com. Products and solutions, preclinical imaging, Billerica: Bruker Corporation. (2022). Available at: https://www.bruker.com/de/products-and-solutions/preclinical-imaging/mri/ultra-high-field-magnetic-resonance-imaging.html [Accessed January 15, 2023].
5. Callaghan PT. Principles of Nuclear Magnetic Resonance Microscopy. Oxford: Clarendom Press (2003).
6. Johnson GA, Cofer GP, Fubara B, Gewalt SL, Hedlund LW, Maronpot RR. Magnetic resonance histology for morphologic phenotyping. J Magn Reson Imaging (2002) 16(4):423–9. doi:10.1002/jmri.10175
7. Berg A, Sailer J, Rand T, Moser E. Diffusivity- and T2 imaging at 3 Tesla for the detection of degenerative changes in human-excised tissue with high resolution: Atherosclerotic arteries. Invest Radiol (2003) 38(7):452–9. doi:10.1097/01.RLI.0000068620.17569.83
8. Berg A, Singer T, Moser E. High-resolution diffusivity imaging at 3.0 T for the detection of degenerative changes: A trypsin-based arthritis model. Invest Radiol (2003) 38(7):460–6. doi:10.1097/01.rli.0000078762.72335.57
9. Hanson P, Philp CJ, Randeva HS, James S, O’Hare JP, Meersman T, et al. Sodium in the dermis colocates to glycosaminoglycan scaffold, with diminishment in type 2 diabetes mellitus. JCI Insight (2021) 6(12):e145470. doi:10.1172/jci.insight.145470
10. Tardieu M, Lakhman Y, Khellaf L, Cardoso M, Sgarbura O, Colombo PE, et al. Assessing histology structures by ex vivo MR microscopy and exploring the link between MRM-derived radiomic features and histopathology in ovarian cancer. Front Oncol (2022) 19(11):771848. doi:10.3389/fonc.2021.771848
11. Berg A, Wanzenboeck H, Hesjedal T, Moser E. MR-Microscopy at 35 µm on a whole body MR-system: Quality control by modulation-transfer-function and applications. In: Proc. ISMRM/ESMRMB joint annual meeting. Glasgow (2001). p. 925.
12. Berg A, Potthast A, Starewicz P. MR-MICROSCOPY on a human 7T-SCANNER. In: Proc. ISMRM/ESMRMB 2010. Stockholm, Sweden (2010). p. 1048.
13. Edlow BL, Mareyam A, Horn A, Polimeni JR, Witzel T, Tisdall MD, et al. 7 Tesla MRI of the ex vivo human brain at 100 micron resolution. Sci Data (2019) 6:244. doi:10.1038/s41597-019-0254-8
14. Lerski RA, de Certaines JD. Performance assessment and quality control in MRI by Eurospin test objects and protocols. Magn Reson Imaging (1993) 11:817–33. doi:10.1016/0730-725x(93)90199-n
15.European Norm. Evaluation and routine testing in medical imaging departments; Part 3-7: Acceptance and constancy tests – determination of essential image characteristics of magnetic resonance equipment (2005). EN 61223-3-7 (IEC 62B/575/CDV) 2005.08.01.
16.American College of Radiolog. MR accreditation program; phantom test guidance for use of the small MRI phantom. American College of Radiolog (2022). Available at: https://www.acraccreditation.org/-/media/ACRAccreditation/Documents/MRI/SmallPhantomGuidance.pdf (Accessed December 11, 2022).
17. Rossmann K. Point spread function, line spread-function and modulation-transfer-function. Radiology (1969) 93:257–72. doi:10.1148/93.2.257
18. Berg A. Testphantom zur Kontrolle der Abbildungsqualität in der hochortsauflösenden NMR-Bildgebung. German Patent no. DE19904635. German Patent office München/Germany (1999).
19. Fellner C, Muller W, Georgia J, Taubenreuther U, Fellner F, Kalender W. A high-resolution phantom for MRI. Magn Reson Imaging (2001) 19:899–904. doi:10.1016/s0730-725x(01)00397-6
20. Wright S, Cameron HG, Barrett F. “Biomimetic Vision sensors” (chapter 1.2.2.2). In: L Aklesh, and RJ Martin-Palma, editors. Engineered biomimicry. Elsevier (2013). doi:10.1016/B978-0-12-415995-2.00001-5
21.USAF. USAF resolution test chart (1951). Available at: https://de.wikipedia.org/wiki/USAF-Chart (Accessed Dec 12, 2022).
22. Ghani MU, Zhou Z, Ren L, Li Y, Zheng B, Yang K, et al. Investigation of spatial resolution characteristics of an in vivo micro computed tomography system. Nucl Instrum Methods Phys Res A (2016) 21(807):129–36. doi:10.1016/j.nima.2015.11.007
23. Langner O, Karolczak M, Rattmann G, Kalender WA. Bar and point test patterns generated by dry-etching for measurement of high spatial resolution in micro-CT. World congress on medical Physics and biomedical Engineering, munich, Germany. IFMBE Proc (2009) 25(2):428–31.
24.JIMA. Microchart Japan inspection instruments manufacturers association (JIMA) RT-RC04 (2021). Available at: https://www.jima.jp/content/pdf/catalog_rt_rc04_eng.pdf (Accessed January 12, 2021).
25. Judy PF, Balter S, Bassano D, McCullough EC, Payne JT, Rothenberg L. AAPM report No. 1; PHANTOMS FOR PERFORMANCE EVALUATION AND QUALITY ASSURANCE OF CT SCANNERS. American Association of Physicists in Medicine (1977).
26. Lee SC, Kim K, Kim J, Yi JH, Lee S, Cheong C. MR microscopy of micron scale structures. Magn Reson Imaging (2009) 27:828–33. doi:10.1016/j.mri.2009.01.002
27.Karlsruhe Nano Micro Facility (KNMFi). Technologies: Deep X-ray lithography (XRL) (2022). Available at: https://www.knmf.kit.edu/XRL.php (Accessed Dec 14, 2022).
28. Chen YT, Lo TN, Chu YS, Yi J, Liu CJ, Wang JY, et al. Full-field hard x-ray microscopy below 30 nm: A challenging nanofabrication achievement. Nanotechnology (2008) 19:395302. doi:10.1088/0957-4484/19/39/395302
29. Baldock C, Murry P, Kron T. Uncertainty analysis in polymer gel dosimetry. Phys Med Biol (1999) 44:N243–6. doi:10.1088/0031-9155/44/11/402
30. Saile V, Wallrabe U, Tabata O, Korvink JG. LIGA and its applications. In: Advanced micro & nanosystems 7. Weinheim: Wiley VCH (2009). Available at: https://download.e-bookshelf.de/download/0003/7450/04/L-G-0003745004-0002368046.pdf.
31. Gach HM. Technical note: T1and T2 and complex permittivities of mineral oil, silicone, oil, and glycerol at 0.35, 1.5, and 3 T. Med Phys (2019) 46(4):1785–92. doi:10.1002/mp.13429
32. Ciobanu L, Seeber DA, Pennington CH. 3D MR microscopy with resolution 3.7 microm by 3.3 microm by 3.3 microm. J Magn Reson (2002) 158:178–82. doi:10.1016/s1090-7807(02)00071-x
33. McFarland EW. Time-independent point-spread function for NMR microscopy. Magn Reson Imaging (1992) 10(2):269–78. doi:10.1016/0730-725x(92)90486-j
34. Berg A, Börner M. Quantification of microscopic spatial resolution on MR-scanners using micro-phantoms manufactured with Deep-X-ray Lithography. Proc Int Soc Mag Reson Med (2020) 28:4267.
35. Glover P, Mansfield P. Limits to magnetic resonance microscopy. Rep Prog Phys (2002) 65:1489–511. doi:10.1088/0034-4885/65/10/203
36. Song YQ, Cho H, Hopper T, Pomerantz AE, Sun PZ. Magnetic resonance in porous media: Recent progress. J Chem Phys (2008) 128:052212. doi:10.1063/1.2833581
37. Lichtenegger A, Harper D, Augustin M, Eugui P, Muck M, Gesperger J, et al. Spectroscopic imaging with spectral domain visible light optical coherence microscopy in Alzheimer’s disease brain samples. Biomed Opt Express (2017) 8:4007–25. doi:10.1364/boe.8.004007
Keywords: imaging, resolution, quantification, phantom, modulation-transfer-function, MTF, microscopy, XRL
Citation: Berg AG and Börner M (2023) A phantom for the quantitative determination and improvement of the spatial resolution in slice-selective 2D-FT magnetic resonance micro-imaging and -microscopy based on Deep X-ray Lithography (DXRL). Front. Phys. 11:1144112. doi: 10.3389/fphy.2023.1144112
Received: 13 January 2023; Accepted: 17 March 2023;
Published: 24 April 2023.
Edited by:
Ewald Moser, Medical University of Vienna, AustriaReviewed by:
Paul Summers, European Institute of Oncology (IEO), ItalyGalina Pavlovskaya, University of Nottingham, United Kingdom
Copyright © 2023 Berg and Börner. This is an open-access article distributed under the terms of the Creative Commons Attribution License (CC BY). The use, distribution or reproduction in other forums is permitted, provided the original author(s) and the copyright owner(s) are credited and that the original publication in this journal is cited, in accordance with accepted academic practice. No use, distribution or reproduction is permitted which does not comply with these terms.
*Correspondence: Andreas Georg Berg, andreas.berg@meduniwien.ac.at