 Yue Ma
 Jichang Zhao
 Shan Lu
- 1School of Economics and Management, Beihang University, Beijing, China
- 2School of Statistics and Mathematics, Central University of Finance and Economics, Beijing, China
As the largest part of the mutual fund, open-end funds play a critical role in the Chinese mutual fund market. In this work, we construct an undirected weighted fund network of Chinese open-end funds based on the asset co-holding and explore whether funds’ co-holdings influence their net flows. The network structure traits are introduced into a panel data model to examine the impact of the asset co-holding network on fund flow changes. It is revealed that when a fund has more connections with other funds, indicated by a higher degree in the co-holding network, it receives more net flows. However, when the average co-holding value of a fund increases, its outflows outnumber the inflows. Furthermore, heterogeneity analysis suggests that this effect particularly exists for low-performance funds. The implications of these findings for fund investor behavior and the fund market are also discussed.
1 Introduction
For nearly two decades, the mutual fund market has enjoyed a tremendous growth as capital market reform progressed in China. Mutual funds also have contributed significantly to the maturation and professionalization of China’s capital market. In particular, investors prefer open-end funds for their high liquidity, transparent and reliable information disclosure, and investment diversification. According to the China Securities Regulatory Commission, open-end funds accounted for about 90% of the total mutual fund at the end of 2019. The changes in fund flows reflect the preferences of funds’ investors and are also closely associated with funds’ sizes that directly impact the fund managers’ investment decisions and future performance [1]. Additionally, since open-end funds are substantial stock market investors, the changes in the fund market are inextricably linked to stock market fluctuations and returns [2]. Therefore, it is essential to pay attention to the changes in the fund flow for the benefit of both fund investors and managers and to maintain financial market stability.
Owing to the fact that open-end funds can be purchased and redeemed freely, their sizes can vary due to different strategies taken by investors. The main influential factor in fund investors’ behavior is the historical performance of funds, and lots of studies have shown that open-end fund investors tend to purchase funds with excellent historical performance [3, 4]. However, some studies based on the Chinese fund market have obtained the opposite result, i.e., investors sell funds when the performance of their holdings improves, a phenomenon known as the redemption puzzle [5]. Some scholars have used risk-adjusted returns to measure the performance of China’s open-end funds and found no redemption puzzle [6]. The current empirical studies on the flow-performance relationship of China’s fund market have not yet reached a consistent conclusion, which is probably because additional factors that influence funds’ net flows have not yet been thoroughly considered in such an analysis.
By the end of 2019, the number of China’s open-end funds had reached more than 5,600 with nearly 4,000 listed companies in Shanghai Stock Exchange (SSE) and Shenzhen Stock Exchange (SZSE). Despite the large number of underlying assets, the phenomenon of funds holding common assets is prevalent in China, which is usually recognized as the herding effect. The reasons behind the herding effect are multifold. Deliberately imitating others’ portfolio may arise from asymmetric information among fund managers [7]. When faced with severe asymmetric information, managers who get inside information ahead adjust their portfolios accordingly [8]. Although anyone is able to access the information of funds’ asset holdings since mutual funds must periodically reveal them according to the information disclosure requirements, managers outside the information scope may tend to follow the foregoers. A herding strategy may bring copycat funds comparable to the performances of their target funds [9]. In addition, fund managers are committed to make asset allocation decisions in the guidance of incentive provisions [10]. These provisions might be very similar to each other and may let the managers pinpoint a certain group of stocks that share common characteristics, which further result in the prevalence of portfolio overlaps and concentrated holdings among mutual funds.
Herding behavior has been criticized as an irrational investment strategy [11, 12]. Although either proactive or unintentional herding behavior can be described by portfolio overlaps [13], whether portfolio overlaps of funds could affect fund net flows conditioning their historical performance is still unclear. To answer this, the present paper first depicts portfolio overlaps among funds by constructing fund co-holding networks and then interprets the impact of fund portfolio overlaps on fund net flows from the co-holding perspective. To begin with, we construct fund co-holding networks on a quarterly basis, using the asset-holding data of open-end equity funds that have always been in duration from 2011 to 2019. For reasons of data availability and to highlight major assets, this study focuses on funds’ connections originating from overlapping portfolios of their top stock holdings. Each edge represents a portfolio-overlapping relationship between two funds. The overlapping portfolios among funds create links between funds which emerge as a co-holding network. Previous works have focused on the stock network of sharing common mutual funds to unveil panic contagion which leads to an abrupt crash [14] and have focused on how the risk tolerance of individuals affects this procedure [15]. In this study, we conceive the different perspectives of [15] examining how a fund co-holding network influence the fund itself, that is, the net flow of a fund.
The node degree and average co-holding value for each fund in the co-holding network, which portray the extent of portfolio overlapping from the perspectives of the number of connections and the average value of each co-holding connection, respectively, are considered as the potential factors that have an effect on fund net flows. Specifically, a higher node degree indicates that a fund has broader assets that are overlapped with other funds, and the average value of each co-holding connection indicates how much a fund’s portfolio is overlapped with other funds in each overlapping equity. Although these might be contributed by various reasons associated with funds’ managers’ decisions as discussed previously, they could also influence fund performance and in turn affect the investors’ net flows of this fund. Alternatively, investors who are familiar with funds’ portfolios through public announcement would either choose funds with higher node degrees for the sake of following the general trend or decline funds that are too similar to others that are easily affected by market fluctuations. To examine these, we construct a fixed-effect regression model to examine the impact of fund network effects on fund net flows with fund network structure variables and control variables, and furthermore, heterogeneity analysis is conducted to explore the effect with respect to fund size and performance. Finally, comparing the results of the fixed-effect model and the ordinary least squares estimation method proves the robustness of this paper’s model.
This study has shown that the funds’ co-holding network has an effect on the fund net flows. The most prominent findings are that the central funds of the co-holding network, implied by high node degrees, attract more net flows, while funds with higher average values of the common assets receive less net flows. We further set the heterogeneity analysis which confirms that the node degree shows significance at a level of 5% only in the large-size funds. This implies that as the large fund’s node degree rises, it would attract more inflows or fewer outflows. In either the high-performance group or the low-performance group, the greater the fund node degree is, the more the fund inflow will be, i.e., investors’ purchases outnumber redemptions. However, the fund average co-holding value embodies significance at a level of 1% only in the low-performance group, indicating that the average influence of fund’s connections in the co-holding network does not significantly affect the net flows for high-performance funds. More generally, we offer a new view of connecting funds in terms of asset co-holdings and supplement the extant understanding towards fund net flows with network factors such as the degree and average co-holding value. Overall, this study sheds light on the importance of co-holding relationships in determining fund net flows in China, and we believe this novel perspective would inspire follow-up studies that discuss related topics.
2 Methods and data
2.1 Fund co-holding network
To capture the correlations among funds due to common stock holdings, this paper first builds the fund common-holding network [16]. The co-holding network is projected from a pre-constructed network between stocks and funds, as shown in Figure 1A, by assuming that
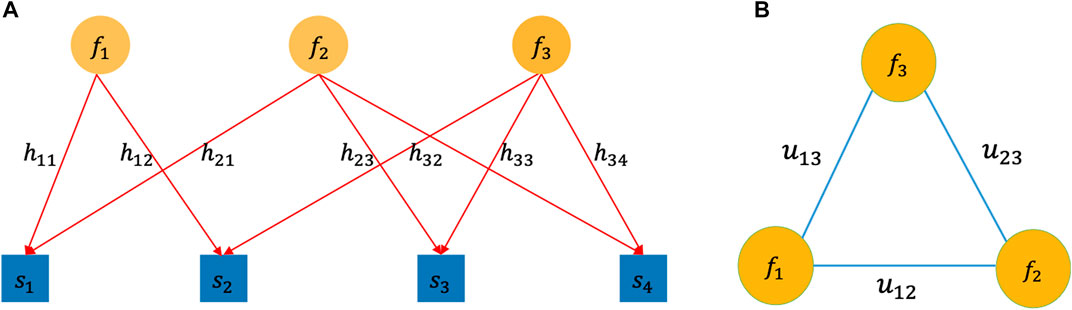
FIGURE 1. (A) Bipartite graph between funds and stocks. (B) Projected fund network. In Figure 1A,
Figure 2 shows the network visualization of 195 funds and the fund network degree distribution based on data of 2011Q1 in China. As can be seen, small communities of nearly even sizes can be detected in the fund network derived from common assets. In the meantime, as Figure 2B shows, the node degrees also have a relatively homogeneous distribution rather than a heterogeneous one (e.g., scale free), implying that the co-holding network of funds is different from previous financial networks, for instance, those among stocks [15]. The observations from other snapshots are similar, indicating stable structures between funds with portfolio overlaps. In addition, the possible effect from these structures on fund net flows accordingly deserves further explorations through econometric models.
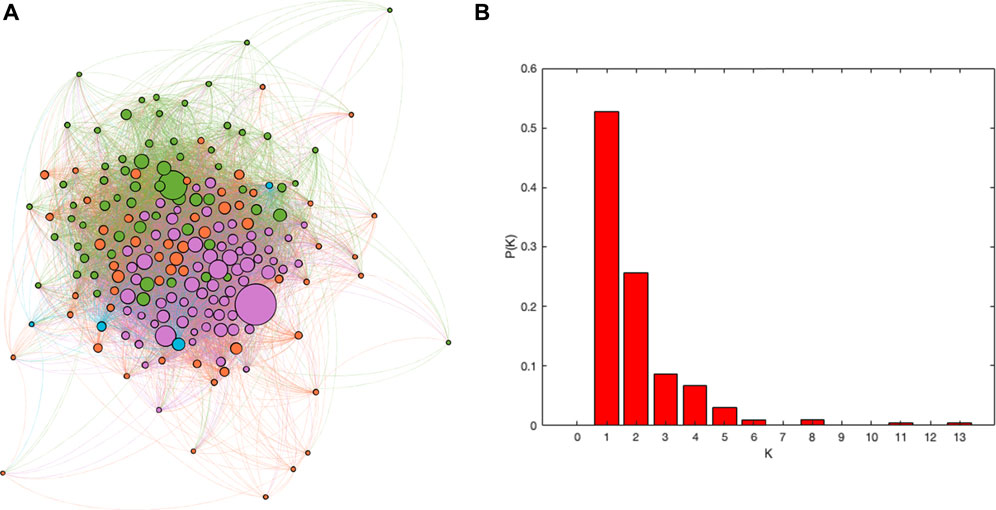
FIGURE 2. (A) 2011Q1 fund network visualization. (B) 2011Q1 fund node degree distribution. In (A), the size of a node is proportional to its degree. Each color represents a community, detected by the Louvain algorithm. The color of an edge is aligned with the color of the node with a larger common holding value.
Greenwood (2011) analyzed the relationship between the stock ownership structure and stock vulnerability based on United States fund holdings data [17]. The study testified that fragile stock caused by concentrated ownership or its owners faces correlated or volatile liquidity shocks, and fragility strongly predicts price volatility. Similarly, liquidation behavior of one or more funds on common assets can cause interactions between funds that are denoted by nodes in a fund network, affecting the market price of common assets [18]. To be more specific, price fluctuations in the sold stock have spillover effects that include, but are not limited to, changes in the net asset value of other co-holding funds owning the stock and a drop in the total net value [13, 19]. “Herding effects” within a group of investors can also cause inter-nodal effects. Mutual assets based on common assets may cause greater losses than balance sheet exposures and exhibit risk contagion characteristics [20]. Nevertheless, these extant advances focus on the phenomenon of liquidity risk that spreads in common asset networks and the antecedents and effects of risk propagation. The impact of the structure of common asset networks on fund flows, however, is rarely assessed and profoundly motivates the present study. The issues we intend to address are whether the structural qualities of funds in the network promote fund inflows or outflows and whether the explanatory fund structure varies under different heterogeneity situations.
Specifically, the present study introduces two network-structure indicators, namely, the node degree (
where if node
In addition, nodes with the same degree value may correspond to different edge weights. Therefore, we believe that edge weights should be combined with a node degree, which can describe the extent of the portfolio overlapping of a fund in a more accurate and comprehensive manner. We construct a new indicator called the average co-holding value (
Intuitively, the greater the average co-holding value is, the greater is the extent to which the fund has portfolio overlapping with others.
2.2 Panel data model
To demonstrate the interaction between individual funds in the aforementioned network, two fund network indicators, the node degree and average co-holding value, are included as explanatory variables. Based on the theory of the performance-flow relationship, fund performance is included as a control variable in this paper. We only consider equity funds and hybrid funds in this study because their assets mainly allocate stocks.
In addition, funds’ fundamental characteristics are also influential factors that cannot be ignored, such as the fund size, fund age, and fund return volatility. In summary, this paper examines the influence of portfolio overlapping, measured from the perspective of a co-holding network, on fund net flows and sufficiently controls fund performance and funds’ fundamental characteristics. A panel data model is therefore established as follows:
where
2.2.1 Dependent variable
The dependent variable
2.2.2 Control variables
The control variables for the model in this paper include fund performance
1) Fund performance (
Previous research studies on fund flows of open-end funds mainly focus on performance-flow relationship, which generally explains that fund performance has a significant positive effect on fund flows. For example, historical performance has a positive effect on fund flows [3]. This finding was validated, and then it proved that funds with better historical performance attract more fund flows [4]. Study on German equity funds found that investors choose to redeem funds with both excellent and poor performance and that large fund internal rankings also influence investors’ redemption decisions [23].
We select the Fama–French five-factor model-adjusted returns to calculate the fund’s current performance [24]. The Fama–French five-factor model can explain the portfolio’s excess returns more effectively. The regression model is as follows:
where
The performance
In summary, we obtain risk-adjusted quarterly excess returns
2) Fund size (
In addition to performance factors, it has been shown that the fund flow is negatively correlated with prior fund size, with large-scale funds growing more slowly than smaller funds [25, 26]. For active funds, size is the enemy of performance. The larger the fund size is, the more difficult it is to capture excess returns. Fund flows are negatively correlated with fund size in a prior period; in particular, larger funds grew more slowly than smaller funds [26, 27]. Therefore, we take fund size as a control variable. The indicator is defined as
3) Fund age (
Funds with a long history have sufficient historical data for reference and attract some conservative investors who prefer funds with relatively rich market experience. Changes in net flows of young funds are more sensitive to historical performance [28]. Young funds have higher net flows than senior funds [27]. Therefore, we take fund age as a control variable. The indicator is defined as
4) Fund return volatility (
Fund net flows are also affected by return volatility. According to portfolio theory proposed by Markowitz, risk-averse investors tend to choose funds with smoother returns when faced with the same level of returns, and funds with higher asset risk have lower net flows [4]. In this study, we take the standard deviation of fund net growth rate data to calculate this indicator.
In summary, we use panel regression, where we take the fund flow as the dependent variable, the metrics derived from the fund networks that demonstrate the interaction between individual funds in the constructed network as the explanatory variables, and many other influential factors related to fund flow as control variables. The primary metrics are
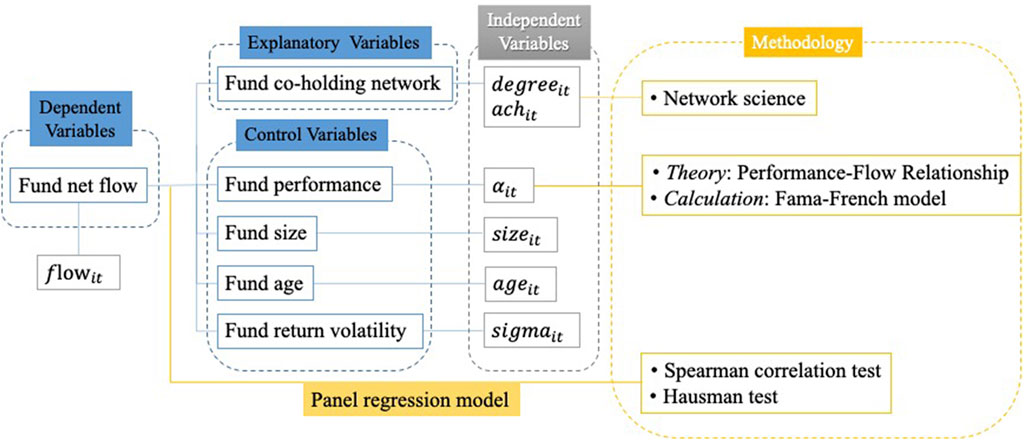
FIGURE 3. Illustration of the model.
2.3 Data
The dataset is provided by the CSMAR (https://www.gtarsc.com) and RESSET databases (http://www.resset.cn), ranging from 2011 to 2019 for 36 quarters. The characteristics of different types of open-end funds vary. Although the overall size of money funds is significant, they have lower risk and higher liquidity characteristics and are usually regarded as risk-free or low-risk investment instruments. In contrast, equity-biased funds usually have positions of up to 50%–95% in equities and have the characteristics of high risk and a high return. This paper selects equity funds and hybrid funds as research subjects based on this characteristic. We select funds that have always survived during the sample period, resulting in the balanced panel dataset for 195 funds over 36 quarters.
As for the programming language, in this study, we use Python to construct the fund network and calculate the fund network variables (
Table 1 first shows that the absolute value of fund returns is smaller than that of the market index returns in “Mean” column, but the standard deviation is much higher than the market index, indicating a higher dispersion degree of fund returns. The high standard deviation indicates that the fund returns are highly volatile because this paper aims at stock funds, with which the stock market itself is pretty volatile. In addition, the remarkable dispersion in fund returns also suggests that it is necessary to examine the effect of co-holding networks on funds of high and low performance, respectively.
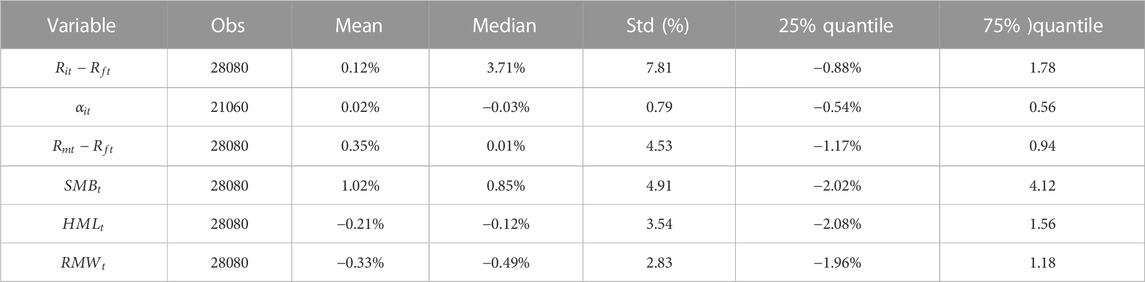
TABLE 1. Summary statistics of the Fama–French five-factor model.
Table 2 gives the descriptive statistics of the data. From 2011 to 2019, the average fund flow for full sample is −3.6%, which indicates that these funds are overall in a state of outflow during the observation period. The minimum fund node degree is zero, indicating that there are isolated nodes in the fund network; in summary, the co-holding network might not be connected. The last column in Table 2 “Obs” shows the sample size.
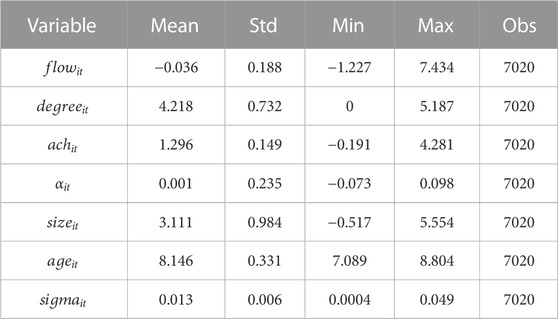
TABLE 2. Descriptive statistics of the total data.
3 Results
3.1 Panel data model
To ensure that the variables in model (3) meet the prerequisites for regression analysis, we first verify whether the variables are correlated by conducting the Spearman correlation test on the panel data. The test results show that fund flows significantly correlate with explanatory and control variables at the level of 5%. The Hausman test indicates that a fixed-effect model fits more for the main model, while a random effect model fits more for the comparison model with explanatory variables only. Table 3 shows the empirical results of model (3).
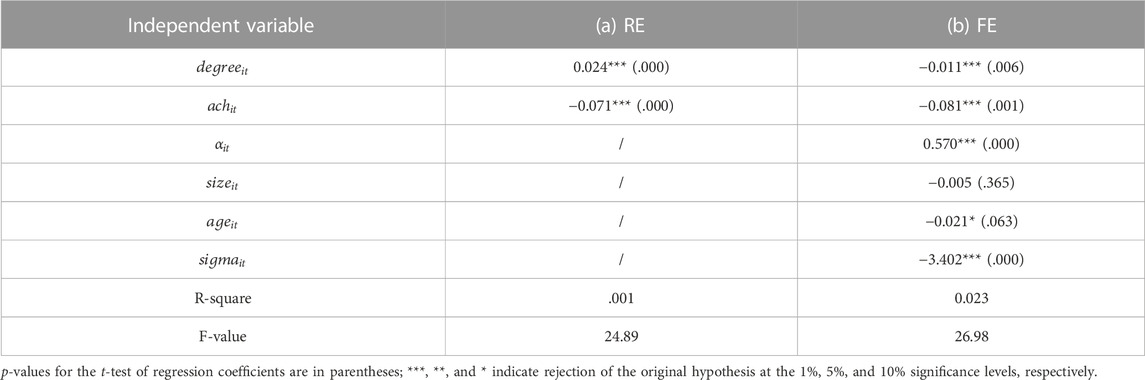
TABLE 3. Regression results of model (3).
Column (a) in Table 3 examines only the explanatory variables on fund flows, whereas column (b) adds control variables. The models pass the effectiveness test in terms of both the F-statistics and the fitness degree. The two network variables in model (a) are both significantly at the level of 1%. The greater the fund node degree is, the greater the fund’s net flows are, indicating that funds with a higher connectedness in the network also have relatively higher net flows. It implies that the central nodes of the network also have relatively higher inflows or lower outflows. The greater the average co-holding value is, the lower its net flow is, which indicates that a fund with a comparatively higher average co-holding value gets more outflows or less inflows.
The inclusion of control factors in model (b) reveals that including control variables does not change the explanatory ability of
3.2 Heterogeneity analysis
The previous regression results show that a greater node degree and higher fund performance have a significant and beneficial impact on fund net flows, while a higher average co-holding value has a significant inverse effect on fund net flows. To see if this result holds true for different types of funds, this study divides the funds into groups according to fund size and performance and then investigates the impact of performance and the fund network structure on fund flows within each group.
To avoid sample selection bias, the top 1/3 funds in sizes are classified as large funds, while the bottom 1/3 funds are labeled as small funds. A similar approach is used for fund performance grouping. The number of funds in the large-sized group is 144, and there are 140 funds in the small-sized group, while there are 176 funds in the high-performance group and 171 funds in the low-performance group. Table 4 shows descriptive statistics for the grouped data.
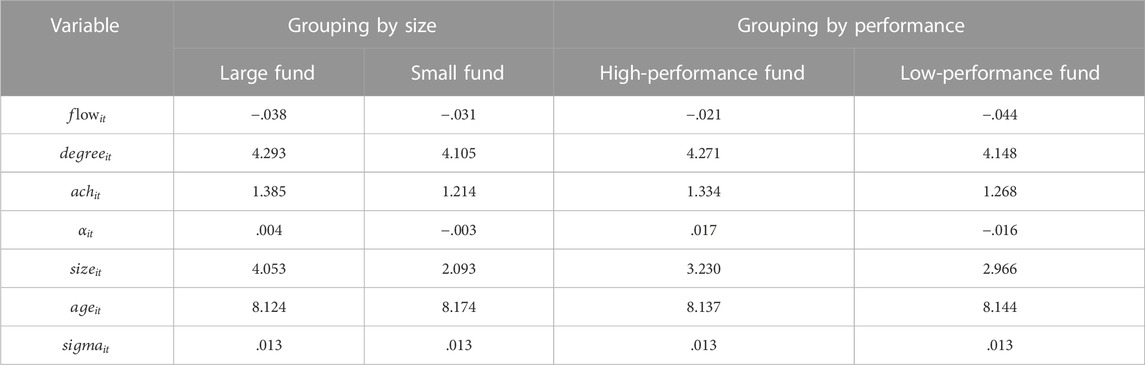
TABLE 4. Descriptive statistics of variables of heterogeneity analysis.
Table 4 shows that the mean values of both the fund’s degree and average co-holding value in the large-funds group are slightly higher than the mean value of the small-funds group. Fund flows for large funds on average are lower than those for small funds, showing that large funds have lower net flows. The mean of fund performance (
Based on the Hausman tests, we choose the random-effects model (RE) for both large-size and small-size groups. For the high-performance fund group, the fixed-effect model (FE) should be selected, while for the low-performance fund group, the RE model should be chosen. Table 5 shows the regression results. The last row in Table 5 “Obs” shows the sample size.
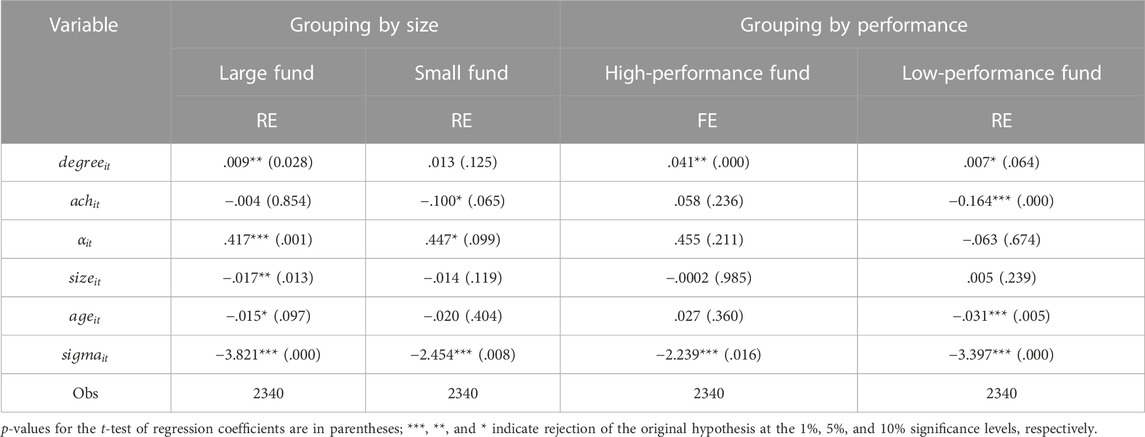
TABLE 5. Regression results of model (3) in different fund groups.
Table 5 shows that the different fund network indicators have different significances in different size groups. In the large-funds group, a degree is significant at a level of 5% while the average co-holding value is not significant. However, a degree shows no significance in the small-size group, while
In addition, the impact of funds’ performance on net fund flows is also statistically significant in either large-size group or small-size group, with different significance levels. The fund return’s volatility is significant in both large and small fund models at a level of 1%, and regardless of fund size, the fund flow is better explained in the large-funds group when the fund return’s volatility increases. Fund size and age are not significant for small funds’ net flows.
For heterogeneity analysis on the fund’s performance, the fund node degree is significant at a level of 1% of significance in the high-performance group. The average co-holding value factor has no significance, implying that the average market value of a fund’s holding in a co-holding network has no relevance on the high-performance funds’ flows. The fund return’s volatility is also statistically significant and economically significant, specifically showing a significant negative movement, that is, the higher the return volatility is, the more the investors will tend to redeem the fund to hedge their risk when making investment strategies.
In the low-performance group, a fund node degree shows less significance (at 10% significance level) than the average co-holding value (at 1% significance level) on fund net flows. The effect of a node degree on fund net flows is significantly positive, while the average co-holding value is significantly negative. In other words, an increase in the node degree will bring more inflows or less outflows to the fund for low-performance funds. On the contrary, when the average co-holding value increases, i.e., an increase in the market value of the fund’s common holdings in each connection, it will result in less fund net flows for low-performance funds. Furthermore, the fund degree is significant, but the average co-holding value is not in the high-performance fund group. In addition, it is worth noting that the return volatility is statistically significant in both groups, and fund age only reaches the 1% significance level in the low-performance fund group. Specifically, if a fund’s performance is at a low stage for an extended period of time, investors would prefer to redeem to reduce losses rather than adding additional investment to the fund.
3.3 Robustness test
We test the robustness of our main findings further through regression on the ordinary least squares (OLS) model. In addition, a similar effect of both the degree and average co-holding value on the fund net flow is obtained by using OLS. In particular, comparing the regression results in terms of both F-statistics and R-square, as revealed in Table 6, the fixed-effect model is superior to the OLS estimation method on significance. For example, in the OLS model, the degree and average co-holding value, which are the primary explanatory variables, are only significant at a level of 5%, while its significance level in the FE model is at a level of 1%. Overall, the regression results support the main findings of this paper and further illustrate the robustness of our panel data model. The last column in Table 6, “Obs,” shows the sample size.
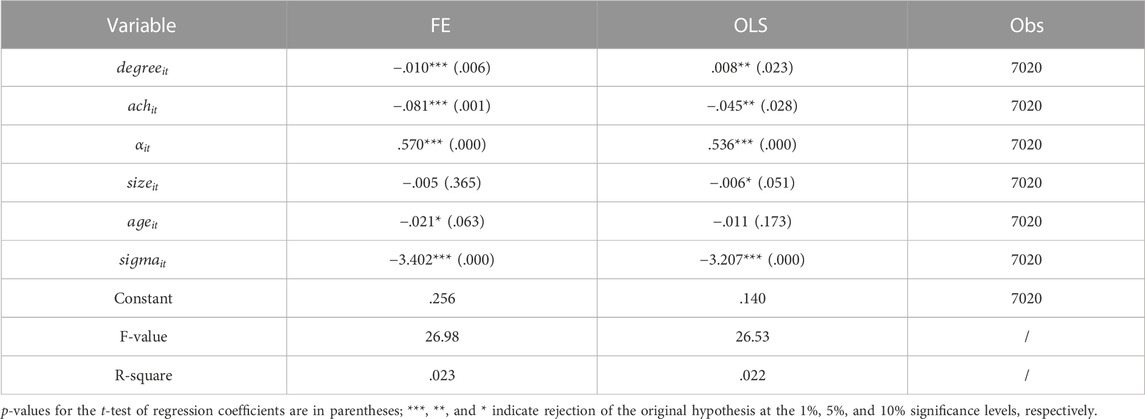
TABLE 6. Regression results of the FE model and OLS.
4 Discussion
This study explores the influencing factors on fund net flows in the Chinese open-end fund market through constructing a co-holding fund network to leverage the phenomenon of common stock holdings and incorporating network indicators at the node level in explaining the fund net flows. We find that, first and foremost, the fund degree and average co-holding value do significantly influence the fund flow. A fund with a greater degree gets more net flows, and meanwhile, a fund with a greater average co-holding value gets less net flows. Since a higher node degree indicates that a fund has broader assets that are overlapped with other funds and a higher average value of a co-holding connection indicates more that a fund’s portfolio is overlapped with other funds in each overlapping equity, our findings verified that the herd behavior among funds are indeed associated with investment decisions of funds’ investors, which closely link to fund net flows. More precisely, the results suggest that investors prefer funds with higher node degrees but decline funds that are too similar to others. This might arise from the fact that an investor would like to follow the general trend to choose high-degree funds but avoid funds with high co-holding values as they are more easily affected by market fluctuations. Second, we find that there is a performance chasing tendency among Chinese open-end funds. Investors prefer to purchase funds with excellent performance, which proves the non-existence of the “redemption anomaly” conditioning on the co-holding factors. This finding is in line with the existing research [6].
Furthermore, the results from heterogeneity analysis show that a degree and average co-holding value have different significances with respect to different sizes and performances. A node degree is significant in large-size funds but not in the small-size ones. On the contrary, an average co-holding value is significant in small-size funds but not in the large-size ones. When we focus on fund performance groups, a node degree plays a significant impact on high-performance fund flows, while an average co-holding value does not, indicating that the average value of a fund’s connections in a co-holding network does not significantly affect the fund’s net flows. The low-performance group did the opposite; only the average co-holding value is strongly significant for fund flows. These findings suggest that the co-holding network prompts varied impacts on different funds in terms of how many co-holding relationships they have (i.e., degrees) and how much co-holding values they have in these relationships (average co-holding values).
Based on the foregoing findings, we suggest that by creating a co-holding network, we may intuitively depict the potential relationships across funds. These relationships vividly reflect either proactive or unintentional herding behavior featured by portfolio overlaps. The fund network structure approach discussed in this paper offers new perspectives on the potential factors that influence fund flows. Aside from the impact of the fund network structure on fund flows, the network structure may also play a significant role in liquidity risk propagation and prevention, which is of great interest for further study. In addition, identifying major fund nodes in the fund market using the proposed co-holding fund network to accurately aid regulators in improving the precision of the financial risk control in the fund market is also worth attention in the future.
Data availability statement
The datasets presented in this study can be found in online repositories. The names of the repository/repositories and accession number(s) can be found in the article/Supplementary Material.
Author contributions
All authors contributed to the study conception and design. Material preparation, data collection, and analysis were performed by YM, JZ, and SL. The first draft of the manuscript was written by YM, and all authors commented on previous versions of the manuscript. All authors read and approved the final manuscript.
Funding
This research was financially supported by the National Natural Science Foundation of China (Grant No. 71871006).
Acknowledgments
SL thanks the support from the Emerging Interdisciplinary Project of CUFE, the Program for Innovation Research, and the disciplinary funding from the Central University of Finance and Economics. SL is a member of the Financial Sustainable Development Research Team in CUFE.
Conflict of interest
The authors declare that the research was conducted in the absence of any commercial or financial relationships that could be construed as a potential conflict of interest.
Publisher’s note
All claims expressed in this article are solely those of the authors and do not necessarily represent those of their affiliated organizations, or those of the publisher, the editors, and the reviewers. Any product that may be evaluated in this article, or claim that may be made by its manufacturer, is not guaranteed or endorsed by the publisher.
References
1. Pollet JM, Wilson M. How does size affect mutual fund behavior? J Finance (2008) 63(6):2941–69. doi:10.1111/j.1540-6261.2008.01417.x
2. Alexander GJ, Cici G, Gibson S. Does motivation matter when assessing trade performance? An analysis of mutual funds. Rev Financ Stud (2007) 20(1):125–50. doi:10.1093/rfs/hhl008
3. Ippolito RA. Consumer reaction to measures of poor quality: Evidence from the mutual fund industry. J L Econ (1992) 35(1):45–70. doi:10.1086/467244
4. Sirri ER, Tufano P. Costly search and mutual fund flows. J Finance (1998) 53(5):1589–622. doi:10.1111/0022-1082.00066
5. Lu R, Chen BZ, Xu LB, Xie XH. Fund performance and investors’ choice analysis on the redemption puzzle of open-end fund market in China. Econ Res J (2007) 6:39–50.
6. Xiao J, Shi J. Historical performance and fund flows: Does “redemption anomaly” exit in China’s open-end fund market? Econ Res J (2011) 46(1).
7. Cai F, Han S, Li D, Li Y. Institutional herding and its price impact: Evidence from the corporate bond market. J Financ Econ (2019) 131(1):139–67. doi:10.17016/FEDS.2016.091
8. Ke B, Deloitte KP, Licata M, Broad AE. How informed are actively trading institutional investors? Evidence from their trading behavior before a break in a string of consecutive earnings increases. J Account Res (2004) 42(5):895–927. doi:10.1111/j.1475-679X.2004.00160.x
9. Verbeek M, Wang Y. Better than the original? The relative success of copycat funds. SSRN Electron J (2013) 37:3454–71. doi:10.2139/ssrn.1566794
10. Maug E, Naik N. Herding and delegated portfolio management: The impact of relative performance evaluation on asset allocation. Q J Finance (2011) 01(02):265–92. doi:10.1142/S2010139211000092
12. D’Arcangelis AM, Rotundo G. Herding in mutual funds: A complex network approach. J Bus Res (2021) 129:679–86. doi:10.1016/j.jbusres.2019.11.016
13. Coval J, Stafford E. Asset fire sales (and purchases) in equity markets. J Financ Econ (2007) 86(2):479–512. doi:10.1016/j.jfineco.2006.09.007
14. Lu S, Zhao J, Wang H, Ren R. Herding boosts too-connected-to-fail risk in stock market of China. Physica A (2018) 505:945–64. doi:10.1016/j.physa.2018.04.020
15. Lu S, Zhao J, Wang H. The emergence of critical stocks in market crash. Front Phys (2020) 8:8. doi:10.3389/fphy.2020.00049
16. Braverman A, Minca A. Networks of common asset holdings: Aggregation and measures of vulnerability. J Netw Theor Financ (2018) 4(3):53–78. doi:10.21314/JNTF.2018.045
17. Greenwood R, Thesmar D. Stock price fragility. J Financ Econ (2011) 102(3):471–90. doi:10.1016/j.jfineco.2011.06.003
18. Guo W, Minca A, Wang L. The topology of overlapping portfolio networks. Statist Risk Model (2016) 33(3):139–55. doi:10.1515/strm-2015-0020
19. Duarte F, Eisenbach TM. Fire-sale spillovers and systemic risk. J Finance (2021) 76(3):1251–94. doi:10.1111/jofi.13010
20. Blocher J. Network externalities in mutual funds. J Financial Mark (2016) 30:1–26. doi:10.1016/j.finmar.2016.04.001
21. Ozsoylev H, Walden J, Deniz Yavuz M, Bildik R, Beshears J, Cohn J, et al. Investor networks in the stock market. Rev Financ Stud (2014) 27(5):1323–66. doi:10.1093/rfs/hht065
22. Chung SL, Liu W, Liu WR, Tseng K. Investor network: Implications for information diffusion and asset prices. Pac Basin Finance J (2018) 48:186–209. doi:10.1016/j.pacfin.2018.02.004
23. Stephan J, Wedow M. Purchase and redemption decisions of mutual fund investors and the role of fund families. Eur J Finance (2012) 19(2):127–44. doi:10.1080/1351847X.2012.662908
24. Fama EF, French KR. A five-factor asset pricing model. J Financ Econ (2015) 116(1):1–22. doi:10.1016/j.jfineco.2014.10.010
25. Fant LF, O’neal ES. Temporal changes in the determinants of mutual fund flows. J Financial Serv Res (2000) 23(3):353–71. doi:10.1111/j.1475-6803.2000.tb00747.x
26. Kempf A, Ruenzi S. Family matters: Rankings within fund families and fund inflows. J Bus Finance Account (2008) 35(1–2):177–99. doi:10.1111/j.1468-5957.2007.02062.x
27. Ferreira MA, Keswani A, Miguel AF, Ramos SB. The flow-performance relationship around the world. J Bank Financ (2012) 36(6):1759–80. doi:10.1016/j.jbankfin.2012.01.019
28. Chevalier J, Ellison G. Risk taking by mutual funds as a response to incentives. J Polit Econ (1997) 105(6):1167–200. doi:10.1086/516389
Keywords: fund networks, co-holding network, net flows, mutual funds, financial networks
Citation: Ma Y, Zhao J and Lu S (2023) Mutual fund net flows in China: A co-holding network perspective. Front. Phys. 11:1142905. doi: 10.3389/fphy.2023.1142905
Received: 12 January 2023; Accepted: 02 February 2023;
Published: 15 February 2023.
Edited by:
Raul Matsushita, University of Brasilia, BrazilReviewed by:
Regina C. B. Da Fonseca, Instituto Federal de Goiás (IFG), BrazilJoao Plinio Juchem Neto, Federal University of Rio Grande do Sul, Brazil
Copyright © 2023 Ma, Zhao and Lu. This is an open-access article distributed under the terms of the Creative Commons Attribution License (CC BY). The use, distribution or reproduction in other forums is permitted, provided the original author(s) and the copyright owner(s) are credited and that the original publication in this journal is cited, in accordance with accepted academic practice. No use, distribution or reproduction is permitted which does not comply with these terms.
*Correspondence: Shan Lu, c2hhbi5sdUBjdWZlLmVkdS5jbg==