 Yunlong Tong1*
 Lina Ye2
- 1Institute of Physical Education, Jilin Normal University, Siping, China
- 2College of Mathematics and Computer, Jilin Normal University, Siping, China
With the improvement of people's material living standards, more and more people start to pay attention to health issues. This paper takes the health field as the main research object, and discusses the current development and status quo of the health field. Through literature review, it is found that the current health field mainly focuses on the single monitoring of a certain organ or body function, and there are limitations in systematic health monitoring research, and most of the research stays at the stage of human body monitoring. Therefore, this paper intends to design a sports health monitoring and management system based on artificial intelligence. The system is mainly divided into a body temperature monitoring module, a blood pressure monitoring module and an exercise monitoring module, through which the user's health data is monitored. In order to ensure the practicability of the system, this paper selects three common life states in daily life for experimental testing, namely exercise state, rest state and sick state. The experimental test results show that each monitoring module can operate correctly and normally under three different states. The lowest temperature was 36.5° and the highest temperature was 37.1° under the exercise state. The lowest blood pressure is 70 in the resting state, and the highest blood pressure is 80. In the sick state, the maximum value of motor threshold is 0.2, the minimum value is 0.1, and the threshold difference is 0.1. Each module reads and backs up relevant data, and sends it to the platform for intelligent analysis. The platform will analyze and compare the data of different modules at the same time, judge the health status of the user at that time, choose whether to issue a health alert for the user, and finally complete the entire system process of the health monitoring management system. This proves that the sports health monitoring management system based on artificial intelligence algorithm designed in this paper is effective and feasible.
1 Introduction
With the progress and development of the times, people’s ideas are gradually changing. The rich material life has greatly extended people’s life span, and at the same time, people have paid urgent attention to their own health, so people began to research and discuss the related health field.
In the field of health monitoring, many scholars have put forward their own ideas and views on how to conduct health monitoring. [1] believed that the health should be monitored through the Internet of Things. The electronic equipment nearby was used to monitor the body data to achieve the purpose of health monitoring. [2] put forward the idea of using wearable devices to monitor the health of the elderly in real time from a remote location, and believed that the use of electronic technology can achieve real-time monitoring of the health of the elderly from a remote location. [3] proposed a health monitoring system based on sensors to judge and treat health through real-time monitoring and data analysis. [4] mentioned the telemedicine health monitoring system for COVID-19 in the American Journal of Medical Research. Through the health monitoring system, he made a preliminary judgment on the patient’s condition and gave the corresponding preliminary treatment plan. It can be seen from the literature of these scholars that although there are many researches on health monitoring at present, the research directions are rather messy and there is no systematic research idea.
Some scholars also took into account the health monitoring management system problems, and carried out relevant research in the field of health monitoring management system. [5] put forward in the journal of medical systems that wearing sensors all over the body can diagnose people’s bodies through the Internet of Things, so as to achieve the purpose of real-time health monitoring. [6] chose to use Micro Electro Mechanical Systems (MEMS) sensors to conduct real-time monitoring of the health monitoring management system through real-time network connection, so as to determine the health status of the body. [7] believed that health monitoring cannot be separated from the Internet, and has conducted in-depth and detailed investigation and research on heart health monitoring. Investigation and research include the beating of the heart and the amount of blood flowing through the heart every minute. [8] proposed a new interactive health monitoring system device, which monitored health systematically through user interaction mode. Users can obtain their own health status data by interacting with the device, so as to achieve the purpose of health monitoring.
It can be seen from the above literature that although these scholars have conducted in-depth and systematic research on the health monitoring system, most of the research is still on the technical level of human monitoring, not on the direction of artificial intelligence. Based on previous research, this paper realized automatic monitoring through artificial intelligence, used wearable health monitoring equipment, and conducted real-time intelligent monitoring of users’ bodies through the Internet to maximize the protection of users’ health.
2 Method design of intelligent health monitoring management system
As for the design of sports health monitoring management system, after referring to relevant literature, it is found that most health monitoring management systems only monitor a single body part, and the monitoring scope is very limited. After understanding this situation, the design of the sports health monitoring management system decides to monitor and manage many aspects. The monitoring management system includes the following three parts: Blood pressure monitoring and management under different conditions, temperature monitoring and management under different conditions, and physical exercise monitoring and management under different conditions. The following is the flow chart of sports health monitoring management system, as shown in Figure 1.
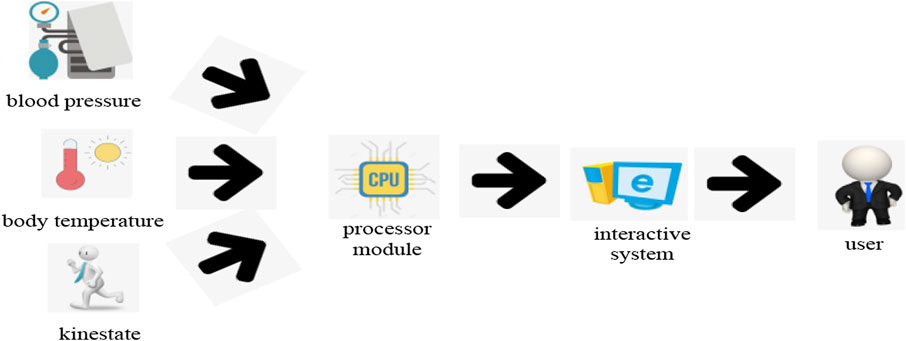
FIGURE 1. Flow chart of sports health monitoring management system.
The system mainly includes three modules: Blood pressure monitoring management module, body temperature monitoring management module and exercise monitoring management module. The work flow of the sports health monitoring and management system is as follows: Three modules start to work at the same time; each module records the user’s health data in real time; the obtained data is transmitted to the central chip processor through signal transmission. The central chip processor compares the set initial health data with the real-time received data. Once the real-time data is inconsistent with the initial health data, the chip would send the data to the platform terminal, which would remind users of health problems, and the platform terminal would conduct intelligent analysis based on the uploaded data to determine whether to remind users of health problems, so as to complete the intelligent health monitoring management purpose of the sports health monitoring management system [9].
2.1 Design of motion monitoring management module
This module adopts the whole body sensing method to monitor and manage the user’s body, and users wear sensors at each joint. Through the signal sent by the sensor, the central chip processor determines the spatial position coordinates of each sensor through calculation and processing, so as to establish a virtual user profile model. The sensor equipment is shown in Figure 2.
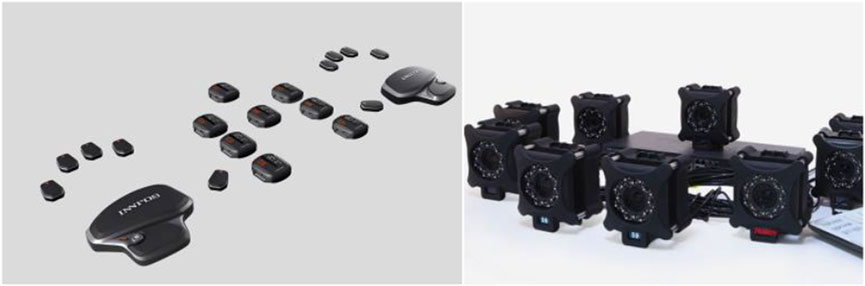
FIGURE 2. Sensor equipment diagram.
After establishing the virtual human body contour model, people can start to simulate and capture the state of human motion. Human body movement depends on the cooperation of various organizations of the body. Therefore, when the human body makes an action, various organizations of the body would change correspondingly in a period of time. Therefore, this paper uses the acceleration variable as the state variable, and determines the transformation relationship between the human body state variables in a period of time through the virtual human body contour model. In the virtual human body contour model, the present value
In this paper, people need to know the relationship between
In the formula,
In the formula,
Formula (6) is expressed in the form of vector matrix to obtain the least squares estimate of
In the formula,
In the formula,
2.2 Design of blood pressure monitoring management module
Blood pressure is a physical quantity in the human body and also a medical term. When a person’s blood vessels are full of blood, the pressure difference between inside and outside is called blood pressure. The blood pressure monitoring and management module is different from the sports monitoring and management module. It does not need to wear sensors all over the body like the sports monitoring and management module. The blood pressure monitoring and management module only uses one blood pressure monitoring sensor as the blood pressure monitoring device, considering that the user’s blood pressure difference does not change much. The module design includes three parts: Data acquisition, data processing and data management. Field bus technology and wireless communication mode are adopted for data acquisition. Data processing adopts PIC24F432 chip based on Advanced RISC Machines (ARM for short) architecture (ARM is a RISC MPU/MCU architecture, just as x86 architecture is a CISC architecture. In addition, there are MIPS architecture, PowerPC architecture, etc.) as the core processor and LCD as the terminal device. In the management part, the SCM is used to control the modules of the system and store and manage the data.
The system uses pressure sensor to monitor blood pressure. The blood pressure value is sent to the upper computer (server) through wireless communication, and users can check their blood pressure data on the upper computer and adjust it remotely. The whole system includes the main control module, communication transmission interface module and upper computer management interface. The working principles of each part are as follows: The main control part is composed of MoneyWise Credit Union (MCU)+PIC24F432 processor, in which user information (such as blood pressure) is stored and can be sent to the upper computer through wireless communication; the communication transmission interface module adopts ARM architecture chip PIC24F432 processor, which is connected with the main control module through RJ45 interface, and sends the received blood pressure value to the host computer, which would receive the data sent by the user, and finally complete the monitoring of blood pressure. The use of blood pressure monitoring equipment is shown in Figure 3.
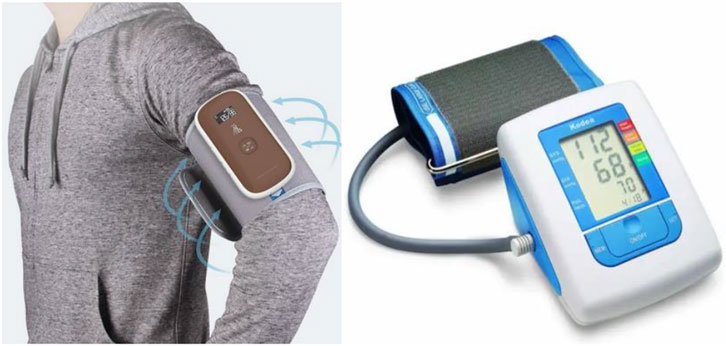
FIGURE 3. Use diagram of blood pressure monitoring equipment.
2.3 Design of temperature monitoring management module
The design of the temperature monitoring management module is a temperature measurement system based on the Internet of Things technology. It uses infrared thermal imaging technology and intelligent chips to achieve the function of temperature detection. At the same time, it can process the temperature data and manage it through wireless transmission to the background server, realizing the remote real-time monitoring of temperature data and real-time big data analysis and processing capabilities. The system has the functions of body temperature measurement, data processing and management. It uses the combination of wireless transmission and infrared temperature measurement to transmit the human body temperature change signal to the background server through wireless communication, and has the functions of real-time temperature collection, storage and statistical analysis. The infrared temperature sensor uses the MSP430 single-chip microcomputer as the main control module. MSP430 series single-chip microcomputer is a 16 bit ultra-low power mixed signal processor with Reduced Instruction Set Computing (RISC) introduced to the market by Texas Instruments (TI) in 1996. It is called mixed signal processor because it integrates multiple analog circuits, digital circuit modules and microprocessors with different functions on one chip to provide a “single chip microcomputer” solution for practical application needs. This series of single chip computers are mostly used in portable instruments that need battery power supply, which can identify the human body through the infrared sensor, and communicate with the computer end in combination with the General Packet Radio Service (GPRS) module on the wireless communication module to transmit relevant information to the server end.
The system adopts the principle of infrared temperature measurement when measuring the temperature of human body. The principle of infrared imaging is that when the infrared ray emitted by an object is the same as the infrared radiation wavelength generated by the human body, reflection would occur. The material that is radiated to the human body by the infrared ray has a thermal effect due to absorbing a certain amount of radiant energy, which increases the temperature of the object. The higher the temperature is, the darker and hotter the color displayed on the thermometer would be. This process can be used to measure the body temperature. After getting the temperature data, the system would upload the data to the platform, and the platform would record and collate the data, and then send the data to users, so that users can know their temperature status at any time. If the user’s body temperature is abnormal, the platform would intelligently remind the user of abnormal body temperature by detecting abnormal data, and the user can find it at the first time and take corresponding measures to adjust it, so as to protect the health to the greatest extent. The use of temperature monitoring equipment is shown in Figure 4.
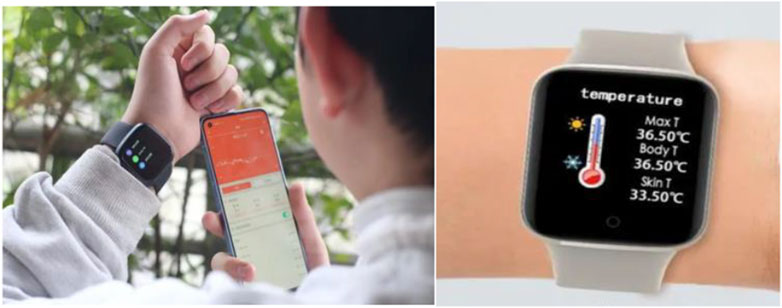
FIGURE 4. Use diagram of temperature monitoring equipment.
3 Health monitoring management system module test experiment
In order to verify whether the sports health monitoring and management system is effective, this experiment invited an athlete to test the sports health monitoring and management system, which mainly recorded the data generated by each module under different states of users, and whether the system would conduct intelligent analysis of the data and remind users. This experiment mainly recorded the data of three physical states of users, namely, the state of exercise, the state of relaxation and the state of illness. This paper observed whether each module can effectively generate data in different states, and the accuracy of the data, so as to achieve the purpose of detecting whether the health monitoring management system is effective.
3.1 Health monitoring management system movement state test
After the user correctly wears all the equipment as required, he or she has carried out the 1,000 m long distance running training according to the sports requirements. Through the operation of the sports monitoring management module, temperature monitoring management module and blood pressure monitoring management module of the sports health monitoring management system, the following data tables were obtained. The sports status data monitoring table is shown in Table 1.
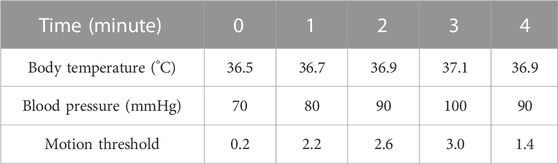
TABLE 1. Motion status data monitoring table.
According to the sports state data monitoring table, it can be seen that the sports health monitoring and management system had data output in each module when athletes were training, which indicated that the sports health monitoring and management system had no problems in the sports state and can operate normally. On the premise of ensuring the normal operation of the sports health monitoring management system under the state of sports, it is also necessary to judge the data produced by each module to determine whether there are errors and abnormalities in the data [10]. In the temperature module data monitoring, the temperature of normal people was between 36.5 and 37.5, and the temperature data in the table did not exceed the normal range, indicating that the temperature monitoring system module data was accurate. In the blood pressure module data monitoring, the diastolic blood pressure was used. Generally, the normal range of human diastolic blood pressure was 70–90, but the blood pressure in the exercise state would change according to the exercise intensity. The greater the exercise intensity, the more intense the exercise, and the higher the blood pressure value. Therefore, the blood pressure value of 100 values monitored in the data table was also within the acceptable range [11, 12]. From the monitoring data of the blood pressure module, the blood pressure value was generally stable within the normal range, and exceeded the normal range at 3 min. However, the blood pressure data appreciation was within the normal value-added range, and there was no obvious abnormality, so it can be considered that the data of the blood pressure monitoring system module was accurate. In the motion module data monitoring, the minimum lower limit of the motion threshold was set to 0. According to the motion threshold data in the table, all the motion threshold data were above 0, which indicated that the motion monitoring module was working normally, and the motion threshold data was calculated correctly. Through the judgment of the above data, the sports health monitoring system worked normally under the state of sports, and the output data was free of errors and exceptions, belonging to the health range. The system would not make warning processing and make intelligent backup of this data, and store it for users to view in the future [13].
3.2 Relaxation state test of health monitoring management system
In order to ensure the accuracy and preciseness of the test results, the following is the data record of the user’s physical health status in a random period of time in daily life. The relaxation status data monitoring table is shown in Table 2.

TABLE 2. Relaxation state data monitoring table.
It can be seen from the relaxation state data monitoring table that the sports health monitoring management system had data output in each module of the athletes’ daily activities, which indicated that the sports health monitoring management system was not a problem in the daily relaxation state and can be used normally. After confirming that the sports health monitoring and management system can normally output data in the daily state, it needs to test and judge the output data in the daily state. In the temperature module data monitoring, the temperature monitoring data was always stable at about 36.5°. Considering that the athletes were in a relaxed state and their body temperature was within the normal body temperature range, it can be judged that the temperature monitoring module data was normal and accurate. In the data monitoring of blood pressure module, the diastolic blood pressure value was stable between 70–80, which belonged to the category of normal blood pressure value. It can be judged that the data of blood pressure monitoring module was normal and correct. In the data monitoring of the sports module, the sports threshold data was stable between 0–1. Combined with the fact that the athletes were in a relaxed state at this time, it showed that the sports threshold data was no problem, and it can be judged that the sports monitoring module data was normal and correct. Through the judgment of the above data, the sports health monitoring and management system under the daily relaxed state met the requirements of normal work, and the output data had no error or abnormality, which belonged to the health range. The system would not do warning processing and make intelligent backup of this data, and store it for users to view in the future.
3.3 Illness state test of health monitoring management system
In order to ensure that the sports health detection management system can effectively detect users in real time in case of an accident, this test was conducted during the period when athletes were sick and had fever. When it was known that the athlete had a cold and fever, the whole body sensor was worn for the athlete, and the following table was obtained according to the data generated by sensor induction. The data monitoring table of illness status is shown in Table 3.

TABLE 3. Illness status data monitoring table.
According to the sick condition data monitoring table, the sports health monitoring management system still had data output in each module when the athletes were sick, which indicated that the sports health monitoring management system had no problems even when the users were sick, and can be used normally. After confirming that the sports health monitoring and management system can normally output data in the sick state, it is necessary to test and judge the output data in the sick state. In the temperature module data monitoring, the temperature monitoring data showed that the user’s temperature was about 38.4°, and the temperature fluctuation was small. Combined with the known symptoms of cold and fever, it can be judged that there was no problem in the temperature module data monitoring. In the blood pressure module data monitoring, the diastolic blood pressure fluctuated between 90 and 100, with a small fluctuation range, and the blood pressure fluctuated around the critical point of the normal value. In combination with the user’s cold and fever symptoms, it showed that the blood pressure module monitoring data was correct, and the monitoring value was more accurate. In the data monitoring of the sports module, the sports threshold data was stable between 0.1–0.2. Considering that the athletes were ill at this time and their physical movements were affected by the disease, the athletes were lying in bed recuperating. There was no problem that the motion threshold data value was close to 0, and it can be judged that the motion monitoring module data was normal and correct. Through the judgment of the above data, the sports health monitoring and management system can also operate normally when the user was ill. The system judged that the user was ill at this time according to the user’s body data. The system would upload the data to the terminal platform, and the platform would timely back up the monitoring data and issue a health warning to the user, remind the user of the health risks, and timely seek medical advice for adjustment [14].
In order to ensure the preciseness and scientificity of the test, this test used professional instruments and equipment to test the same test items after obtaining the corresponding data by using the sports health monitoring management system to obtain the monitoring data of professional equipment. Through the comparison of the two kinds of data, it was finally confirmed that the monitoring data of the sports health monitoring management system was accurate, and also confirmed that the sports health monitoring management system designed in this experiment was effective and feasible [15, 16].
4 Evaluation of test data of health monitoring management system
On the premise that the sports health monitoring and management system can operate normally and produce accurate and effective data, it is necessary to compare and analyze the test data of this experiment. Through the analysis of the data of each module, people can clearly grasp the various data indicators of users at different times and in different physical states, so as to achieve the purpose of real-time monitoring.
4.1 Data evaluation of temperature and blood pressure monitoring module
According to the temperature and blood pressure data generated by users in different states, this paper conducted an integrated analysis of such data and obtained the following comparative analysis diagram of temperature and blood pressure data, as shown in Figure 5 (Figure 5A is the comparative analysis diagram of temperature data, and Figure 5B is the comparative analysis diagram of blood pressure data).
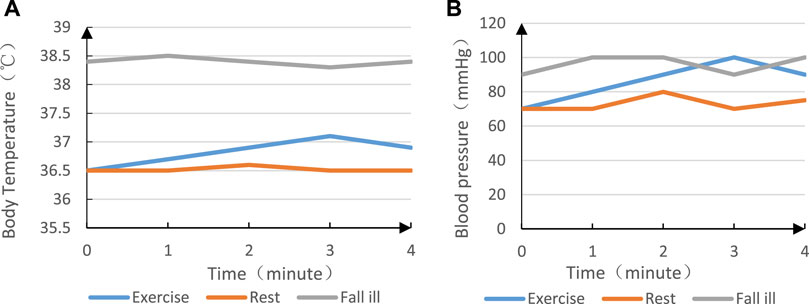
FIGURE 5. (A) Comparative analysis diagram of temperature data, (B) Comparative analysis diagram of blood pressure data.
It can be seen from the comparative analysis chart of body temperature data in Figure A that the lowest and highest body temperature were 36.5° and 37.1°,, respectively during exercise, which indicated that during exercise, the body temperature would gradually generate heat with vigorous exercise. This is because the body muscle is consuming internal energy, which is expelled by the body in various ways. One way is to release energy by raising the body temperature. Of course, the body has its own regulation system, and the heat emission of this body temperature would have a safe value to ensure that the body would not react due to heat emission. The body temperature dropped between 3 and 4 min, indicating that the athletes began to slow down the exercise intensity between 3 and 4 min, so the body temperature also began to adjust and reduce the body temperature according to the body changes. In the resting state, the maximum body temperature was 36.6°; the minimum was 36.5°; the temperature difference was only 0.1°. This showed that the body temperature was almost constant in the resting state, which also conformed to the scientific fact that human beings were thermostatic animals. In the state of illness, the human body temperature was at least 38.3°C and at most 38.5°C; the temperature difference was 0.2°C; the temperature difference fluctuated slightly; the overall body temperature was above 38°C, which indicated that the user had a high fever. In this case, the system would backup the data and send it to the platform to remind the platform that the temperature data was abnormal.
It can be seen from the comparative analysis chart of blood pressure data in Figure B that the lowest blood pressure value was 70, the highest blood pressure value was 100, and the blood pressure difference was 30. The blood pressure fluctuated greatly. Between 0 and 3 min, the blood pressure value had an obvious upward trend, which indicated that during the exercise, the blood flow speed would accelerate with the exercise, thus increasing the blood pressure, and leading to a gradual increase in blood pressure. In 3–4 min, the blood pressure value had a downward trend, indicating that the athletes began to slow down the intensity of exercise at this time, and the reduction of the amount of exercise led to the slow down of the blood flow, thus reducing the blood pressure. In the resting state, the lowest blood pressure value of the athletes was 70; the highest was 80; the blood pressure difference was 10. During the rest period of athletes, the fluctuation range of blood pressure was not large, and it was within the range of normal blood pressure, which indicated that athletes were engaged in daily activities during the rest period. As long as the human body moves, the blood pressure value would fluctuate slightly, which would be within a normal range, while the blood pressure fluctuation of athletes belongs to the normal range, so it can indicate that the physical health of athletes at this time was good. In the state of illness, the lowest blood pressure value of the athletes was 90; the highest was 100; the blood pressure difference was 10. At this time, although the athletes’ blood pressure difference changed little and the blood pressure fluctuation amplitude was not large, the overall blood pressure value has exceeded 90, which was beyond the normal and healthy blood pressure value range. Therefore, the system would record and backup the blood pressure value during this period, and send the data to the platform to warn the platform of abnormal blood pressure data.
4.2 Data evaluation of motion monitoring module
According to the motion threshold data generated by users in different states, this paper integrated and analyzed such data, and obtained the following comparative analysis diagram of motion threshold data, as shown in Figure 6.
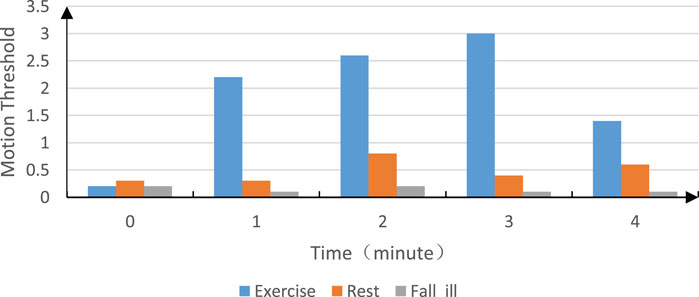
FIGURE 6. Comparison and analysis of motion threshold data.
It can be seen from the comparative analysis diagram of the sports threshold data that, in the sports state, the value of the sports threshold changed obviously, and the fluctuation of the value amplitude was very large. The lowest sports threshold was 0.2. At this time, the athletes should be in the sports preparation stage, and the change amplitude of the body movement was small. Between 1 and 3 min, the exercise threshold exceeded the standard threshold of two and reached the maximum of 3, indicating that the athletes were in running state at this time, and the whole body movement range was quite large. Between 3–4 min, the exercise threshold began to drop rapidly, and the threshold fell from 3 to 1.4, indicating that the athletes had finished strenuous exercise and began to turn to normal physical activities. In the rest state, the fluctuation range of motion threshold data was generally; the lowest was 0.3; the highest was 0.8; the threshold difference was 0.5. This showed that the athletes were relaxed and in a relatively comfortable state of rest and adjustment with a small range of whole body movement. In the sick state, the movement threshold value changed little; the highest value was 0.2; the lowest value was 0.1; the threshold difference was 0.1. It indicated that the athlete was almost in a relatively static state at this time, and the system would back up this data and send it to the platform for processing [17].
The platform would analyze and process the data transmitted by each module at the same time, and intelligently judge whether users have health problems by combining various data [18]. The following is the judgment table of data transmitted from each module by the platform in different states, as shown in Table 4.
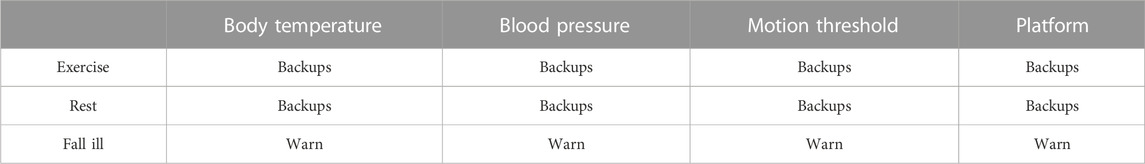
TABLE 4. Platform module data judgment table.
It can be seen from the data judgment table of the platform module that, in the state of exercise and rest, each module would back up and upload data to the platform. The platform intelligently judged the current physical condition of the user by comparing the data of each module. According to the data, the user was in good health when exercising and resting. Therefore, the health data was not pushed but backed up. When each module of the system detects abnormal physical conditions, the module would send a warning to the platform. The platform would conduct intelligent analysis based on the data of each module and draw a conclusion that the user has health problems. The platform would immediately send the data to the user and give a warning to remind the user that there are potential health problems.
5 Conclusion
This paper has made some attempts to improve the existing health monitoring and management system. From the test results, the sports health monitoring and management system in this test experiment was generally successful. The system combined three functions of body temperature, blood pressure and exercise status. Each module sent data to the platform through information transmission. The platform intelligently analyzed the data and sent health information to users, which was a new attempt in the field of health monitoring. The system monitored three different state scenes in daily life, namely, movement state, rest state and illness state. Under different conditions, the maximum temperature data monitored by the temperature monitoring module was 38.5°C, and the minimum temperature data was 36.5°C. The maximum monitored blood pressure data of the blood pressure monitoring module was 100, and the minimum data was 70. The maximum monitored motion threshold data of the motion monitoring module was 3.0, and the minimum data was 0.1. The system would back up and upload these data accordingly, and the platform would intelligently analyze the user’s health status based on the uploaded data to determine whether to push health information. In general, the sports health monitoring management system conforms to the use of most current scenarios, and is an important direction of future development in the field of health monitoring. Although there are still some problems with the system at present, such as inconvenient to wear the device, it is believed that in the near future, there would be a more perfect system to overcome the existing difficulties and problems.
Data availability statement
The original contributions presented in the study are included in the article/supplementary material, further inquiries can be directed to the corresponding author.
Author contributions
YT: Writing original paper and LY: Methods. All authors contributed to the article and approved the submitted version.
Conflict of interest
The authors declare that the research was conducted in the absence of any commercial or financial relationships that could be construed as a potential conflict of interest.
Publisher’s note
All claims expressed in this article are solely those of the authors and do not necessarily represent those of their affiliated organizations, or those of the publisher, the editors and the reviewers. Any product that may be evaluated in this article, or claim that may be made by its manufacturer, is not guaranteed or endorsed by the publisher.
References
1. Islam M, Rahaman A, Islam MR. Development of smart healthcare monitoring system in IoT environment. SN Comput Sci (2020) 1:185–11. doi:10.1007/s42979-020-00195-y
2. Al-Khafajiy M, Baker T, Chalmers C, Asim M, Kolivand H, Fahim M, et al. Remote health monitoring of elderly through wearable sensors. Multimedia Tools Appl (2019) 78:24681–706. doi:10.1007/s11042-018-7134-7
3. El-Sappagh S, Ali F, Hendawi A, Jang JH, Kwak KS. A mobile health monitoring-and-treatment system based on integration of the SSN sensor ontology and the HL7 FHIR standard. BMC Med Inform Decis making (2019) 19:97–36. doi:10.1186/s12911-019-0806-z
4. Carter D, Kolencik J, Cug J. Smart internet of things-enabled mobile-based health monitoring systems and medical big data in COVID-19 telemedicine. Am J Med Res (2021) 8:20–9.
5. Talal M, Zaidan AA, Zaidan BB, Albahri AS, Alamoodi AH, Albahri OS, et al. Smart home-based IoT for real-time and secure remote health monitoring of triage and priority system using body sensors: Multi-driven systematic review. J Med Syst (2019) 43:42–34. doi:10.1007/s10916-019-1158-z
6. Di Nuzzo F, Polonelli T, Benini L. Structural health monitoring system with narrowband IoT and MEMS sensors. IEEE Sensors J (2021) 21:16371–80. doi:10.1109/jsen.2021.3075093
7. Yang H, Kan C, Krall A, Finke D. Network modeling and internet of things for smart and connected health systems—A case study for smart heart health monitoring and management. IISE Trans Healthc Syst Eng (2020) 10:159–71. doi:10.1080/24725579.2020.1741738
8. Ha M, Lim S, Ko H. Wearable and flexible sensors for user-interactive health-monitoring devices. J Mater Chem B (2018) 6:4043–64. doi:10.1039/c8tb01063c
9. Albahri OS, Albahri AS, Mohammed KI, Zaidan AA, Zaidan BB, Hashim M, et al. Systematic review of real-time remote health monitoring system in triage and priority-based sensor technology: Taxonomy, open challenges, motivation and recommendations. J Med Syst (2018) 42:80–27. doi:10.1007/s10916-018-0943-4
10. Kim J, Campbell AS, de Avila BEF, Wang J. Wearable biosensors for healthcare monitoring. Nat Biotechnol (2019) 37:389–406. doi:10.1038/s41587-019-0045-y
11. Tyagi D, Wang H, Huang W, Hu L, Tang Y, Guo Z, et al. Recent advances in two-dimensional-material-based sensing technology toward health and environmental monitoring applications. Nanoscale (2020) 12:3535–59. doi:10.1039/c9nr10178k
12. Ning Z, Dong P, Wang X, Hu X, Guo L, Hu B, et al. Mobile edge computing enabled 5G health monitoring for internet of medical things: A decentralized game theoretic approach. IEEE J Selected Areas Commun (2020) 39:463–78. doi:10.1109/jsac.2020.3020645
13. Raza M, Awais M, Singh N, Imran M, Hussain S. Intelligent IoT framework for indoor healthcare monitoring of Parkinson’s disease patient. IEEE J Selected Areas Commun (2020) 39:593–602. doi:10.1109/jsac.2020.3021571
14. Byerly K. Real-time big data processing and wearable Internet of medical things sensor devices for health monitoring. Am J Med Res (2019) 6:67–72. doi:10.22381/AJMR62201910
15. Kalid N, Zaidan AA, Zaidan BB, Salman OH, Hashim M, Muzammil H. Based real time remote health monitoring systems: A review on patients prioritization and related" big data" using body sensors information and communication technology. J Med Syst (2018) 42:30. doi:10.1007/s10916-017-0883-4
16. Tabassum K, Shaiba H, Essa NA, Elbadie HA. An efficient emergency patient monitoring based on mobile ad hoc networks. J Organizational End User Computing(forthcoming) (2022) 34:1–12. doi:10.4018/JOEUC.289435
17. Lu B. Intelligent control system of physical strength in sports based on independent component analysis. Neural Comput Applic (2023) 35:4397–408. doi:10.1007/s00521-022-07093-9
Keywords: sports health monitoring and management system, artificial intelligence algorithms, body temperature monitoring, monitoring of blood pressure, artificial intelligence
Citation: Tong Y and Ye L (2023) Sports health monitoring management system based on artificial intelligence algorithm. Front. Phys. 11:1141944. doi: 10.3389/fphy.2023.1141944
Received: 11 January 2023; Accepted: 20 February 2023;
Published: 07 March 2023.
Edited by:
Amrit Mukherjee, University of South Bohemia in České Budějovice, CzechiaReviewed by:
Hu Qinhui, Guilin University of Aerospace Technology, ChinaHongping Cao, University of Warsaw, Poland
Copyright © 2023 Tong and Ye. This is an open-access article distributed under the terms of the Creative Commons Attribution License (CC BY). The use, distribution or reproduction in other forums is permitted, provided the original author(s) and the copyright owner(s) are credited and that the original publication in this journal is cited, in accordance with accepted academic practice. No use, distribution or reproduction is permitted which does not comply with these terms.
*Correspondence: Yunlong Tong, amxzZHR5bEBqbG51LmVkdS5jbg==