 Shujie Jiang
 Lanqing Li2
94% of researchers rate our articles as excellent or good
Learn more about the work of our research integrity team to safeguard the quality of each article we publish.
Find out more
ORIGINAL RESEARCH article
Front. Phys., 16 February 2023
Sec. Statistical and Computational Physics
Volume 11 - 2023 | https://doi.org/10.3389/fphy.2023.1136539
This article is part of the Research TopicMoving Boundary Problems in Multi-physics Coupling ProcessesView all 16 articles
The noise generated by the interaction between the wake of rods and airfoils is a universal phenomenon in the engineering field. The noise generation mechanism is mainly caused by the violent changes of the pulsating pressure on the airfoil surface, impacted by different vortex scales in the wake of rods. During this process, the energy is radiated outward by sound waves. To capture wakes and the sound generated by the interaction of rod-airfoil with relatively small computing resources is a challenge. In this paper, the sound pressure generated by the rod-airfoil interaction is calculated by solving the Reynolds average N-S equation and non-linear acoustic equations. This numerical method is verified by a rod-airfoil interaction benchmark. This paper focuses on the influence of offset distances between rods and airfoils. The results show that the peak of far-field sound decreases from 89 dB to 80.6 dB as the offset distance from the airfoil to the center of the cylinder increases (the maximum deviation is three times the cylinder diameter). The frequency of peak sound pressure also shifts.
In recent years, aircraft noise has become one of the major problems due to the rapid increase in air traffic. Aerodynamic noise reduction is also one of the key issues in modern civil aircraft design in the past several decades. However, the noise generation mechanism is very complex for most engineering applications. For example, the strong interactions between the vortex shedding from the upstream flow and the airfoils downstream are one of the most important effects in the noise generation of landing gears [1].
There are mainly four types of numerical aeroacoustic prediction methods [2], including the pure theoretical method [3], the semi-empirical method [4], the direct numerical method, and the hybrid method [5, 6]. At present, the hybrid method is a commonly used numerical simulation method for aeroacoustic calculations. For example, combining computational fluid dynamics (CFD) methods such as URANS, LES [7, 8], and DES [9, 10] with acoustic analogy methods. First, the sound source information is obtained by CFD calculation, and then the source information is brought into the FW-H formula to calculate the far-field noise. Chen et al. [11] used the LES/FW-H combination method to predict the acoustic noise of the rod-airfoil interaction. They found that the first 30% chord length region near the leading edge was the main noise source. Bai et al. [12, 13] compared the aerodynamic noise of the rod-airfoil model by using URANS/FW-H and DES/FW-H methods. They pointed out that the DES method was better than the URANS method. Li et al. [14] used the DDES/FW-H method to analyze the effect of distance between rods and airfoils. They found the far-field sound got its maximum when the distance equals the chord length of the airfoil.
Numerical methods have been widely used in acoustic simulation, DES/FW-H and LES/FW-H methods are more widely used by scholars because of their better accuracy, but these two methods have high requirements for computational resources. Many efforts have been made to reduce the computational cost. Chen et al. [15–22] developed the isogeometric boundary element methods to perform acoustic topology optimization for sound absorbing materials. Their method enables acoustic topology optimization to be conducted directly from CAD models without any meshing procedures and meanwhile eliminating geometric errors. In order to save computing resources, Morris et al. [23] first proposed the RANS/non-linear acoustics solver (NLAS) method to predict the noise generation and transmission from an initial statistically steady model of the turbulent flow data, which can be provided by a simple RANS simulation and no requirement from the LES simulation. Batten et al. [24, 25] improved the RANS/NLAS method with more robustness and efficiency. The NLAS method can take sub-grid sound sources into consideration by reconstructing turbulent physical quantities. This can reduce computational resources and keep a relatively high resolution at the same time. In recent years, the RANS/NLAS method has become more and more popular. The application can be found for trains [26, 27], aircrafts [28, 29], and rockets [30].
In practical engineering fields, it is common where the airfoils are not directly behind the upstream rods, such as the landing gear shown in Figure 1. There is a certain offset between the rod and the main branch of a landing gear. Therefore, it is important to consider the impact of this offset distance on rod-airfoil interaction noise. This paper investigates the effect of different offset distances for sound generation using a combined RANS/NLAS approach.
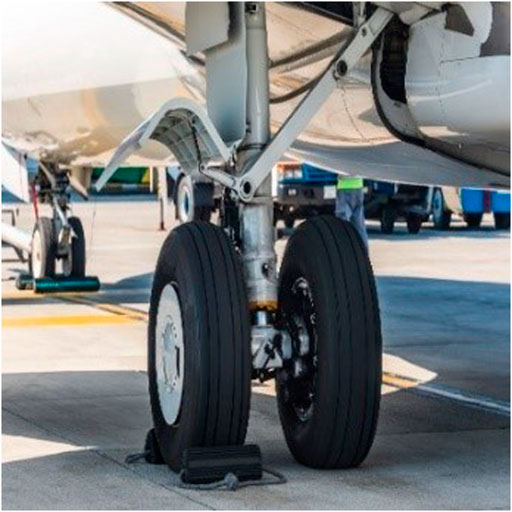
FIGURE 1. Aircraft landing gear.
NLAS provides a more sophisticated subgrid treatment that allows the extraction of acoustic sources from the temporal variation within the modeled subgrid structures. The quasi-steady near-wall RANS solution is obtained a priori so that the grid requirements can be relaxed and reduced in the near-wall region during the NLAS transient calculation, compared to the LES solvers. At the same time, the dissipation effects of a subgrid eddy viscosity model are avoided; Thus, the NLAS solver proves less dissipation than the classic LES or hybrid RANS/LES simulation on course meshes (Figure 2). One of the most important advantages of the NLAS is able to account for both the turbulence-related broadband noise and the discrete tones produced from coherent structures or resonance [24].
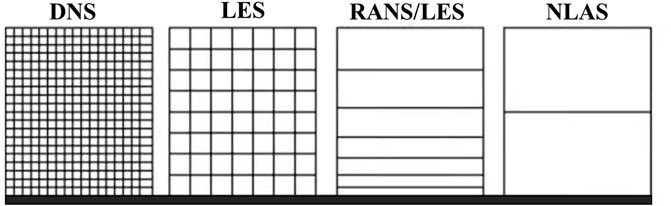
FIGURE 2. Common method near-wall mesh requirement.
The NLAS control equation is derived from the N-S equations by dividing each term in the equation into the mean and the fluctuation terms,
where.
Q′ is the transient fluctuation term;
The specific expressions are:
Neglecting the density fluctuation and taking a time average of the Eq. 2:
Ri is a correlation of the standard Reynolds stress tensor and turbulent heat flux:
The key step in NLAS is to obtain these unknown terms in advance from the classical RANS method. The small-scale quantities which cannot be solved are obtained by turbulent reconstruction generated by the subgrid source terms. The turbulent reconstruction method is proposed by Batten [25]. After both the mean levels and subgrid sources are established, the time-dependent calculations can then be carried out to determine the transmitted perturbations around the mean flows by using the above non-linear disturbance equations. The sound pressure in far-field observers can be calculated by the FW-H equations given by Farassat et al. [31, 32]. The flow field information is obtained by NLAS.
In order to reduce the amount of mesh during the numerical simulation, the numerical models are usually modified or simplified from the experiment models. For example, the span of the experiment airfoil L is much bigger than the chord c. In order to use the lower mesh number, the span of the numerical simulation can be reduced from L to Ls, which is smaller than the chord c. Then, the aeroacoustic calculation can be speeded up extensively; However, the aeroacoustic sound pressure level (SPL) obtained from the numerical results, and the experimental results cannot be compared directly. In such cases, some corrections have to be introduced to the numerical sound pressure level (SPL). In the paper, we use the correction method first proposed by Kato et al [33, 34].
When
when
when
The validation benchmark is given by the experiment data of Jacob [35]. In the experiment (Figure 3), the NACA0012 airfoil (with chord length c = 0.1 m) is located at one-chord length after the cylinder (with diameter d = 0.01 m), both extending by L = 0.3 m in the spanwise direction. The acoustic far-field receiver is at 1.85 m from the airfoil center. The incoming flow velocity is 72 m/s and the Reynolds number of the cylinder is 48,000. The experiment was conducted in an anechoic room (10 m × 8 m × 8 m). The air was supplied by a high-speed subsonic anechoic wind tunnel at Mach numbers ranging up to 0.34.
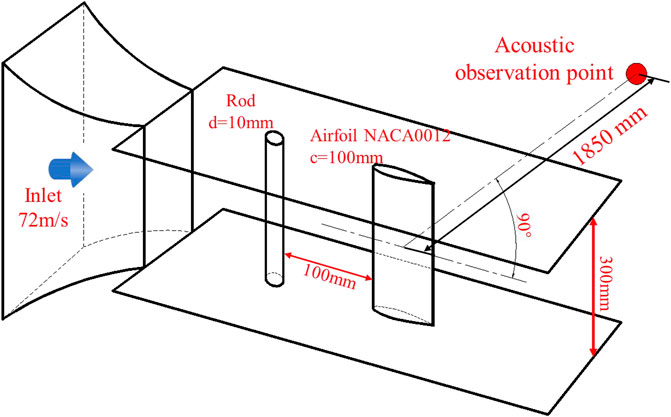
FIGURE 3. Schematic diagram of Jacob test wind tunnel installation.
In order to reduce the computational cost, the span of the numerical model is set as 0.05 m which is smaller than the experiment model (L = 0.3 m). The simulation domain was X (−0.2 m, 0.3 m), Y (−0.2 m, 0.2 m), and Z (−0.05 m, 0 m). After the grid convergence check, the multiblock structure meshes with 3 million (mesh cell number) computational grids were used for the RANS/NLAS simulation. The first interior point was located at y+ < 1 from the airfoil surface, yielding a sufficient resolution of the viscous sublayer. In the RANS simulation, the cubic k-e turbulence model was used. NLAS provided a more sophisticated subgrid treatment that allowed the extraction of acoustic sources from the temporal variation within the modeled subgrid structures. In this paper, the subgrid for NLAS was x (−0.15 m, 0.15 m), y (−0.1 m, 0.1 m), and z (−0.05 m, 0 m) with the resolution ratio 0.002.
Four offset distances (D = 0d, 0.5d, 1d, and 3d) are used to reveal the effect of offset distances. The simulation domain and offset distances can be found in Figure 4.
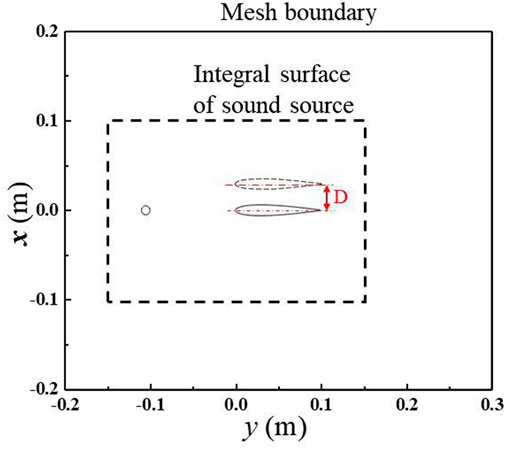
FIGURE 4. Simulation domain and offset distances.
RANS calculations were carried out to obtain a statistical average of the local Reynolds stress tensor and heat flux. Then they were interpolated into the NLAS noise calculation grid. The turbulence flow is reconstructed based on this statistical average. The velocity inlet was applied in the left boundary. The outflow boundary was used in the right boundary. The far-field and periodic boundary are used in the up/down and the spanwise direction. The viscous non-slip adiabatic wall condition was applied for cylinders and airfoils.
The flow velocity (on the line x/c = 0.25 and 0 < y/c < 0.6, as show in Figure 5A.), obtained from the RANS, was compared with the experimental results in Jacob’s literature ([35]), as shown in Figure 5B. It can be seen that the velocity variation trend obtained from the RANS calculation in this paper is the same as the URANS method used in the literature ([35]). Both methods differ significantly from the experimental variation trend within 0.06 < y/c < 0.26; however, for the region y/c > 0.26, the results of the RANS calculations in this paper are closer to the experimental data than the URANS method.
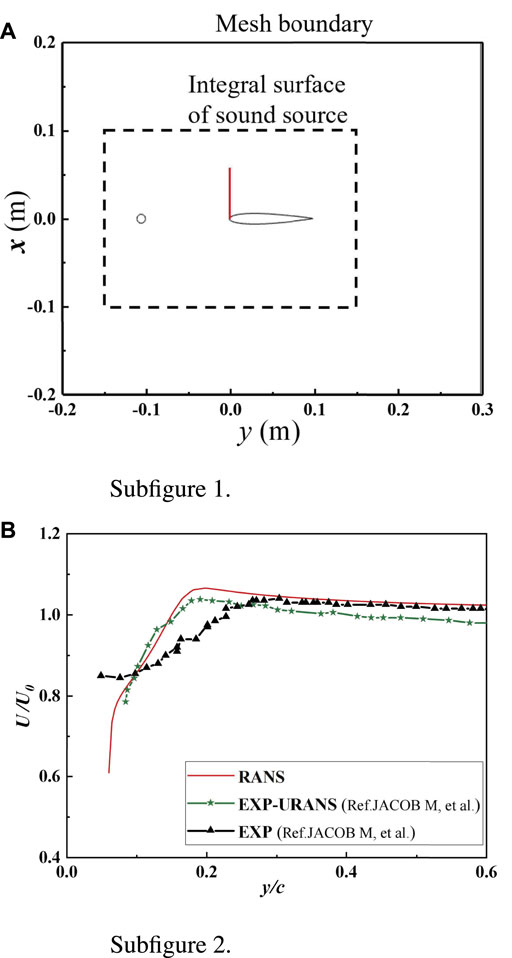
FIGURE 5. (A) Subfigure 1 is the locations of the x/c = 0.25 and 0 < y/c < 0.6. (B) Subfigure 2 is the average flow velocity on the straight line x/c = 0.25.
The instantaneous Cl for the cylinder is given in Figure 6. The Cl presents a sinusoidal oscillation mode which means the convergence.
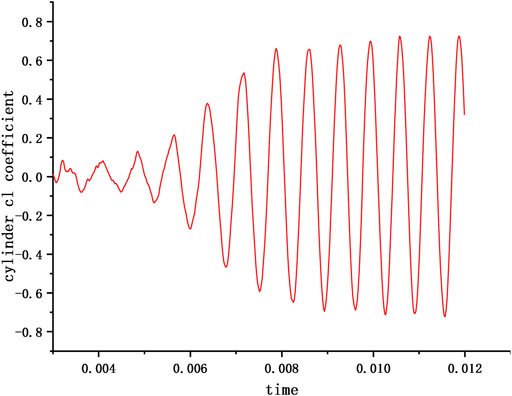
FIGURE 6. Cylinder cl coefficient.
Figure 7 shows the vorticity contours obtained from the URANS calculations, the large-scale vortices at the trailing edge of the cylinder are continuously shedding and spreading downstream to the leading edge of the wing. The wake of the cylinder interacts with the leading edge of airfoils and generates unsteady pressure fluctuation across the airfoil surface.
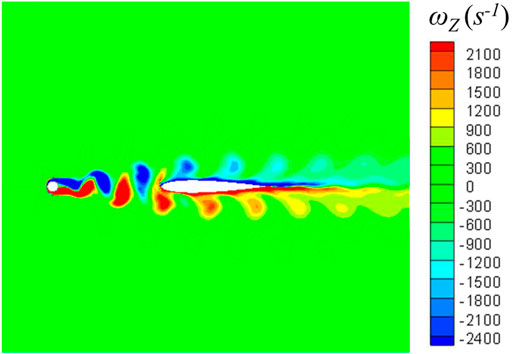
FIGURE 7. z-direction partial vorticity diagram.
The RANS calculation results were interpolated to the NLAS grid with turbulent reconstruction for acoustic calculations. The numerical time step is Δt = 2 × 10⁻⁵ s, and the simulation is performed 4,000 steps in total, the simulation is performed using AMD EPYC 7452 with 64 cores for about 20 h. In this paper, the numerical model span is smaller than the experimental model span, and the correction of Eq. 5 is used to correct the acoustic results accordingly.
Figure 8 shows the comparison between the NLAS used in this paper and several calculation methods (LES [35], URANS [13], DES [9]) in the literature. It is found that the sound pressure levels obtained by all four calculation methods are higher than the experimental values in the low-frequency range of 300 Hz–900 Hz. The peak sound pressure obtained by the NLAS method is almost the same as the experimental data and is more accurate than the other methods. Above 1700 Hz, the results obtained by EASM DES and NLAS method are closer to the experimental values. It shows that the NLAS method is able to capture the sound pressure accurately in most frequencies and with an acceptable computational cost.
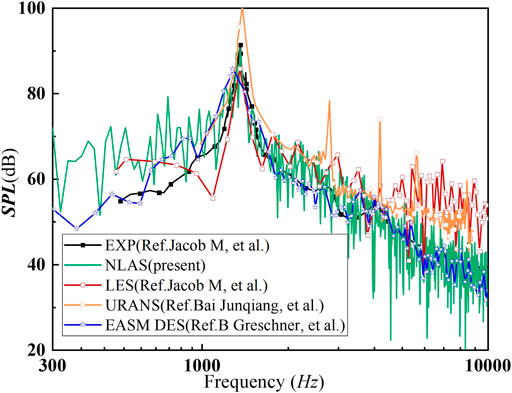
FIGURE 8. Comparison of acoustic calculation methods.
Four different sets of computational mesh are used to test the grid independence. As shown in Figure 9, the peak sound pressure level is 91 dB at 1,365 Hz in the experiment [35]. The difference for different computational meshes is quite small. The peak sound pressure level and its frequency are compared in Table 1. The maximum difference of peak sound pressure level is less than 4 dB, and the peak frequency is less than 6 dB, which indicates the calculated results are less correlated with the computational grid. In this paper, the number of meshes is chosen to be 2.41 million to give an error of less than 2 dB for both the peak sound pressure level and its frequency.
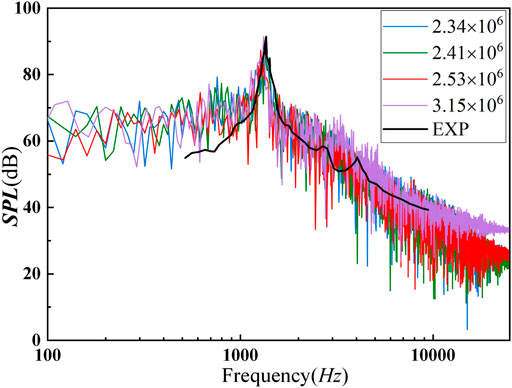
FIGURE 9. Frequency domain acoustic results.
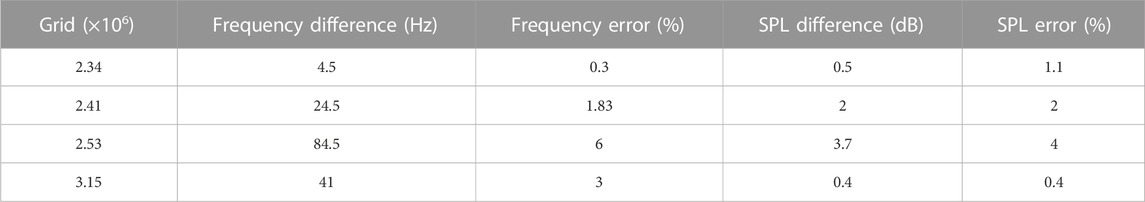
TABLE 1. The effect of the grid on the acoustic results.
In order to analyze the influence of wakes at the trailing edge of the cylinder, different offset distances (0d, 0.5d, 1d, and 3d) are used in this section. The sound pressure is collected in 1.85 m from the center of the wing at zero offset distance. This location is not changed in later research.
Figure 10 shows the variation of vortex intensity at different offset distances calculated by URANS, where the vertical coordinate indicates the vortex intensity ω and the horizontal coordinate indicates distances behind the rod center. The figure shows that the vortex intensities in the wake of the cylinder show a non-linear decreasing trend, and the offset distance has less effect on them. The vortex in the wake of the cylinder dissipates due to the viscous effect of the fluid. The dissipation rate of the vortex is found to be:
where y is the biggest vortex intensity in the wake of the rod and x is the distance behind the rod center.
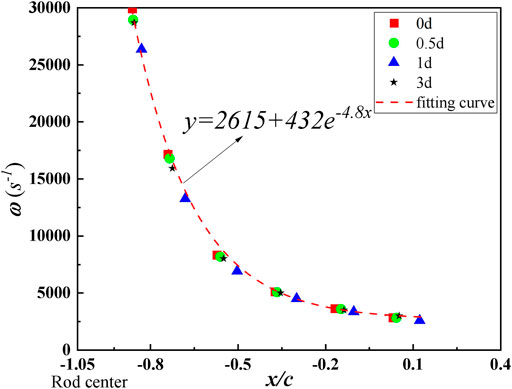
FIGURE 10. Changes in the strength of the vortex center between the rod airfoil with different offsets.
Figure 11 shows the pressure distribution of the airfoil along the chord in the middle span. It is found that only when the offset distance D = 0d the pressure on the upper and lower surfaces of the airfoil shows symmetric changes. With the increase of offset distance in the region near the leading edge (0.014 < x/c < 0.3), the pressure gradually decreases and with a asymmetric distribution. This may be caused by the fact that with the increase of the offset distance, the higher the flow velocity interacts with the leading edge of the airfoil. When the offset distance increases, the airfoil gradually get out of the vortex street influence area, and the flow field around the body is dominated by the velocity field without cylindrical disturbance.
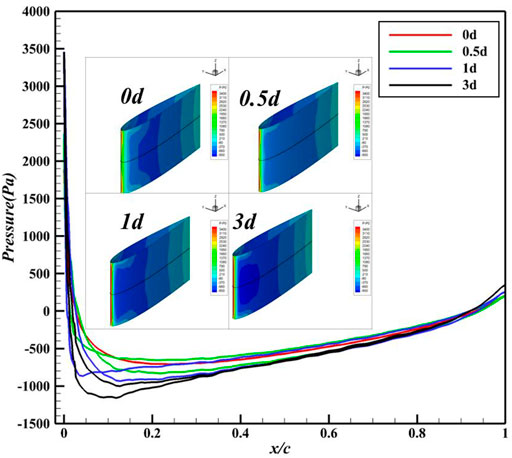
FIGURE 11. Airfoil surface pressure distribution at z = −0.025.
The pressure distribution at the leading edge of airfoils along the spanwise is presented in Figure 12. The pressure in the center of the leading edge is affected by the vortex shedding dramatically. The pressure difference in the center of the leading edge gets its maximum for about 1,300 Pa by comparing D = 0d and D = 3d. This difference decreases with the increase of offset distance D.

FIGURE 12. Pressure distribution on the leading edge of the airfoil.
The size and mesh resolution for the integral surface of sound sources are the same as the benchmark case. After 4,000 steps of NLAS calculation, Figures 13, 14 show the time domain of sound pressure in the time domain and frequency domain, respectively. The variation of peak sound pressure and its frequency are plotted in Figure 15. It can be seen that the sound pressure level decreases gradually with the increase of offset distance, from 89 dB to 80.6 dB. The peak sound frequency decreased significantly when the offset distance changed from 0d to 0.5d. Its frequency did not change significantly when the offset distance changed from 0.5d to 1d and increased slightly from 0.5d to 3d. With the increase of offset distance, the sound pressure level decreases almost linearly from 0d to 1d; From 1d to 3d, the decrease rate slows down significantly.
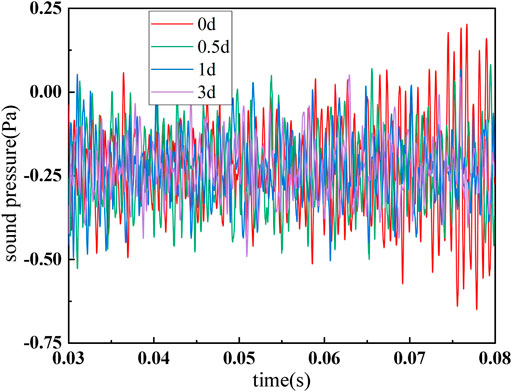
FIGURE 13. Time domain pressure results with different offsets.
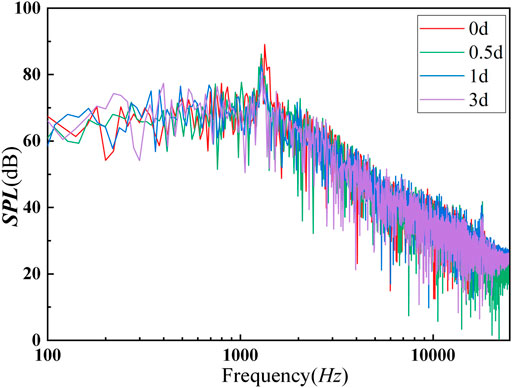
FIGURE 14. Frequency domain acoustic results with different offsets.
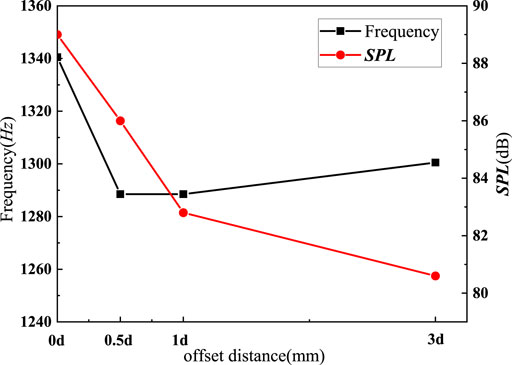
FIGURE 15. The effect of offset on peak sound pressure level.
The Q-criteria contour surfaces (Figure 16) obtained from NLAS show that there are both large-scale vortices and small-scale vortices generated in the wake of the cylinder. With the increase of the offset distance, the interaction between the wake of the cylinder and the leading edge of the airfoil becomes smaller. So the sound pressure decreases, as predicted in Figure 15.
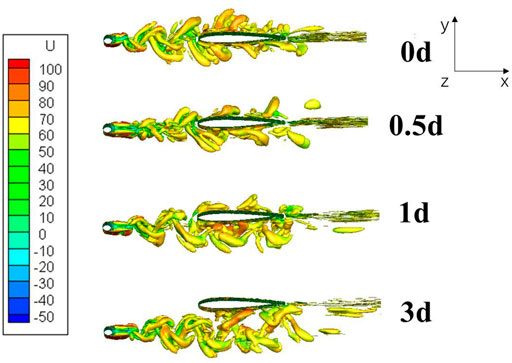
FIGURE 16. The overall Q-criterion iso-surface of different offset models.
In order to capture the aerodynamic noise with a relatively small computational cost, this paper performs the RANS/NLAS numerical simulation method to study the noise generation by rod-airfoil interaction. This method is verified by experimental results. A very good agreement can be found for four different mesh resolutions. This paper focuses on the effect of offset distance for rod-airfoil interaction noise. It is found the wake behind the cylinder decays with the distance behind the cylinder non-linearly. The offset distance plays no role in this process. The existence of airfoil affects this decay process little. Besides, with the increase of offset distance, the peak sound pressure level decreases, and the corresponding frequency changes a bit. When the offset distance equals three times the cylinder diameter, the wake of the cylinder has little influence on the leading edge of the following airfoils. The noise can be reduced by about 10 dB by increasing the offset distance to three times of rod diameter. For engineering guidance, the offset distance can affect the noise generated by rod-airfoil interaction dramatically. The noise can be reduced by about 10 dB by increasing the offset distance to three times of rod diameter.
The original contributions presented in the study are included in the article/supplementary materials, further inquiries can be directed to the corresponding authors.
Conceptualization, SJ; data curation, LL, formal analysis, XG; investigation, LL and XG; methodology, SJ; project administration, WZ; software, LL; supervision, RZ; validation, LL; visualization, LL and SJ; writing, LL, SJ, XG, RZ, and CW. All authors have read and agreed to the published version of the manuscript.
The authors declare that the research was conducted in the absence of any commercial or financial relationships that could be construed as a potential conflict of interest.
All claims expressed in this article are solely those of the authors and do not necessarily represent those of their affiliated organizations, or those of the publisher, the editors and the reviewers. Any product that may be evaluated in this article, or claim that may be made by its manufacturer, is not guaranteed or endorsed by the publisher.
1. Song Wenping HZ, Lei Y. Status of investigation on airframe noise computation. Adv Aeronaut Sci Eng (2010) 1:125–31. doi:10.3969/j.issn.1674-8190.2010.02.007
2. Dobrzynski W. Almost 40 years of airframe noise research: What did we achieve. J Aircraft (2012) 47:353–67. doi:10.2514/1.44457
3. Lockard D. A comparison of ffowcs williams-hawkings solvers for airframe noise applications. In: 8th AIAA/CEAS Aeroacoustics Conference and Exhibit (2002). p. 2580.
4. Boudet J, Casalino D, Jacob M, Ferrand P. Prediction of broadband noise: Airfoil in the wake of a rod. In: 42nd AIAA Aerospace Sciences Meeting and Exhibit (2004). p. 852.
5. Xun H, Xiaoxian C, Zhaokai M, Xin Z. Efficient computation of spinning modal radiation through an engine bypass duct. AIAA J (2008) 46:1413–23. doi:10.2514/1.31136
6. de la Puente F, Sanders L, Vuillot F. On lagoon nose landing gear cfd/caa computation over unstructured mesh using a zdes approach. In: 20th AIAA/CEAS aeroacoustics conference (2014). p. 2763.
7. Yang C, Feng H, Peng Y. Noise characteristic analysis and sound sources identification for rod–airfoil interaction using different subgrid-scale models. In: E3S Web of Conferences (EDP Sciences), vol. 233 (2021). p. 04036.
8. Jiang Y, Mao ML, Deng XG, Liu HY. Numerical investigation on body-wake flow interaction over rod–airfoil configuration. J Fluid Mech (2015) 779:1–35. doi:10.1017/jfm.2015.419
9. Greschner B, Thiele F, Jacob MC, Casalino D. Prediction of sound generated by a rod–airfoil configuration using EASM DES and the generalised Lighthill/FW-H analogy. Comput Fluids (2008) 37:402–13. doi:10.1016/j.compfluid.2007.02.013
10. Zhu W, Luo K, Xiao Z, Fu S. Numerical simulations of the flow dynamics past an oscillating rod-airfoil configuration. In: Progress in Hybrid RANS-LES Modelling: Papers Contributed to the 6th Symposium on Hybrid RANS-LES Methods; 26-28 September 2016. Strasbourg, France: Springer (2018). p. 433–43.
11. Wei-Jie C, Wei-Yang Q, Liang-Feng W, Kun-Bo XU, Fan T. Investigation of rod-airfoil interaction noise using large eddy simulation and FW-H equation. J Aerospace Power (2016) 31:2146–55. doi:10.13224/j.cnki.jasp.2016.09.013
12. Peixun Y, Junqiang B, Jiangtao H, Jun Z. Aerodynamic noise of the rod-airfoil computed by using acoustic analogy. Acta Aerodynamica Sinica (2013) 31:204–8. doi:10.7638/kqdlxxb-2011.0109
13. Junqiang B, Peixun Y, Guo B. An effective numerical simulation approach to noise induced by flow around rod-airfoil using the hybrid method with solutions of DES and FW-H integration. J Northwest Polytechnical Univ (2012) 30:5. doi:10.3969/j.issn.1000-2758.2012.06.009
14. Li Z, Zhang Y, Lu Y. Numerical simulation of the flow and acoustic field of A cylinder wake-airfoil interaction. Fan Technol (2020) 3:52–7.
15. Chen L, Cheng R, Li S, Lian H, Zheng C, Bordas SP. A sample-efficient deep learning method for multivariate uncertainty qualification of acoustic–vibration interaction problems. Comput Methods Appl Mech Eng (2022) 393:114784. doi:10.1016/j.cma.2022.114784
16. Chen L, Chuang L, Haojie L, Zhaowei L, Wenchang Z, Shengze L, et al. Acoustic topology optimization of sound absorbing materials directly from subdivision surfaces with isogeometric boundary element methods. Comput Methods Appl Mech Eng (2020) 362:112806. doi:10.1016/j.cma.2019.112806
17. Chen L, Haibo C, Changjun Z, Steffen M. Structural–acoustic sensitivity analysis of radiated sound power using a finite element/discontinuous fast multipole boundary element scheme. Int J Numer Methods Fluids (2016) 82:858–78. doi:10.1002/fld.4244
18. Chen L, Lian H, Liu Z, Chen H, E A, Bordas S. Structural shape optimization of three dimensional acoustic problems with isogeometric boundary element methods. Comput Methods Appl Mech Eng (2019) 355:926–51. doi:10.1016/j.cma.2019.06.012
19. Chen L, Lian H, Liu Z, Gong Y, Zheng C, Bordas S. Bi-material topology optimization for fully coupled structural-acoustic systems with isogeometric FEM–BEM. Eng Anal Boundary Elem (2022) 135:182–95. doi:10.1016/j.enganabound.2021.11.005
20. Chen L, Lian H, Natarajan S, Zhao W, Chen X, Bordas S. Multi-frequency acoustic topology optimization of sound-absorption materials with isogeometric boundary element methods accelerated by frequency-decoupling and model order reduction techniques. Comput Methods Appl Mech Eng (2022) 395:114997. doi:10.1016/j.cma.2022.114997
21. Chen L, Lian H, Xu Y, Li S, Liu Z, Atroshchenko E, et al. Generalized isogeometric boundary element method for uncertainty analysis of time-harmonic wave propagation in infinite domains. Appl Math Model (2023) 114:360–78. doi:10.1016/j.apm.2022.09.030
22. Chen L, Liu C, Zhao W, Liu L. An isogeometric approach of two dimensional acoustic design sensitivity analysis and topology optimization analysis for absorbing material distribution. Comput Methods Appl Mech Eng (2018) 336:507–32. doi:10.1016/j.cma.2018.03.025
23. Morris PJ, Long LN, Bangalore A, Wang Q. A parallel three-dimensional computational aeroacoustics method using nonlinear disturbance equations. J Comput Phys (1997) 133:56–74. doi:10.1006/jcph.1997.5646
24. Batten P, Ribaldone E, Casella M, Chakravarthy S. Towards a generalized non-linear acoustics solver. In: 10th AIAA/CEAS aeroacoustics conference (2004). p. 3001.
25. Batten P, Goldberg U, Chakravarthy S. Reconstructed sub-grid methods for acoustics predictions at all Reynolds numbers. In: 8th AIAA/CEAS aeroacoustics conference and exhibit (2002). p. 2511.
26. Mo H, An Y, Qingquan L. Influence of the length of high-speed train on the far-field aeroacoustics characteristics. Chin J Theor Appl Mech (2019) 51:1310–20. doi:10.6052/0459-1879-19-079
27. Sun Z, Song J, An Y. Numerical simulation of aerodynamic noise of CRH3 high-speed train. J Peking Univ (Natural Sci Edition) (2012) 48:701–11. Available from: http://dspace.imech.ac.cn/handle/311007/47944.
28. Zhang Y, Duan Z, Hou Y. An application of non-linear acoustics solver in the noise prediction of refueling tube. Aeronaut Sci Technol (2015) 26:74–8. doi:10.3969/j.issn.1007-5453.2015.09.017
29. Chen B, Wang Y, Tong M. Cavity noise analysis and passive control using NLAS method. Aeronaut Comput Tech (2015) 45:54–7. doi:10.3969/j.issn.1671-654X.2015.05.014
30. Ren S, Zhang S, Yan G. A prediction of fluctuation pressure conditions with transonic rocket by RANS/NLAS method. J Solid Rocket Technol (2011) 34:418–22. doi:10.1016/B978-0-444-53599-3.10005-8
31. Farassat F. Discontinuities in aerodynamics and aeroacoustics: The concept and applications of generalized derivatives. J Sound Vibration (1977) 55:165–93. doi:10.1016/0022-460x(77)90593-4
32. Casper J, Farassat F. A new time domain formulation for broadband noise predictions. Int J Aeroacoustics (2002) 1:207–40. doi:10.1260/147547202320962574
33. Agrawal B, Sharma A. Aerodynamic noise prediction for a rod-airfoil configuration using large eddy simulations. In: 20th AIAA/CEAS Aeroacoustics Conference (2014). doi:10.2514/6.2014-3295
34. Kato C, Iida A, Takano Y, Fujita H, Ikegawa M. Numerical prediction of aerodynamic noise radiated from low mach number turbulent wake. In: 31st aerospace sciences meeting (1993). p. 145.
Keywords: aerodynamic noise, RANS/NLAS method, rod-airfoil vortex-structure interaction, wake-airfoil interaction, aeroacoustics
Citation: Jiang S, Li L, Guo X, Zhao W, Zhang R and Wang C (2023) Effect of offset distances for rod-airfoil interaction noise. Front. Phys. 11:1136539. doi: 10.3389/fphy.2023.1136539
Received: 03 January 2023; Accepted: 27 January 2023;
Published: 16 February 2023.
Edited by:
Leilei Chen, Huanghuai University, ChinaReviewed by:
Chen Xu, Wuhan University of Technology, ChinaCopyright © 2023 Jiang, Li, Guo, Zhao, Zhang and Wang. This is an open-access article distributed under the terms of the Creative Commons Attribution License (CC BY). The use, distribution or reproduction in other forums is permitted, provided the original author(s) and the copyright owner(s) are credited and that the original publication in this journal is cited, in accordance with accepted academic practice. No use, distribution or reproduction is permitted which does not comply with these terms.
*Correspondence: Shujie Jiang, amlhbmdzaHVqaWVAY2FyZGMuY24=; Weiming Zhao, Y2FyZGNfd216aGFvQDE2My5jb20=; Chao Wang, d2FuZ2NoYW8zQGNhcmRjLmNu
Disclaimer: All claims expressed in this article are solely those of the authors and do not necessarily represent those of their affiliated organizations, or those of the publisher, the editors and the reviewers. Any product that may be evaluated in this article or claim that may be made by its manufacturer is not guaranteed or endorsed by the publisher.
Research integrity at Frontiers
Learn more about the work of our research integrity team to safeguard the quality of each article we publish.