 Hongyan Guo
 Yu Yan3
 Xinrong Liu
- 1School of Civil Engineering, Chongqing University, Chongqing, China
- 2China Merchants Chongqing Communications Technology Research and Design Institute Co, Ltd., Chongqing, China
- 3HZMB Administrative Authority, Zhuhai, Guangdong, China
The reliability of the immersed tunnel element joint is the key to determine whether the immersed tunnel can operate safely. At present, the immersed tunnel monitoring mostly pays attention to the joint opening and closing amount and neglects the differential deformation of the joint. Based on the immersed tunnel of Hong Kong-Zhuhai-Macao Bridge, combined with the operating environment and structural characteristics of the immersed tunnel, this paper introduces a close-range photogrammetry method to monitor the differential deformation of the immersed tunnel element joint. Through theoretical analysis, software and hardware development, laboratory test and field test, the paper puts forward puts forward a comprehensive multi-parameter evaluation and screening algorithm of boundary fitting ellipse based on fitting rate, ellipticity and area difference and a micro-displacement correction algorithm for camera based on three-dimensional calibration object, and develops an automatic monitoring system equipment for differential deformation of immersed tunnel element joint. Upon tests in tunnels, the monitoring equipment is proven in automatic monitoring on differential deformation of immersed tunnel element joints. This equipment has been successfully applied to the E31∼E32 element joint of Hong Kong-Zhuhai-Macao Bridge immersed tunnel, which verifies the effectiveness of the equipment from the perspective of practical engineering application.
1 Introduction
With the continuous development in social and economic level and the continuous improvement of people’s requirements for quality of life, the overall scale of China’s transportation engineering construction shows a growing trend. Tunnel, serving as engineering works of underpass, has demonstrated some incomparable advantages over other projects. As a form of underwater tunnel, immersed tunnel is increasingly favored by the engineering circle and becomes the choice of more and more cross-river and cross-sea channels. The successful construction of Subsea Immersed Tunnel of Hong Kong-Zhuhai-Macao Bridge is a herald of the maturing of the construction technology of the immersed tunnels. However, massive construction will undoubtedly bring challenges to long-term operation safety supervision, which makes the high-accuracy and non-contact automated monitoring technology research and equipment development increasingly attract people’s attention.
Research results at home and abroad show that the reliability of immersed tunnel element joints is the key factor that determines the safe operation of immersed tunnels. According to the analysis on the investigation of immersed tunnels in service and literature data, the main diseases of immersed tunnels can be divided into three categories: main structural diseases, joint diseases and auxiliary structural diseases. In terms of the causes of disease, the differential deformation of element joints (see Figure 1) is the main cause of the element structural cracks and joint water damage [1], so element joints will be the focus of the operation safety monitoring of immersed tunnels.
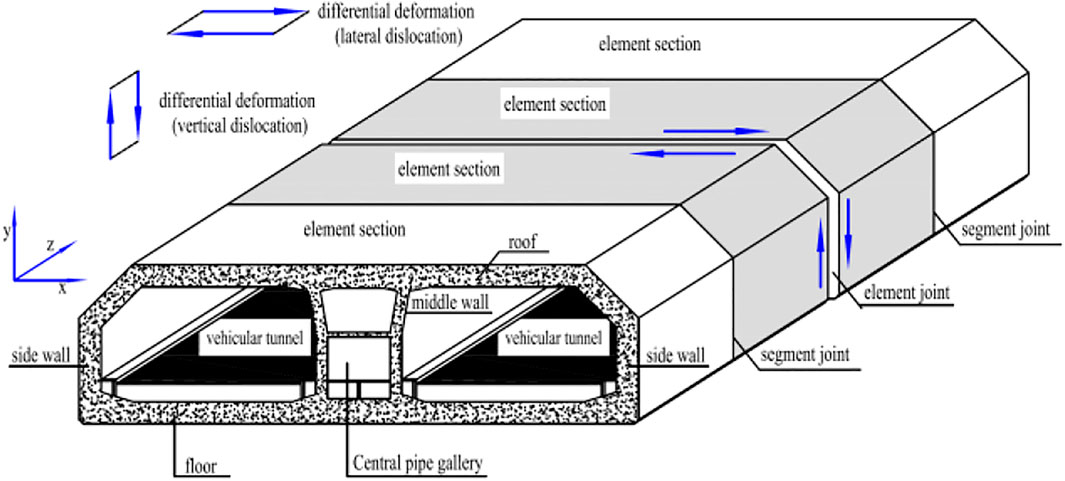
FIGURE 1. Schematic diagram of the differential deformation mode between the immersed tunnel model and the element joints.
Relatively mature monitoring methods currently for structural deformation of operating tunnels mainly include manual level monitoring, automatic static level monitoring, automatic vibrating string or optical fiber displacement meter monitoring, and automatic total station monitoring. Thanks to the progress of monitoring technology, new technologies represented by 3D laser scanning, ultrasonic sensing technology and distributed optical fiber have gradually emerged, which is a great impetus to the technical progress of tunnel structural deformation monitoring. For example: Yang Hao and Xu Xiangyang [2], et al. proposed a deformation monitoring algorithm based on laser technology, which can effectively improve the reliability of structural health monitoring; Du Liming [3] et al. developed a 3D laser scanning-based mobile tunnel monitoring system on the basis of in-depth study of tunnel monitoring methods, with a cross-section measurement accuracy of 1.1 mm; Xu Dongsheng et al. [4] developed an automatic and wireless tunnel deformation monitoring system based on ultrasonic sensing technology; Hou Gongyu [5] et al. proposed a tunnel section deformation sensing method based on distributed optical fiber sensing and neural network. In term of deformation monitoring of immersed tunnels, the immersed tunnel in Yongjiang, Ningbo, Zhejiang Province measure the overall settlement of the tunnel with levels, and then calculates the differential settlement between elements through the settlement between adjacent measuring points [6, 7]. Yuan Zheng [8] and others introduced the trilateration network method into the joint deformation monitoring of Ningbo Changhong Immersed Tunnel, realizing the monitoring of joint relative displacement. The automatic total station method was adopted by Hong Kong’s first cross-sea immersed highway tunnel [9], realizing the automatic monitoring of tunnel structural displacement. In the immersed tunnel of Hong Kong-Zhuhai-Macao Bridge, a structural health monitoring system was arranged at the beginning of the construction, which realizes the automatic monitoring of the opening and closing amount of 32 element joints through fiber grating displacement meters, while the uneven settlement of the joints is still made by manual monitoring with level. In summary, the current displacement monitoring methods for tunnel structures can be roughly divided into two categories, one is the point contact measurement represented by static level and displacement meter, and the other is the optical non-contact measurement represented by automatic total station (measuring robot). The former has high measurement accuracy, but one sensor can only achieve the measurement of one displacement index of one measuring point, and the monitoring accuracy is greatly affected by the equipment installation quality. The latter can achieve simultaneous measurement of multiple measuring points and multiple displacement indexes, but the measuring point accuracy is generally at millimeter level, which cannot meet the requirements for the observation of the small deformation of tunnel structure. In addition, measuring robots have problems such as high installation costs and easy off-target in long-term operation.
With the development of science and technology and the breakthrough of optical measurement technology, measurement and detection technology based on machine vision [10–12] has been widely valued by the industry, thus providing a new idea for non-contact, high-accuracy automatic monitoring of engineering structure displacement [13]. In civil engineering, relevant technical research and equipment development have emerged in the fields of structural experiment [14, 15], building structure [16, 17], bridge structure [18–20], hydraulic structure [21, 22], foundation pit [23, 24], slope engineering [25, 26] monitoring, etc. The research field mainly covers system design, equipment selection, image processing algorithm, engineering environment impact, and equipment R&D and application [27, 28]. In the field of tunnel and underground engineering, Cheng Zheng et al. [29] also proposed a new method in 2012 for long-span underground space structure monitoring based on digital image processing measurement technology, but neither corresponding monitoring equipment has been developed, nor engineering application has been formed, and few relevant studies have been reported since. So far, no mature visual measurement equipment suitable for the deformation monitoring of tunnels and underground engineering structures has been developed.
In conclusion, the displacement monitoring of tunnel and underground engineering structure is different from that of above-ground structures, and the existing monitoring technology and equipment are faced with many problems, such as complex installation, low monitoring accuracy and high application cost, which are difficult to meet the needs for tunnel deformation monitoring. The research and development of monitoring equipment based on machine vision and deep learning can better solve the above contradictions [30], but it needs to solve the problems such as the difficulty in extracting structural feature displacement under tunnel environmental conditions and the long-term stability of monitoring cameras. There is an urgent need for the development of new monitoring equipment to meet the monitoring needs of immersed tunnels, so as to provide data support for the safety assessment of tunnel structures. Therefore, taking the immersed tunnel of Hong Kong-Zhuhai-Macao Bridge as the background and combined with the operating environment and structural characteristics of the immersed tunnel, this paper introduces an automatic monitoring equipment for the differential deformation of immersed tunnel joints developed based on the basic principles of photogrammetry and image recognition, which realizes non-contact high-accuracy, high-frequency and all-around monitoring of multi-measuring points and multi-degree of freedom deformation immersed tunnel element joints, and successfully improves the measurement accuracy of traditional engineering structure displacement measurement based on optical principle to submillimeter level, further reducing the monitoring cost. The equipment has been successfully put into service in actual projects, supplementing the basic data for the intelligent simulation analysis of the immersed tunnel of Hong Kong-Zhuhai-Macao Bridge.
2 Measurement principle and system design
2.1 Measurement principle
For the purposes of obtaining the tunnel structure displacement, it is planned to use two “back to back” industrial cameras to obtain the 2D images of the reference point and the point to be measured respectively, see Figure 2. When the monitoring camera and the reference point are located in the stable area of the tunnel, according to the image-forming principle of cameras, if it is assumed that each image can be regarded as an array with the size of m × n, then each element of m rows and n columns corresponds to each pixel, and an O1-mn pixel coordinate system with the upper left corner of the image as the origin of coordinates can be defined on the image, see Figure 3. To represent the pixel points in the pixel coordinate system by the method of physical quantities, it is necessary to establish an image coordinate system O-uv with the center point of the image as the origin of coordinates, see Figure 3. Through the conversion relationship between the pixel coordinate system and the image coordinate system, see Formula 1, the pixel coordinates of the point to be measured and the reference point in the image can be converted into image coordinates. In view of the fact that the images of the front and rear cameras are not in the same field of view, a reference coordinate system O2-xy (see Figure 3) needs to be established to convert the images of the reference point and the image of the monitoring point to be monitored to a unified reference coordinate system, and then calculate the displacement change of the point to be monitored relative to the reference point (δx, δy). However, in an actual engineering environment, the change of camera installation attitudes caused by factors such as thermal expansion and contraction and structural fatigue cannot be guaranteed, but as long as the change of camera attitudes is very small, and the target to be monitored and the reference target are still located in the field of view of the cameras, the image change caused by the change of the camera attitudes will only lead to overall image displacement, and will not affect the displacement change of the point to be measured relative to the reference point, as shown in Figure 3.
Where, (
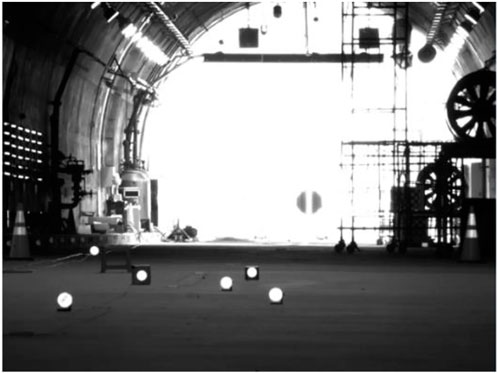
FIGURE 2. Imaging effect of circular reflective mark.
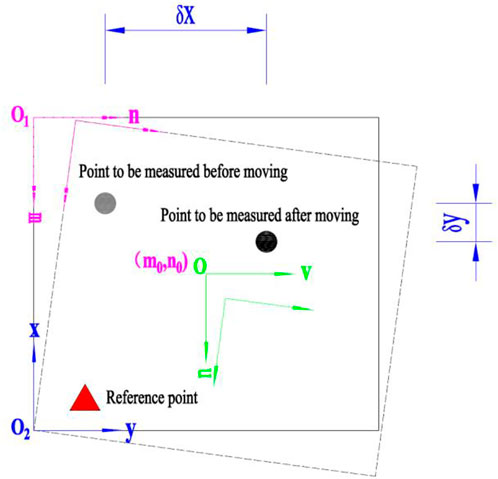
FIGURE 3. Comparison of imaging effects before and after slight changes in camera pose.
2.2 System design
The whole monitoring system is designed to be composed of three parts: the artificial cooperation reflective sign fixed in the displacement area of the tunnel to be monitored, the back to back image measuring station and the reference manual cooperative standard frame fixed in the stable area of the tunnel, as shown in Figure 4. The reference manual cooperative standard frame also provides reference coordinate system and camera attitude correction. The core equipment of the system is the back to back image measuring station, which is composed of multiple high-resolution digital cameras and camera synchronization controllers connected together. One of the cameras is equipped with a short-focus lens for imaging of the reference artificial cooperation sign frame located in the stable area of the tunnel, while the rest of the cameras are equipped with a long-focus lens for imaging of the reflective cooperation sign arranged in the deformation monitoring area of the tunnel structure in the distance. The layout of the components of the image measuring station is shown in Figure 5.
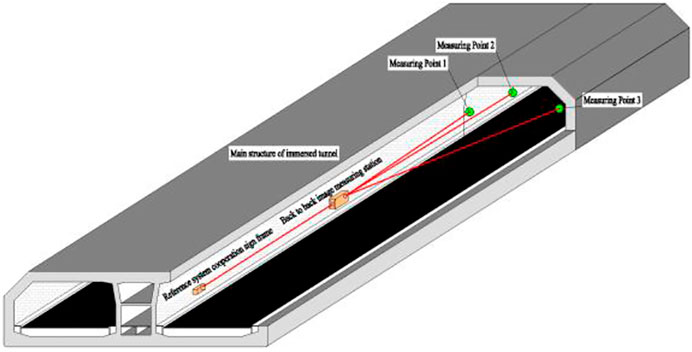
FIGURE 4. Layout and installation diagram of monitoring system.
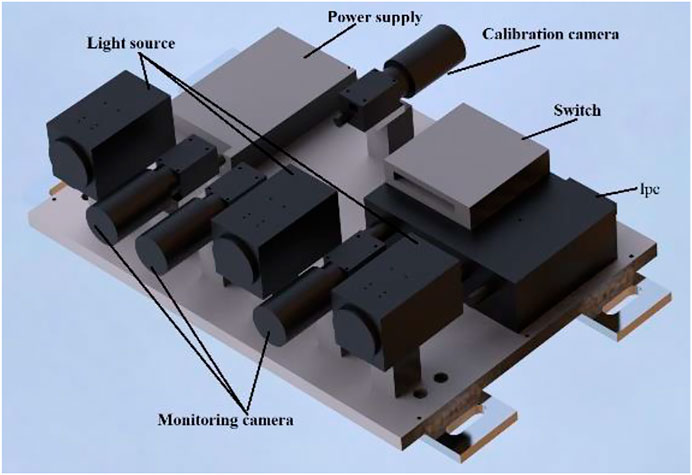
FIGURE 5. Design scheme of back to back measuring station.
3 Structural displacement real-time monitoring technology
3.1 Sub-pixel threshold segmentation and contour extraction of monitoring point images
Since the image of the reflective sticker obtained is large and there is external environmental interference [31], in order to accurately extract the coordinates of the center of the reflective sticker, it is necessary to make ROI selection for the image, see Figure 6, and then conduct sub-pixel threshold segmentation and edge detection for each ROI region. In sub-pixel threshold segmentation, the first step is to perform bilinear interpolation algorithm processing for the gray value edge between two adjacent pixels on the image of the ROI region in the horizontal dimension and vertical dimensions (see Figure 7) to transformed the image of the ROI region at pixel-level accuracy to sub-pixel level accuracy [32]. After bilinear interpolation, the gray value at
Where, i, j represent the coordinate position of the image pixel (the value is a non-negative integer); x. y is the weight carried by the pixel value at the vertex during interpolation (this is a floating point number in the range of [0,1]);
Where,
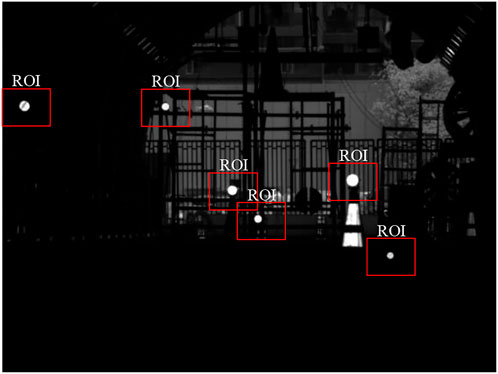
FIGURE 6. ROI selection of reflective sticker images.
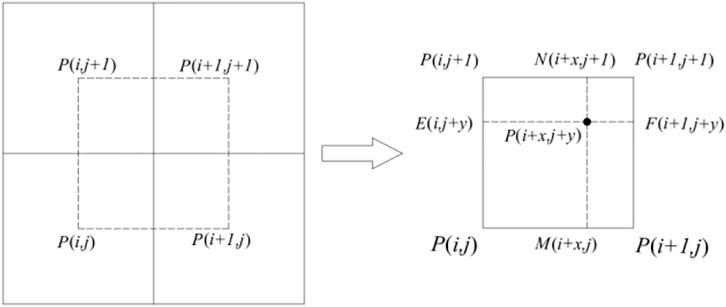
FIGURE 7. Subdivision process of pixel-level units by bilinear interpolation.
3.2 Extraction of center coordinates of monitoring points based on ellipse fitting
Least square fitting [33] is the most common fitting method in ellipse fitting. However, the fitting degree between the ellipse and the original boundary is not taken into account when this method is used for ellipse fitting, and the resulting ellipse is larger than the actual one. The results of this method are often not satisfactory, which makes it necessary to evaluate and screen the fitted ellipse. In this paper, a boundary fitting ellipse multi-parameter comprehensive evaluation and screening algorithm based on fitting rate, ellipticity and area difference is proposed. Assuming that the equation of the fitted ellipse (see Figure 8) is as shown in Formula 4, P (m, n) is an arbitrary boundary point used for the fitting, and Q (x, y) is the intersection point of the normal line passing through Point P and the fitted ellipse, the coordinates of Point Q can be calculated from Equation Set (5). Traverse each boundary point and calculate the vertical distance d between the boundary points and the fitted ellipse according to Formula 6, denote the points whose vertical distance d is less than a certain threshold
Where, A—F are the fitting coefficients of the ellipse fitting equation; a is the major axis of the fitted ellipse; b is the minor axis of the fitted ellipse;
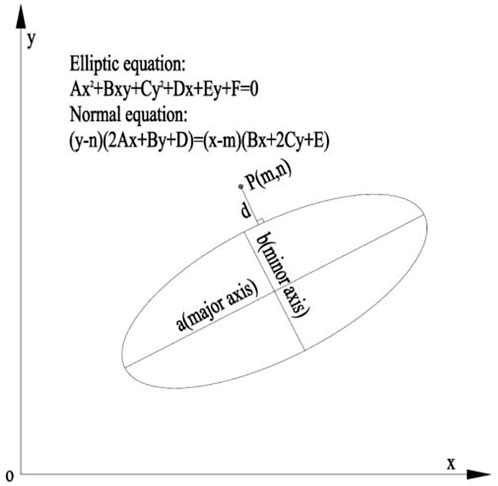
FIGURE 8. Fitting the ellipse boundary.
The detailed realization process of boundary fitting ellipse multi-parameter comprehensive evaluation and screening algorithm based on fitting rate, ellipticity and area difference is as follows.
The boundary fitting ellipse multi-parameter comprehensive evaluation and screening algorithm based on fitting rate, ellipticity and area difference involves segmentation of image boundary, extraction of image boundary points, calculation of fitting rate and ellipticity, and selection of optimal ellipse, etc. The detailed realization process is as follows, See Figure 9.
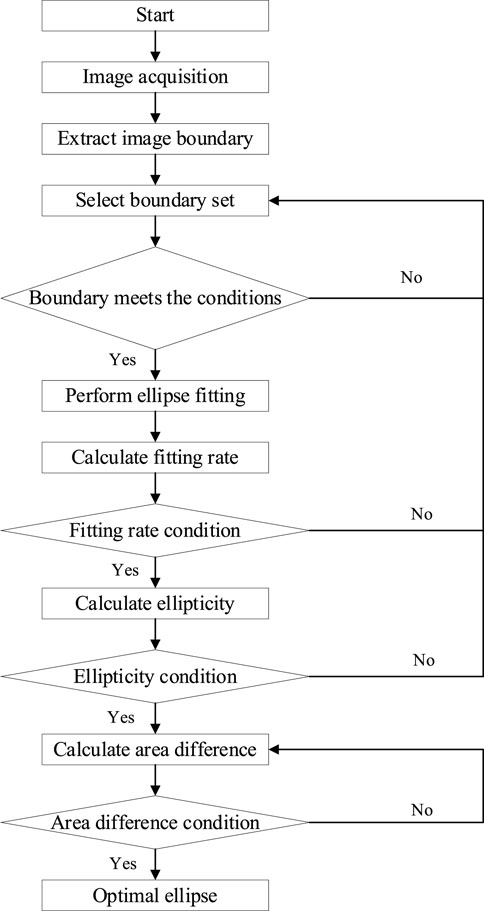
FIGURE 9. Algorithm flow chart.
After sub-pixel threshold segmentation and contour extraction, the center coordinates of one of the ROI regions are obtained according to the above ellipse fitting and screening algorithm. The processing effect is shown in Figure 10. As can be seen from the figure that after the ROI region is selected, we can detect the contour of the reflective sticker very well by setting the threshold, and then obtain a fitted ellipse. In the figure above, the coordinates of the center of the ellipse are (251.834991 and 219.546951), which are coordinates at the sub-pixel accuracy level.
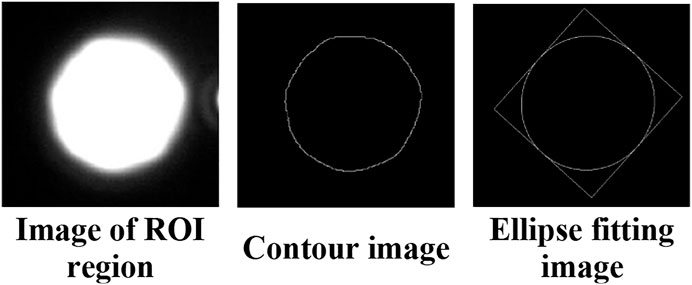
FIGURE 10. ROI area ellipse detection.
3.3 Algorithm for transformation of monitoring point displacement in reference coordinate system
Those obtained by the above algorithm are the pixel coordinates of the points to be measured, while the structural displacement monitoring needs to obtain the displacement changes of the points to be measured relative to the reference point, so it is necessary to solve the conversion relationship between pixel coordinate system and reference coordinate system. In this case, it is necessary to complete the measurement with the aid of a total station. First, place reflective stickers at the monitoring parts of the tunnel, and use a total station to obtain the three-dimensional coordinate points Pi (i = 1, 2, 3,…,) of the center of each reflective sticker. Similarly, use a laser LED light to illuminate the reflective stickers. Then, collect the image of the reflective stickers, extract the ROI region in the image, obtain the reflective sticker area image (as shown in Figure 11), perform ellipse fitting for each ROI, and obtain the center coordinates (u, v). In the meantime, conduct distortion correction according to the distortion correction model shown in Formula 10, and use the corrected pixel coordinates as the initial coordinate values of the monitoring points.
Where, dx and dy are distortion values, p1 and p2 are tangential distortion coefficients, and k1 and k2 are radial distortion coefficients;

FIGURE 11. Extraction of ROI area of monitoring points.
Calculate the rotation R and translation t from the reference coordinate system set by the total station to the monitoring camera coordinate system through PnP algorithm [34] based on the corresponding relationship between the 2D coordinate point of the center of the circle and the 3D coordinate point obtained by the total station, and on this basis, transform the 3D coordinate point Pi obtained by the total station to the monitoring camera coordinate system. The position relationship between the reference coordinate systems of the monitoring camera and the total station is shown in Formula 11:
Assuming that the position attitude relationship between the two cameras obtained through external parameter calibration is TAB, and the initial position of the calibration camera relative to the reference marker (A marker considered to be fixed and immovable) is H, then the three-dimensional coordinates Pwi of the monitoring point Pci in the marker coordinate system can be calculated according to Formula 12:
3.4 Correction of measurement deviation caused by small camera displacement
When there is human interference or when the tunnel where the camera is installed deviates, the initial position of the measuring point viewed by the monitoring camera will change [35]. In this case, the initial position of the monitoring point needs to be corrected with the calibrated camera parameters. Assuming that the coordinates of the monitoring point in the reference marker coordinate system are Pwi, and the positional relationship of the calibration camera relative to the reference marker is Hnew, when the position information of the calibration camera changes, the position coordinates of the monitoring point Pi after correction can be calculated according to Formula 13:
4 Hardware selection and structure design
In order to meet the structural displacement measurement function in tunnel light environment, the measuring station mainly consists of industrial camera, lens, light source, IPC, switch and power supply. The industrial camera and supporting lens are mainly for image acquisition of the points to be measured, the light source can provide a stable light environment for image acquisition, the switch is designed for image data transmission, and the built-in image analysis algorithm of the IPC is used to extract the monitoring results and output them externally. In terms of camera selection, since the tunnel structure displacement monitoring target is basically in a static state, the requirements for camera acquisition speed are not high, but considering that the device works outdoors, the power consumption of the device should be low. In addition, considering the popularization of the equipment, it is appropriate to select an industrial camera with CMOS chip as the image acquisition equipment. Based on the requirements of monitoring accuracy and environmental applicability, the selected industrial camera has a resolution of 2,592*2048, a photosensitive element size of 12.4 mm*9.8 mm, and a pixel size of 4.8*4.8 μm. In the aspects of light source selection, we can compare the test results of laser and LED light sources, see Figure 12. Laser fill-in light produces speckles that change with time, and such circular speckles greatly affect the accuracy of the later identification point extraction algorithm, thus affecting the detection accuracy of the algorithm. The infrared fill-in light of LED produces uniform and stable light without speckle, which is suitable for image processing algorithms. However, the power of infrared fill-in lights is weaker than that of laser lights, so multiple infrared fill-in lights are required for filling the light at the same time. When it comes to lens selection, the test results of the maximum clear imaging range of lenses with different focal lengths at different shooting distances are shown in Table 1. As can be seen from the table, the larger the focal length of the lens, the closer the shooting distance, the smaller the field of view, and when the camera pixel is fixed, the higher the accuracy of the measurement results will be. Considering accuracy, cost and actual field of view demand, 100 mm lens is selected as the final selection, when the theoretical measurement accuracy of the tested camera can reach 0.1 mm, the field of view can cover the monitoring target points in the area to be measured. The structural design and assembly of the back to back measuring station are shown in Figures 13, 14.

FIGURE 12. Comparison of imaging effects of different light sources.
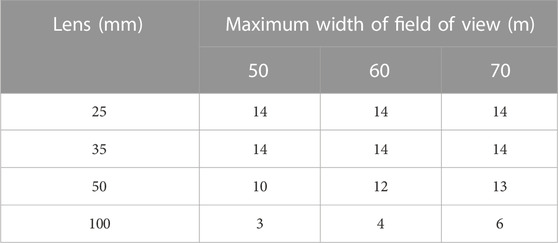
TABLE 1. Test results of the best field of view width for different lenses.
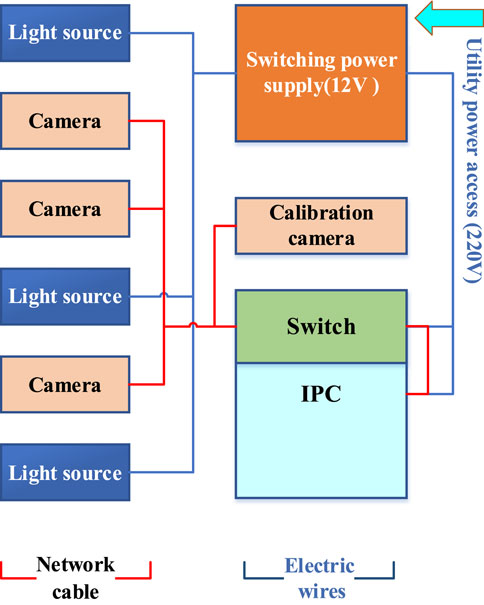
FIGURE 13. Hardware structure diagram.
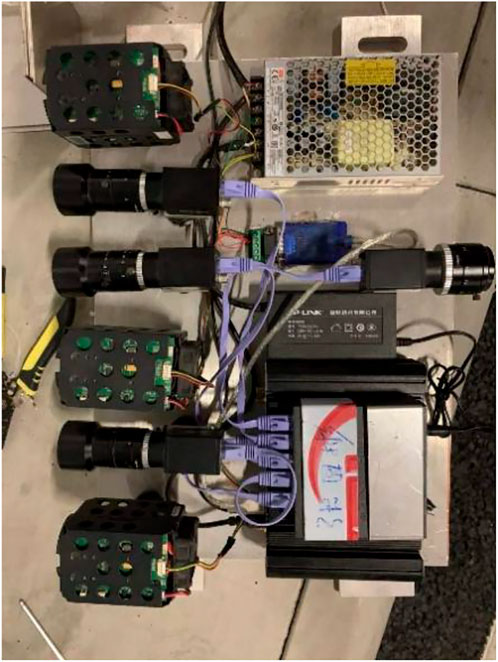
FIGURE 14. Hardware structure assembly.
5 Test and analysis of equipment measurement accuracy
In order to ensure the engineering applicability of the developed automatic monitoring equipment for differential deformation of immersed tunnel joints, the accuracy and stability tests were carried out on the basis of the 200 m long 1:1 experimental tunnel of the National Engineering Research Center for Highway Tunnels.
5.1 Test method
Three measuring points were arranged on the left, middle and right) at every 10 m interval within the range of 10–70 m from the camera, the optical mobile platforms with an accuracy of 0.01 mm were placed on the points to be measured in sequence, see Figure 15, and the camera field of view was set to 5 m. After adjusting the brightness and position of the LED, the LED light was turned on, and a filter was placed on the camera. The reflective stickers on each point to be measured were moved transversely and horizontally by 0.2, 0.3, 0.4, and 0.5 mm to simulate the small deformation of the tunnel structure. In the meantime, the camera parameters were adjusted to capture clear images, and the image processing algorithm was used to extract the center displacement of the reflective sticker images and test the measurement accuracy of the equipment at different measuring points. To ensure the accuracy of the tests, three measurements were made for each measuring point position to get an average value.
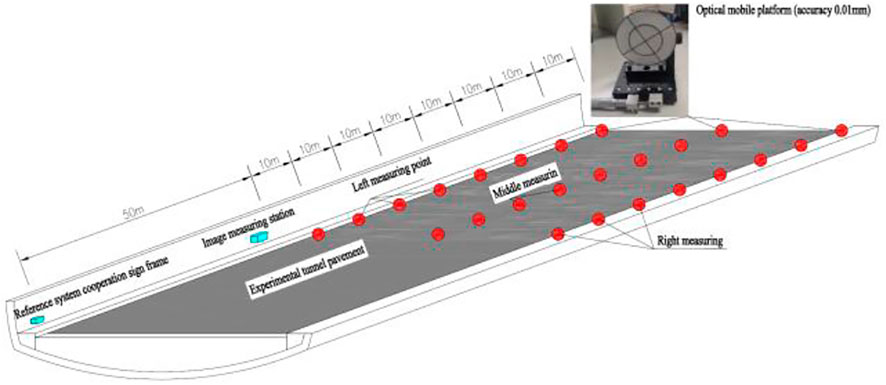
FIGURE 15. Schematic diagram of solid tunnel test.
5.2 Analysis of test results
The extracted measurement error statistics under different working conditions are shown in Figure 16. As can be seen from Figure 16, when the distance between the camera and the target point was 70 m, and when the structural displacement was between 0.2 and 0.5 mm, the test error of the equipment measurement results was large, and the test data was abnormal. Therefore, the effective monitoring range of the monitoring equipment is 60 m in the longitudinal direction. A camera with a fixed focal length had a coverage of 20 m (longitudinal) * 5 m (transverse), and a minimum recognizable displacement of 0.2 mm. The measurement error gradually increased with the distance from the target point. In the same cross section, the measurement errors of different measuring points were fairly close, that is, the left or right deflection of the cameras had little impact on the measurement errors. Therefore, in practical projects, full coverage of the entire cross section can be achieved by installing monitoring equipment on the side walls of tunnels. Within the above effective measurement range, the measuring equipment had an average measurement error of 0.1 mm and a maximum measurement error of 0.19 mm. To sum up, within the effective measurement range, the equipment can identify deformations of 0.2 mm, with an average measurement error of ±0.1 mm, so it can meet the monitoring accuracy requirements of operating tunnel structures.
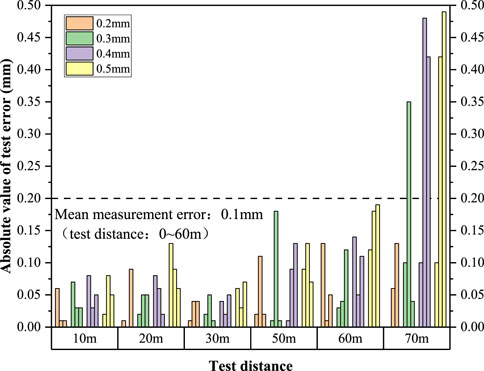
FIGURE 16. Statistical histogram of absolute value of test error.
6 Engineering application verification
6.1 Selection of monitoring parts and installation of instruments and equipment
Differential settlement of elements and disharmonic deformation between elements in immersed tunnels are the main reasons for various diseases such as concrete structure cracks and joint leakage. Currently, the immersed tunnel of Hong Kong-Zhuhai-Macao Bridge has relatively comprehensive monitoring contents and indicators, but the monitoring frequency, monitoring methods and measuring point layout of some key indexes cannot meet the requirements for intelligent simulation analysis of the immersed tunnel. According to the current joint opening and closing amount and foundation settlement monitoring data, E31∼E32 element joints have the largest structural displacement, and the safety risk is high. In order to meet the needs for joint safety assessment, E31∼E32 element joints (Zhuhai-Macao direction) were selected to install element joint differential deformation monitoring system equipment to supplement the monitoring of the lateral and vertical differential deformation of joints. The set sampling frequency was 1 min/time. A set of reflective signs were arranged on the middle wall (Measuring Point 1), roof (Measuring Point 2) and side wall (Measuring Point 3) of the joints. The back to back measuring station was installed on the element structure above the side wall decorative plate 30 m away from the joint. The reference point was located on a stable structure 50 m away from the measuring station, and the installation height was basically consistent with the measuring station. The layout of measuring points and equipment installation are shown in Figure 4.
6.2 Monitoring results and application effect analysis
After 7 months (210 days) of testing, the long-term stability and reliability of the monitoring equipment were verified. Analysis was made on the differential deformation monitoring results of the monitored joints, and time-domain analysis (see Figures 17, 18) and boxline diagram analysis (see Figures 19, 20) were performed on the raw data extracted from the field monitoring of the last 45 days (16 April 2022–31 May 2022).
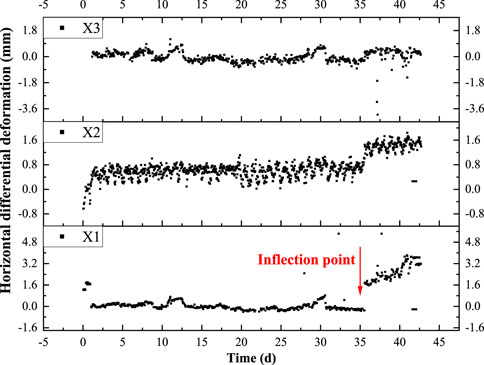
FIGURE 17. Scatter diagram of time domain analysis on monitoring results of horizontal differential deformation of joints at different measuring points.
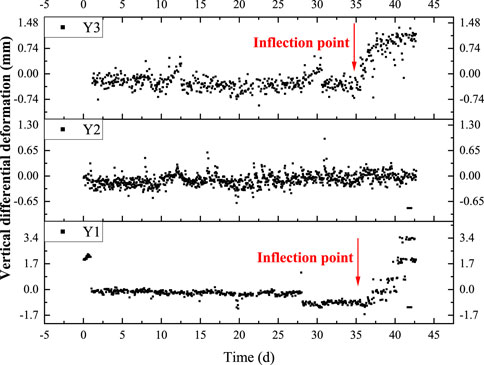
FIGURE 18. Scatter diagram of time domain analysis of monitoring results of vertical differential deformation of joints at different measuring points.
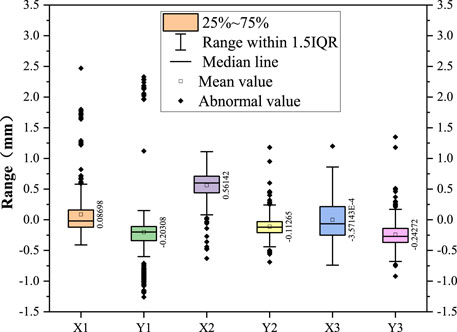
FIGURE 19. Analysis of box line analysis of joint difference deformation monitoring at different measuring points from 16 April 2022 to 20 May 2022.
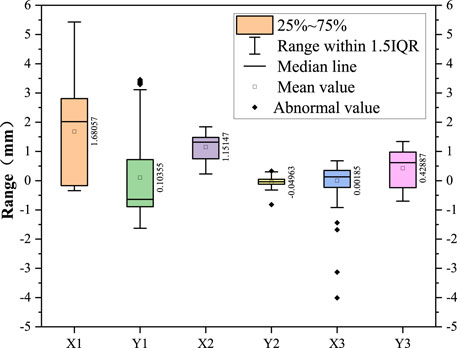
FIGURE 20. Analysis of box line analysis of joint difference deformation monitoring at different measuring points from 20 May 2022 to 31 May 2022.
Horizontal differential deformation: As can be seen from Figure 17, the horizontal differential deformation of E31∼E32 element joints can be divided into two stages. The first stage is before 20 May 2022, when it was at a relatively stable level, and the horizontal differential deformation at the measuring point of the roof showed a slight positive increasing trend. Through the combination with Figure 19, it can be seen that after removing the outliers, the mean values of the three measuring points basically coincided with the modes, the average value of the horizontal differential deformation (X1) at the measuring point of the middle wall was 0 mm, and the distribution of the monitoring data was mainly between −0.2 and 0.2 mm; the mean value of the horizontal differential deformation (X2) at the measuring point of the roof was 0.5 mm, and the distribution of the monitoring data was mainly between 0.4 and 0.6 mm; and the mean value of the horizontal differential deformation (X3) at the measuring point of the side wall was 0 mm, and the distribution of the monitoring data was mainly between −0.3 and 0.3 mm. At this stage, except for the 0.5 mm horizontal differential deformation accumulated at the measuring points of the roof, the horizontal deformation of the middle wall and the side wall was relatively small and stable. The fluctuation of the monitoring data was caused by the measurement error of instruments and equipment or periodic vibration noise. The second stage is from May 20 to 31 May 2022. During this period, except for the measuring point of the side wall still maintaining the original stable deformation level, the horizontal difference deformation at the measuring points of both the middle wall and the roof suddenly accelerated. The horizontal differential deformation at the measuring point of the roof experienced a sudden change, with an increase of about 1mm, and then entered the stable deformation stage again, with the deformation trend basically consistent with the previous stage, showing a slight increase trend. However, the horizontal differential deformation at the measuring point of the middle wall showed a continuous increase trend, with a deformation rate of about 0.3 mm/day. According to the comparative analysis of Figures 19, 20, the horizontal differential deformation at the measuring points of the middle wall and the roof in the two stages had a significant shift in the distribution position of boxline diagram, showing a significant positive increase, with the measuring point of the middle wall increasing by 3 mm and the measuring point of the roof increasing by 1 mm.
Vertical differential deformation: As can be seen from Figure 18, the vertical differential deformation of E31∼E32 element joints can also be divided into two stages. The first stage is before 20 May 2022, when it was at a relatively stable level, and the vertical differential deformation at the measuring point of the middle wall showed a slight negative increasing trend, and the vertical differential deformation at the measuring point of the roof had a slight positive increasing trend. Through the combination with Figure 20, it can be seen that after removing the outliers, the mean values of the three measuring points basically coincided with the modes, the average value of the vertical differential deformation (Y1) at the measuring point of the middle wall was −0.3 mm, and the distribution of the monitoring data was mainly between −0.5 mm and −0.1 mm; the mean value of the vertical differential deformation (Y2) at the measuring point of the roof was 0 mm, and the distribution of the monitoring data was mainly between −0.1 and 0.1 mm; and the mean value of the vertical differential deformation (Y3) at the measuring point of the side wall was −0.2 mm, and the distribution of the monitoring data was mainly between −0.3 and 0.1 mm. The vertical deformation of each measuring point in this stage was relatively small and stable. The fluctuation of the monitoring data was caused by the measurement error of instruments and equipment or periodic vibration noise. The second stage is from May 20 to 31 May 2022. During this period, except for the measuring point of the roof still maintaining the original stable deformation level, the vertical difference deformation at the measuring points of both the middle wall and the side wall suddenly accelerated. The vertical differential deformation at the measuring point of the side wall formed a parabolic growth, and the growth rate gradually decreased, with an increase of about 1 mm. However, the vertical differential deformation at the measuring point of the middle wall showed a trend of exponential increase, the growth rate gradually increased, with a deformation rate of about 0.25 mm/day. According to the comparative analysis of Figures 19, 20, the vertical differential deformation at the measuring points of the middle wall and the side wall in the two stages had a significant shift in the distribution position of boxline diagram, showing a significant positive increase, with the measuring point of the middle wall increasing by 2.5 mm and the measuring point of the roof increasing by 1 mm.
In order to further demonstrate the reliability of joint monitoring results, other monitoring indexes of element joints were extracted for comparative analysis. For the moment, two fiber grating displacement meters are installed at E31∼E32 element joints (Zhuhai-Macao direction) to monitor the opening and closing amount of the joints, which are respectively located at the measuring point of the middle wall of the central pipe gallery and the measuring point of the roof of the vehicular tunnel. See Figure 21 for the variation law of the opening and closing amount of the joints at the two measuring points on E31∼E32 element joints (Zhuhai-Macao direction) with time from 1 May 2022 to 30 May 2022. It can be seen from Figure 21 that from 20 May 2022, the opening and closing amount of the element joints also shows a certain increasing trend, which further demonstrates the reliability of the above monitoring results.

FIGURE 21. Change rule of element joint opening and closing amount at different measuring points.
Based on the analysis of the monitoring results of the two monitoring indicators of the above two monitoring equipment, since 20 May 2022, the differential deformation of the joints and the opening and closing amount of the joints of E31∼E32 element joints increased suddenly, and showed a trend of continuous increase, lasting for a long time. The preliminary judgment is that there may be abnormal changes in the environmental conditions of the element joint (differential settlement of the foundation or change in the thickness distribution of the overburden), which in turn caused lateral differential deformation and longitudinal opening and closing of the element joint. Considering that the differential deformation of the three parts measured was inconsistent, it is analyzed that there may be a certain amount of torsional deformation in the element joints. However, the GINA waterstop designed at present is controlled based on the amount of compression. Excessive shear deformation may have a greater impact on the watertightness of the joint, so there is a big potential safety hazard. Therefore, it is necessary to strengthen the monitoring of the element joint. When necessary, special detection of the foundation and the overburden and special assessment of joint safety can be carried out. In case of long-term irreversible shear deformation or sudden change of deformation value, intervention should be carried out in advance to ensure operation safety.
7 Conclusion
For the purposes of achieving the automatic monitoring of differential deformation of immersed tunnel joints, photogrammetry and image recognition technology are introduced in this paper. Based on the joint characteristics of immersed tunnels, a set of automatic monitoring equipment for differential deformation of immersed tunnel joints has been developed after a lot of efforts from technical principles to image recognition algorithms, from hardware structure design to system software development, which has solved practical engineering problems and achieved good application results.
(1) A boundary fitting ellipse multi-parameter comprehensive evaluation and screening algorithm based on fitting rate, ellipticity and area difference is proposed, and the optimal fitted ellipse boundary and monitoring point center coordinates of the image of ROI region are extracted, as improves the measurement accuracy of monitoring equipment.
(2) A camera small displacement correction algorithm based on stereo calibration object is proposed, which eliminates the measurement error caused by the change in camera attitude during the long-term operation of the monitoring equipment and solves the problem in long-term stability of the monitoring equipment.
(3) According to the test results in an actual tunnel, the effective monitoring range of the monitoring equipment is 60 m in the longitudinal direction, the minimum identifiable structural displacement is 0.2 mm, and the average measurement error is ±0.1 mm, which realizes the high-accuracy non-contact automatic monitoring of the differential deformation of immersed tunnel element joints.
(4) The test results of the application in the immersed tunnel project of Hong Kong-Zhuhai-Macao Bridge show that the equipment has a long-term stability and reliability. The equipment has successfully captured the abnormal deformation of E31∼E32 element joints in the supporting project, providing effective data support for the safety assessment of the engineering structure.
(5) This equipment is still in its engineering prototype stage at present, requiring a lot of efforts in engineering application verification and optimization to ensure good engineering applicability, stability and reliability. With the progress of technology and the reduction of camera cost, this equipment is expected to have a broader application prospect.
Data availability statement
The original contributions presented in the study are included in the article/supplementary material, further inquiries can be directed to the corresponding author.
Author contributions
HG wrote the original manuscript and carried out the hardware design and development. YY, HD, and XL proposed the idea, supervised the research work, and revised the manuscript. HG and MY discussed and analyzed the results.
Funding
The present work was supported by the National Key R&D Program of China (No. 2019YFB1600702).
Conflict of interest
Authors HG, HD, and MY were employed by China Merchants Chongqing Communications Technology Research and Design Institute Co, Ltd.
The remaining authors declare that the research was conducted in the absence of any commercial or financial relationships that could be construed as a potential conflict of interest.
Publisher’s note
All claims expressed in this article are solely those of the authors and do not necessarily represent those of their affiliated organizations, or those of the publisher, the editors and the reviewers. Any product that may be evaluated in this article, or claim that may be made by its manufacturer, is not guaranteed or endorsed by the publisher.
References
1. Li H, Jiang G, Zhang G, et al. Consideration on common diseases of immersed tunnel and its inspection and maintenance. Tunnel Construction (2019) 39(A01):6. doi:10.3973/j.issn.2096-4498.2019.S1.063
2. Yang H, Xu X. Structure monitoring and deformation analysis of tunnel structure. Compos Structures (2021) 276:114565. doi:10.1016/j.compstruct.2021.114565
3. Du L, Zhong R, Sun H, Zhu Q, Zhang Z. Study of the integration of the CNU-TS-1 mobile tunnel monitoring system. Sensors (2018) 18(2):420. doi:10.3390/s18020420
4. Xu DS, Zhao YM, Liu HB, Zhu HH. Deformation monitoring of metro tunnel with a new ultrasonic-based system. Sensors (2017) 17(8):1758. doi:10.3390/s17081758
5. Hou G, Li Z, Hu Z, Feng D, Zhou H, Cheng C. Method for tunnel cross-section deformation monitoring based on distributed fiber optic sensing and neural network. Opt Fiber Techn (2021) 67:102704. doi:10.1016/j.yofte.2021.102704
6. Xiong-yao X, Cheng-min Y, Wei-ping L, et al. Safety analysis of settlement monitoring data of joints of Yongjiang immersed tube tunnel during operation period. Chin J Geotechnical Eng (2019) 41(12):7. doi:10.11779/CJGE201912020
7. Xiong-yao X, Wang P, Yong-sheng L, et al. Monitoring data and finite element analysis of long term settlement of Yongjiang immersed tunnel. Rock Soil Mech (2014) 35(8):11. doi:10.16285/j.rsm.2014.08.026
8. Zheng Y, Jinbo Y, Junwei L. Horizontal displacement monitoring technology of the Ningbo Changhong immersed tube tunnel. Urban Geotechnical Invest Surv (2014) 35(8):11. doi:10.3969/j.issn.1672-8262.2012.05.044
9. Pan S, Chen C, He J, et al. Design and application of automatic deformation monitoring system (ADMS) for immersed tunnel construction. In: Proceedings of the 2018 Annual Academic Conference of the Chinese Society of Civil Engineering (2018).
10. Liu D, Cui Y, Tan W, Chen Y. Sg-net: Spatial granularity network for one-stage video instance segmentation. In: Proceedings of the IEEE/CVF Conference on Computer Vision and Pattern Recognition; 20-25 June 2021; Nashville, TN, USA (2021). p. 9816–25.
11. Liu D, Cui Y, Chen Y, Zhang J, Fan B. Video object detection for autonomous driving: Motion-aid feature calibration. Neurocomputing (2020) 409:1–11. doi:10.1016/j.neucom.2020.05.027
12. Cui Y, Yan L, Cao Z, Liu D. Tf-blender: Temporal feature blender for video object detection. In: Proceedings of the IEEE/CVF International Conference on Computer Vision; 10-17 October 2021; Montreal, QC, Canada (2021). p. 8138–47.
13. Zhang J, Bo Y, Yanfeng G, et al. Research status and prospects of intelligent monitoring technology and information management system for tunnel engineering. Chin J Underground Space Eng (2021) 17(02):567–79.
14. Zhao X, Li Q. A review on measurement technology for structural testing in civil engineering. J Xi'an Univ Arch Tech (Natural Sci Edition) (2017) 49(01):48–55. doi:10.15986/j.1006-7930.2017.01.008
15. Deng H. Measurement of vibration response of flexible structure under thermal environment based on machine vision. Bangladesh: Southeast University (2020).
16. Wu C. The research of Digital Close-Range Photogrammetry in building deformation monitoring. Zhengzhou, Henan, China: Henan University of Technology (2009).
17. Wang X. Development and application of structural displacement monitoring system based on image recognition technology. China: Nanjing University of Science and Technology (2009).
18. Ye X-W, Chuan-zhi D. Review of computer vision—Based structural displacement monitoring. China J Highw Transport (2019) 32(11):19.
19. Chuan-zhi D. Machine vision-based bridge health monitoring and condition assessment. Zhejiang, China: Zhejiang University (2016).
20. Tu W, Li Q, Gao W, et al. A real-time precision measurement method for bridge deflection based on machine vision. Surv Mapp Geographical Inf (2020) 45(6):80–7. doi:10.14188/j.2095-6045.2020541
21. Li S. Application of close-range photogrammetry in water conservancy and hydropower engineering. Water Conservancy Hydropower Techn (1987) 1987(05):19–22.
22. Li H. Close-range digital imagine technologies for hydroelectric engineering. China: Hohai University (2005).
23. He L, Zhong L, Qi-jun H, et al. Evaluation for the foundation pit stability based on the multi - sample capacity close - range photogrammetry. J Saf Environ (2020) 20(06):2180–6. doi:10.13637/j.issn.1009-6094.2019.1110
24. Meng L, Zou J, Zhu Y. Application of close-range photogrammetry in foundation pit monitoring. Bull Surv Mapp (2015) 2015:167–70. doi:10.13474/j.cnki.11-2246.2015.0648
25. Liu C. Study of photographs monitoring analysis system for slope stability. Wuhan, China: Wuhan University of Technology (2008).
26. Ling J, Zhang Y, Li M. Research progress of intelligent monitoring system for highway slope. J Cent South University(Science Technology) (2021) 52(7):2118–36. doi:10.11817/j.issn.1672-7207.2021.07.003
27. Jin J. Three-dimensional measurement technology research based on multiple view geometry. Hefei, China: University of Science and Technology of China (2014).
28. Spencer BF, Hoskere V, Narazaki Y. Advances in computer vision-based civil infrastructure inspection and monitoring. Engineering (2019) 5(02):199–222. doi:10.1016/j.eng.2018.11.030
29. Zheng C, Shi H, Chong X. A new monitoring method for large span underground space structure displacement. Proceedings of the 3rd National Engineering Safety and Protection Academic Conference. 2012.
30. Zhu Z, Lei Y, Qi G, Chai Y, Mazur N, An Y, et al. A review of the application of deep learning in intelligent fault diagnosis of rotating machinery. Measurement (2022) 206:112346. doi:10.1016/j.measurement.2022.112346
31. Zhu Z, He X, Qi G, Li Y, Cong B, Liu Y. Brain tumor segmentation based on the fusion of deep semantics and edge information in multimodal MRI. Inf Fusion (2023) 91:376–87. doi:10.1016/j.inffus.2022.10.022
32. Zhao L, Yang R, Guo C. Research on sub-pixel precise thresholding for feature points of circular array target extraction. China Sciencepaper (2015) 10(08):942–7. doi:10.3969/j.issn.2095-2783.2015.08.014
33. Xiangnan M, H L, Lili L. Improved least square algorithm and application in ellipse fitting. Mechatronics engineering school. Henan Univ Science&Technology (2014) 35(03):18–21+5. doi:10.15926/j.cnki.issn1672-6871.2014.03.018
34. Tong Z. Algorithm of relative pose estimation for space target based on monocular-vision. Harbin, China: Harbin Institute of Technology (2012).
Keywords: immersed tunnel, photogrammetry, element joint, differential deformation, automatic monitoring
Citation: Guo H, Yan Y, Ding H, Liu X and Yang M (2023) Development and application of automatic monitoring equipment for differential deformation of element joint in immersed tunnel. Front. Phys. 11:1134431. doi: 10.3389/fphy.2023.1134431
Received: 30 December 2022; Accepted: 27 January 2023;
Published: 09 February 2023.
Edited by:
Guanqiu Qi, Buffalo State College, United StatesReviewed by:
Jing Bi, Guizhou University, ChinaJinpeng Zhang, Shandong Agricultural University, China
Jian Sun, Southwest University, China
Copyright © 2023 Guo, Yan, Ding, Liu and Yang. This is an open-access article distributed under the terms of the Creative Commons Attribution License (CC BY). The use, distribution or reproduction in other forums is permitted, provided the original author(s) and the copyright owner(s) are credited and that the original publication in this journal is cited, in accordance with accepted academic practice. No use, distribution or reproduction is permitted which does not comply with these terms.
*Correspondence: Xinrong Liu, liuxrong@126.com