 Honglei Ren
 Yuezan Tao
 Ting Wei
 Bo Kang
 Naifeng Zhang3,4
 Yucheng Li
 Fei Lin
95% of researchers rate our articles as excellent or good
Learn more about the work of our research integrity team to safeguard the quality of each article we publish.
Find out more
ORIGINAL RESEARCH article
Front. Phys. , 21 March 2023
Sec. Fluid Dynamics
Volume 11 - 2023 | https://doi.org/10.3389/fphy.2023.1134353
This article is part of the Research Topic Editor’s Challenge in Fluid Dynamics: Flows Across the Scales View all 4 articles
For a long-distance open-channel water transfer project, the correctness of the hydrological state study and hydrodynamic numerical simulation is impacted directly by the spatiotemporal and consistency of the flow monitoring data along the project. Reported here is an inverted data cleaning model for flow monitoring stations based on the principle of water dynamic balance and the longest sequence method of interval flow, targeting the abnormal phenomenon of unequal flow at monitoring stations in the dispatching operation and using the middle route of the South-to-North Water Diversion Project in China as the research object. As an example, a hydrodynamic model is built for verification using flow and water level data after model cleaning as the upper and lower boundaries, respectively, for the middle-route project from the Baihe River to Huangjin River. The findings indicate that the cleaning model enhances the accuracy of flow monitoring data and reduces both the mean absolute error of the water level in front of the gate and the root-mean-square error by 0.0757 and 0.0895 m, respectively. In terms of data spatial consistency and logic, the cleaned flow data are superior to the measured flow data.
In recent years, the level of information associated with the middle route of the South-to-North Water Diversion Project (SNWDP) has increased as the distribution of monitoring stations along the project has intensified, and the quality of hydrological information monitoring and monitoring data has attracted increasing attention [1]. Hydrological monitoring data are the basis for scientific research and scheduling decisions in water diversion projects [2]. However, in hydrological data monitoring, subjective and objective factors such as manual data recording errors, monitoring equipment failures, and data transmission errors [3,4] cause frequent data monitoring anomalies, and these directly affect the quality of data monitoring and indirectly affect the formulation of scheduling decisions in the water conveyance process, thereby increasing the cost of water diversion. As an important part of hydrological information monitoring, flow monitoring is very important for the hydraulic control of channels and analyzing the hydraulic characteristics of water delivery systems [5].
During open-channel water transfer, when the data suggest that the flow through the downstream control gate is continuously greater than that through the upstream control gate at multiple moments, this occurrence is known as flow monitoring point data inversion, i.e., the phenomenon of flow inversion, which adversely affects engineering application and theoretical research based on flow data. For example, when calculating the channel storage capacity, sustained flow inversion leads to the calculated water storage capacity of the canal pool being lower than the actual value, affecting the safety of the actual project operation, However, in one-dimensional hydrodynamic simulation, if the flow data for the upper and lower boundary conditions are inverted, this leads to a simulation-calculated water level that is higher than the actual value, thereby exacerbating the simulation error.
Hydrological data cleaning (DC) is the application and expansion of DC in the water conservation industry. In previous research on DC related to water conservation, Shi et al. combined regional hydrological data with the characteristics of long time-series and a large amount of data, adopted the 3σ (“3 sigma”) criterion method to eliminate outliers, and achieved remarkable results[6]. Chen proposed a distributed and optional cleaning scheme based on Hadoop for data problems such as missing data and outliers in hydrological data monitoring [7]; experiments showed that this scheme offers significantly improved performance of the DC algorithm, with the filling accuracy of missing data improved by ca. 10%. In recent years, with the rapid development of artificial intelligence, the direction of data anomaly diagnosis and interpolation has extended to the fields of artificial intelligence, machine learning, and deep learning [8–12]. Jin et al.[13] proposed a cleaning method for monitoring data on the state of hydropower units and verified its effectiveness via measured monitoring parameters. Yan et al.[14] fully considered the characteristics of time-series data, using the DBSCAN algorithm for anomaly detection, combining random forest prediction with time-series analysis to fill in missing values, and completing the cleaning of hydropower telemetry data. Zheng et al.[15] proposed a clustering algorithm considering association rule constraints to identify abnormal values of dam displacement monitoring and used the PSO-LSSVM model to reconstruct abnormal data, which improved the accuracy of dam safety monitoring data.
Hydrological monitoring data can be divided into two types, i.e., time series and spatial sequence, according to different data arrangements, which in turn can have different physical meanings. Most of the aforementioned cleaning studies considered time-series data as the main cleaning target (e.g., hydropower unit status and hydropower telemetry data) and did not consider spatial sequence data. Arranged as a time series, data can represent the working state of a sluice in different periods, and arranged as a spatial sequence, data can reflect the working status of different throttle gates at the current time. Therefore, to ensure the logic and consistency of traffic data, it is necessary to clean them both temporally and spatially. Considering time-series data, their spatial connection is included in the analysis, i.e., the change rule and connection between the flow data of different spatial positions in the same channel are considered, and an inverted cleaning model for flow monitoring stations is constructed to realize the comprehensive diagnosis and cleaning of flow monitoring data.
The present work is focused on data inversion for flow monitoring stations along the middle route of the SNWDP. To establish the data inversion cleaning model for monitoring stations, the spatial scale relationship of flow data, the dynamic balance principle of water volume, and the longest sequence method of interval flow are considered. To provide trustworthy data support for the hydraulic calculation and dispatching operation of the middle-route project, the causes of inversion data are examined, and the flow data before and after cleaning are used as the upper boundary conditions to verify the influence of DC on the simulation results of the hydrodynamic model.
This paper is divided into four main parts. First, details are given about the research area and data, the research object and data characteristics, and the phenomenon of data inversion in the current monitoring data. Second, the research method is introduced and a new DC method is proposed for monitoring data in the SNWDP, which well-solves the problem of data inversion at monitoring stations. Third, the causes of flow inversion are analyzed via research examples, and the new DC method is used to clean the monitoring data; both the cleaned and uncleaned data are substituted into the hydrodynamic model for examination, and it is found that the cleaned data offer significantly improved simulation accuracy of the hydrodynamic model. Finally, the innovative points of the paper and the conclusions are summarized.
The construction management bureau of the middle route of the SNWDP has installed a significant number of monitoring stations along the route, forming a monitoring station network that includes water levels before and after sluices, sluice flows, and other hydrological and engineering data. This was carried out to support the operation and dispatching management of the middle-route project, which includes 161 flow monitoring locations, the majority of which are situated between 100 and 500 m upstream and downstream of a sluice or water outflow. Some of the observed flow data of the control gates are the sum of the flow of the control gate and the flow of the front backwater gate, which should be taken into account in the flow calculation, in accordance with the technical design parameters. The research area’s 43-km-long stretch, which runs from the Baihe River control gate to the Golden River control gate, is part of Henan Province and uses open channels for self-flowing water transfer. Figure 1 shows the location of the research area.
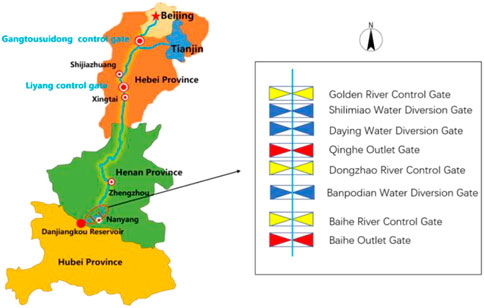
FIGURE 1. Research area.
To facilitate research on data inversion cleaning of monitoring points, avoiding the direct influence of factors such as precipitation into the canal, freezing and thawing in the glacial period, and evaporation[16] along the canal section on the loss of water volume rate[17] and the indirect influence on the DC of the inverted data, the research period was selected based on no ice cover, less rainfall, and a small climate difference along the route. After a comprehensive analysis, October 2018 was determined as appropriate for research, and according to the dispatching operation data for that month, the data at 15:00 on October 13th were selected for correction given the propensity of traffic inversion times. The flow data for the whole route at 15:00 on October 13th are shown in Figure 2.
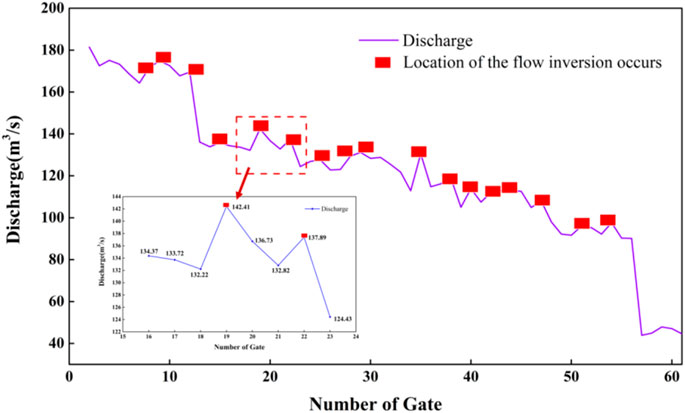
FIGURE 2. Study period to control the flow of gates.
For the middle route of the SNWDP, the loss of water volume during any time period can be calculated as follows, according to the principle of dynamic water volume balance [18]:
where QL is the rate of loss of water volume flow of the canal (m3/s); Δt is the time period (s); Qin and Qout are the channel inflow and outflow (m3/s), respectively; Qf is the sum of water diversion flow and water discharge flow during the period (m3/s); and V1 and V2 are the water storage volume of the canal section at the initial and final time of the period (m3), respectively, which can be calculated using the hydrodynamic model. The dimensionless loss of water volume rate RL can be obtained by dividing the loss of water volume rate QL by the inflow rate Qin, i.e.,
Monitoring-site inverted DC involves calculating the theoretical flow value of each control gate as the basis for dividing the interval. To ensure the reliability of the calculation results for the theoretical flow data of the sluice, it is necessary to select the flow monitoring data of a reliable monitoring section as the basis for cleaning. The specific steps of inverted DC are as follows:
Step 1:. Calculate the loss of water volume rate of each canal section according to the principle of dynamic water volume balance.
Step 2:. Theoretical control-gate flow calculation. Based on the principle of dynamic water volume balance, the theoretical flow value for each control gate (target control gate) is derived from the selected specific monitoring section to the downstream, and the dimensionless flow deviation coefficient is obtained. The calculation formulas are as follows:
where L is the total length of the canal section (m). l is the distance from the first check gate in the channel to the target check gate (m); Qup is the flow of the upstream control-gate overflow (m3/s); RL indicates the rate of the loss of water volume; Qup,actual is the selected monitoring-section flow during the study period (m3/s); Qdown,theory is the theoretical flow of the target sluice calculated by water volume balance calculation (m3/s); Qs is the sum of diverted water flow from the selected monitoring section to the target sluice interval (m3/s); Qdown,actual is the measured flow of the target control gate (m3/s); and ql is the dimensionless flow-deviation coefficient.
Step 3:. Cleaning interval division. On the premise of ensuring that the flow of the downstream monitoring section is less than that of the upstream monitoring section, considering that there is a ±5% deviation in the flow monitoring of the middle-route sluices [19], the main channel of the middle route is divided into several sections according to the absolute value of the flow deviation coefficient being less than 1%.
Step 4:. Selecting of flow data to be corrected in the cleaning interval. Flow data filtering should be carried out within the interval. The flow data in each interval are checked and filtered in turn. The cleaning of the inverted data can be characterized as “pulling one hair and moving the whole body,” i.e., correcting of the flow data for the current sluice affects those for the adjacent sluice. Therefore, the screening of flow data to be corrected using the interval flow longest series method and the interval longest series method is as follows:
1) Determine the selection criteria: considering the reliability of part of the sluice flow monitoring equipment along the route, the flow rate of the downstream control gate is greater than the flow rate of the upstream control gate at the same time as the data selection criteria.
2) Select the flow data to be cleaned. In the interval, the first control gate, the second control gate, and the third control gate are used as reference targets in turn, and the number of flows to be cleaned in each control gate is counted.
3) After the end of the statistical analysis, according to the standard selection, determine the reference control gate and obtained the data to be cleaned.
Step 5:. Interval flow cleaning. According to the longest sequence found, the principle of water dynamic balance is used to clean the control-gate data in the interval. The cleaning formula is
where Qup is the flow of the upstream control-gate overflow (m3/s); Qfen is the sum of diversion flow and backwater flow from the first section to the control gate to be cleaned (m3/s); Qdowm is the flow value to be cleaned (m3/s); ls is the distance from the first section of the interval to the control gate to be cleaned (m); and Ls is the interval length (m).
Water regime monitoring and hydrodynamic simulation are common means to obtain the water regime state of the monitoring section of the water diversion project. This paper aims to use the hydrodynamic model to test the influence of the inverted data of the flow monitoring points on the simulation accuracy before and after cleaning. In the open-channel water diversion project, the water diversion length is often greater than the width and depth of the water delivery section, so the hydrodynamic simulation of the water diversion system can be approximated as a one-dimensional problem. The basic governing equations of a one-dimensional hydrodynamic model are the Saint-Venant equations of one-dimensional unsteady flow [20], which are given as follows:
where B is the cross-sectional (m), Z is the water level (m), t is time (s), Q is the flow rate (m3/s), X is the longitudinal distance of the channel along the mainstream direction (m), t is the time coordinate (s), α is the momentum correction coefficient, q is the side flow in the channel (m3/s), A is the water area (m2), g is the acceleration of gravity (m/s2), C is the Chezy coefficient, R is the hydraulic radius (m), and n is the Manning’s roughness coefficient of the water conveyance channel.
The aforementioned Saint-Venant equations are first-order quasi-linear hyperbolic partial differential equations; generally, an analytical solution cannot be obtained directly, and instead an approximate solution is obtained using a discrete numerical method [21]. After comprehensive comparison, we used the Preissmann four-point weighted implicit difference scheme with good stability, high calculation accuracy, and fast convergence to discretize the Saint-Venant equations [22], and we used the chase method to solve them [23]. The form of the discretization grid [24] is shown in Figure 3.
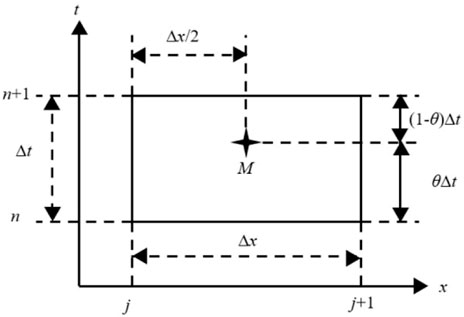
FIGURE 3. Schematic diagram of Preissmann four-point eccentric format.
The statistical results show that on average, there were 118 inversions of the flow data of the monitoring stations in October, which are given in Table 1. Among them, the eight control gates of Tiaohe River, Lihe River, Xiaohong River, Mengfen River, Hebiqi River, Anyang River, Wuhe River, and the west of Montenegro have no flow inversion data at the monitoring station; by contrast, the flow data of Caodun River, Penghe River, Shuangji River, Chaohe River, Huangshui River, and Zhanghe River were inverted more frequently, accounting for 89.72%, 100%, 99.72%, 100%, 95.83%, and 99.72%, respectively. The rest of the sluice monitoring-station flow data were inverted fewer times, accounting for less than 20%.
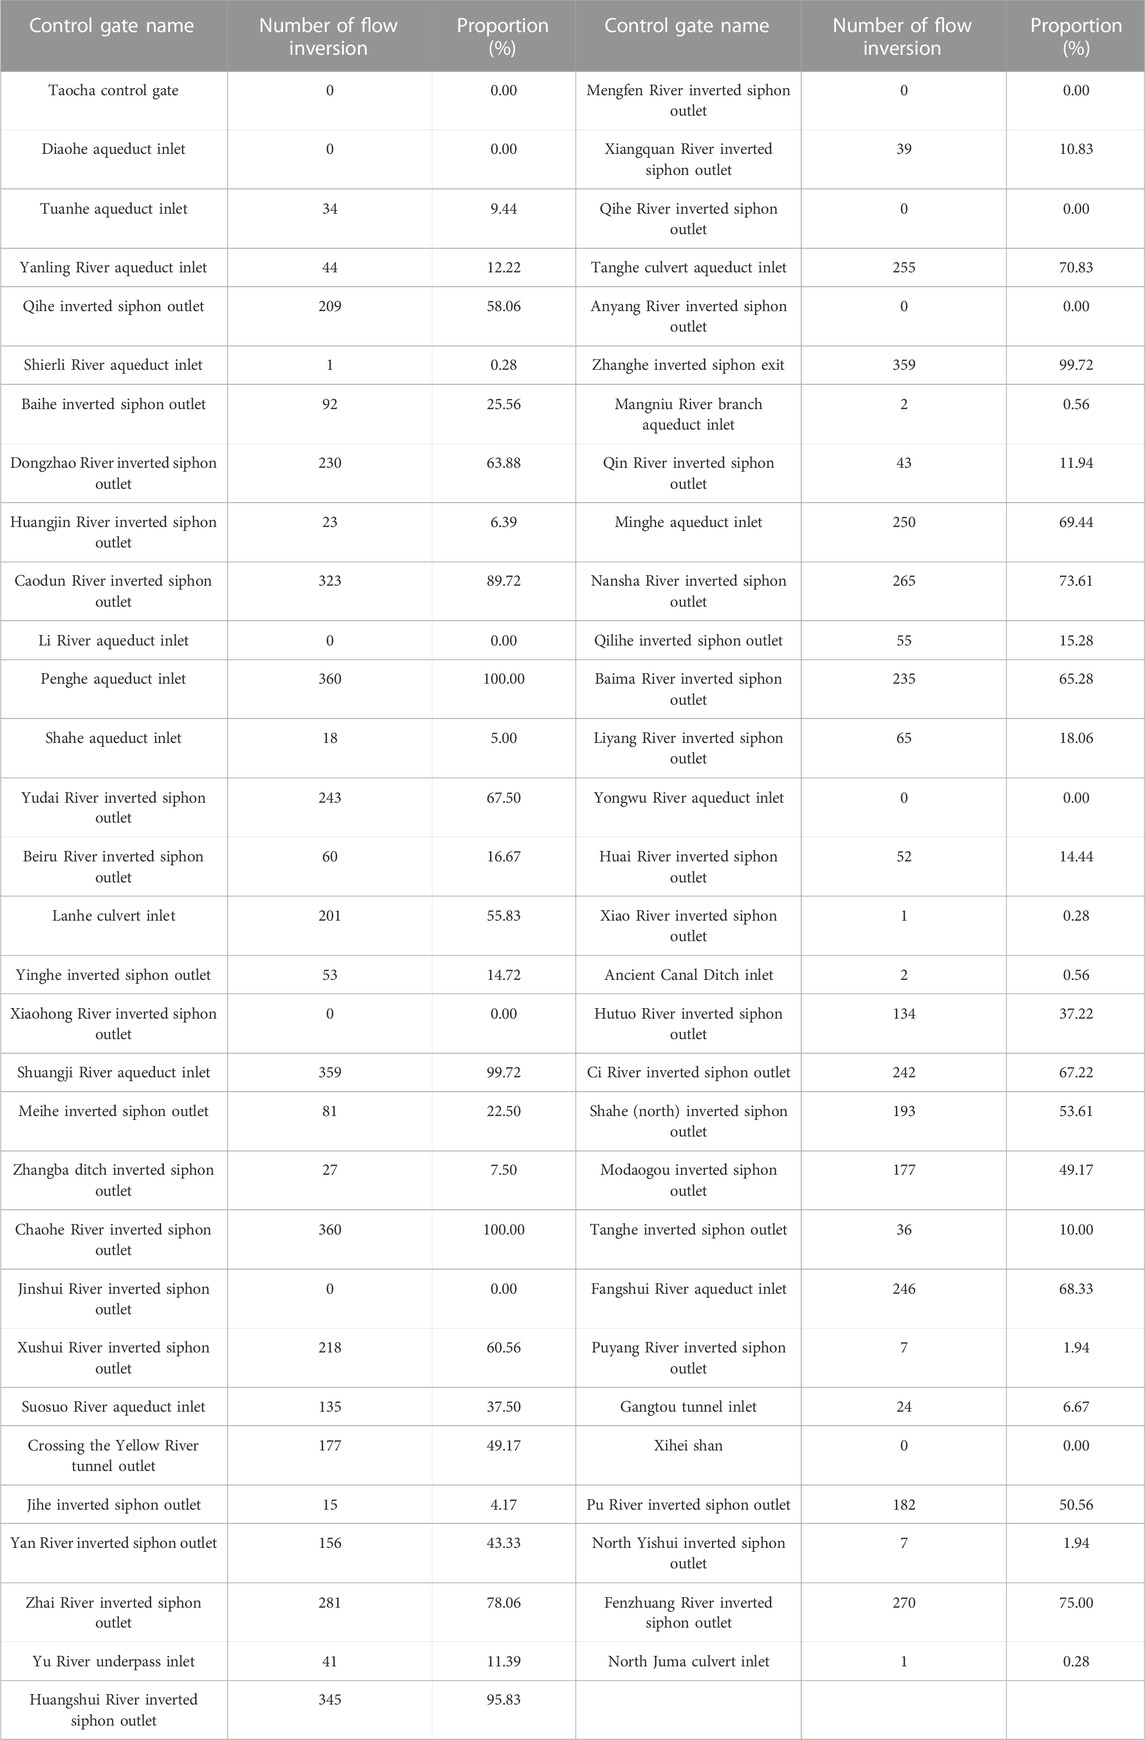
TABLE 1. Statistics of flow inversion of control gates along the whole of the middle route of the South-to-North Water Diversion Project (SNWDP).
Monitoring equipment often has systematic errors in the process of data monitoring, resulting in a larger or smaller flow monitoring value than the theoretical value. Therefore, the control gates with more than 80% of the flow inversion times of the monitoring stations are selected for the impact analysis of the monitoring equipment. The proportion of the flow deviation of each control gate and the upstream control gate relative to the theoretical flow deviation is calculated, and the average value (average relative deviation) is calculated. The calculation results are given in Table 2.
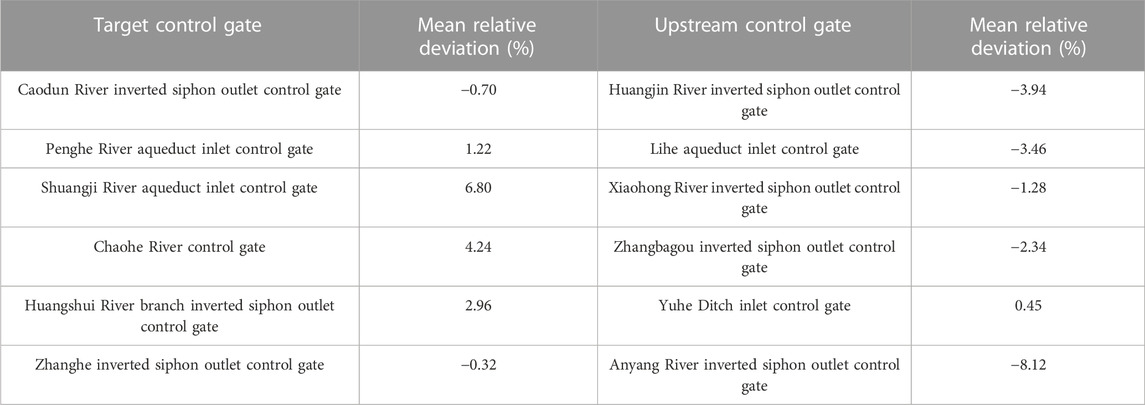
TABLE 2. Statistics of the average relative deviation of the selected control gate and the upstream control gates.
The number of flow inversions at the monitoring stations in October was 45, accounting for 8.34% of the total number of inversions at the Zhangbagou control gate as the upstream gate of the Chaohe control gate. The comparison between the measured and theoretical flow data for October at the Zhangbagou and Chaohe control gates is shown in Figure 4. As can be seen, the actual flow of the Zhangbagou control gate is smaller than the theoretical flow, with an average relative deviation of −2.34%, while the actual flow of the Chaohe control gate is larger than the theoretical flow, with an average relative deviation of 4.24%. In summary, the main reason for the inversion of the flow rate of the monitoring station at the Chaohe control gate is that the observed value of the flow rate monitoring equipment at the upstream gate is large.
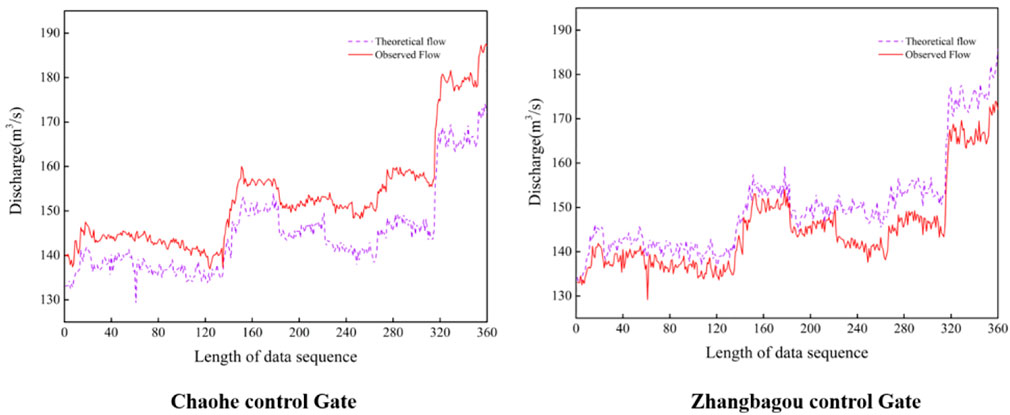
FIGURE 4. Comparison of observed flow and theoretical flow between the Chaohe control gate and Zhangbagou control gate.
The following conclusions were reached: the inversion of the flow data at the monitoring points of the Penghu River crossing gates, Shuangji River crossing gates, Caodun River inverted siphon outlet gates, Yellow River branch inverted siphon outlet gates, and Zhang River inverted siphon outlet gates was caused by the low observation values of the monitoring equipment at the upstream gates; the inversion of the flow data at the monitoring points of the Shuangji River crossing gates and Yellow River inverted siphon outlet gates was caused by the high observation values of their own monitoring equipment. The reason for the inversion of the flow data at the monitoring stations is that the observation value of the monitoring equipment at the upstream gates is low; the reason for the inversion of the flow data at the monitoring stations at the inlet gates of Shuangke River and the outlet gates of Huangshui River is that the observation value of the monitoring equipment at the inlet gates of Shuangke River and the outlet gates of Huangshui River is high.
The control gates with less than 20% of the number of traffic inversions at the monitoring stations are selected to analyze the impact of the regulation of the control gates, and the total regulation times of the control gates and the number of regulation times in the inversion events are counted. The statistical results are given in Table 3. The seven control gates such as Shierli River, Mangniu River, Xiao River, Guyunhe River, Puyang River, Beiyishui River, and Beijuma River, due to the low number of control gate regulation, were abandoned. A total of 18 monitoring-station flow inversion events occurred at the inlet control gate of Shahe Aqueduct, including 13 gate control events, accounting for 72.2%. In the Zhangbagou inverted siphon outlet control gate, a total of 27 monitoring station flow upside down events occurred, including 17 gate control, accounting for 62.9%; a total of 24 monitoring station flow inversion events occurred at the entrance of the Gangtou tunnel, including 10 gate control events, accounting for 41.67%. Therefore, it can be concluded that the occurrence of inversion events at the monitoring points of the Shahe aqueduct inlet control gate, Zhangbagou inverted siphon outlet control gate, and Gangtou tunnel inlet control gate is affected by the interference of control gate regulation.
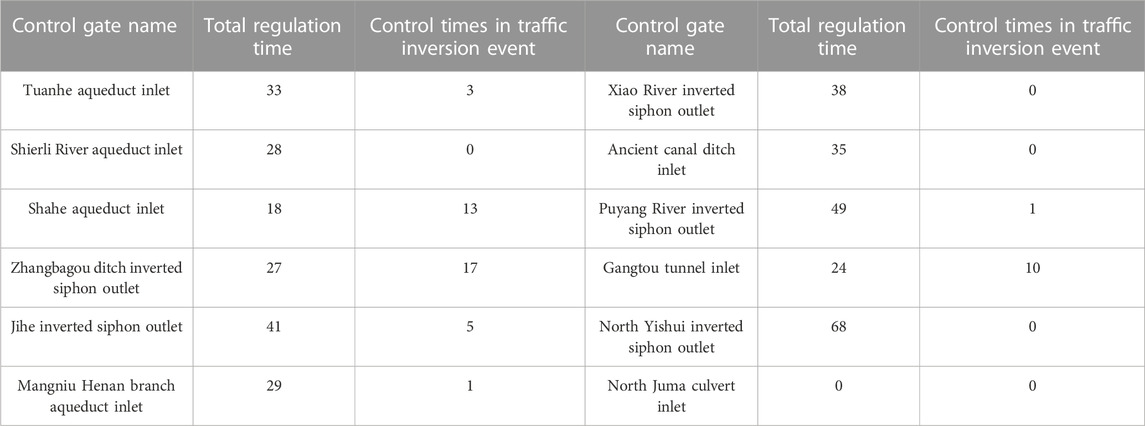
TABLE 3. Statistics for control gates in October.
There are 63 control gates in the study area, so the main canal can be divided into 62 canal sections. Considering that the engineering parameter design and layout of different canal sections along the route have certain similarities[25], in the formulation of the annual water dispatching plan and water dispatching of the middle-route project, the main control sections are the Taocha canal head, the Diaohe aqueduct inlet control gate, the Caodun River inverted siphon inlet control gate, the Yellow River tunnel outlet control gate, the Zhanghe inverted siphon outlet control gate, the Gangtou tunnel inlet control gate, and the North Juma River subsurface channel inlet control gate. Therefore, the control gates of the middle-route project from the head of the Taocha canal to the entrance of the north Juma underground canal are divided into five sections, and the loss of water volume rate in each section is calculated. Through a consistency check of the water regime data of the check gates and water outlets along the middle route of the SNWDP, jumps in monitoring data caused by power failures of monitoring equipment are eliminated, and the corresponding loss of water volume rate of each channel section is obtained by using the principle of dynamic water volume balance. The calculation results are given in Table 4.
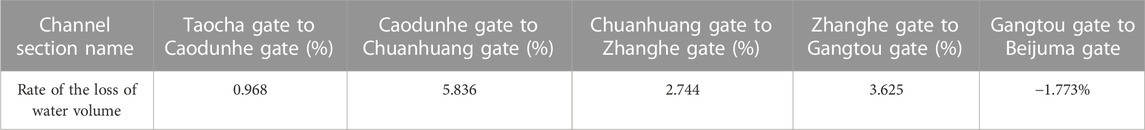
TABLE 4. Loss of water volume rate of five canal sections in the middle route of the SNWDP.
The flow monitoring data of the Taocha channel head outlet are an important basis for monitoring the inter-basin water inflow in the middle route of the SNWDP, which provides accurate data support for the calculation of diversion flow in that route [26]. Therefore, the monitoring data of the Taocha control gate at the head of the SNWDP is considered to be accurate. Using the aforementioned research methods to correct the data of October 2018, the correction effect diagram at 15: 00 on October 13th is shown in Figure 5.
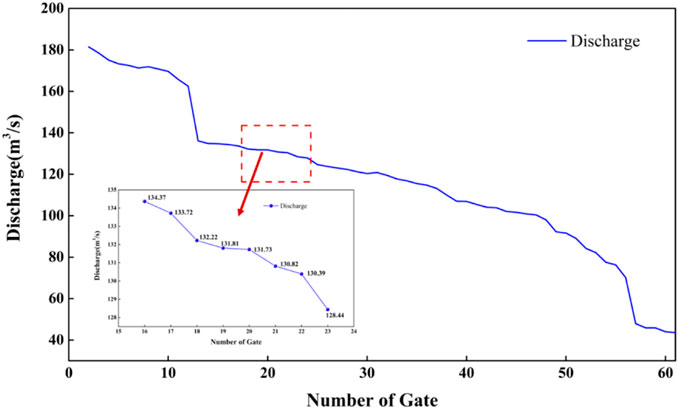
FIGURE 5. Data cleaning result figure at 15:00 on October 13.
Using the flow data before and after cleaning as the upstream boundary conditions, a one-dimensional hydrodynamic model was constructed to test the influence of the cleaning model on the hydrodynamic simulation. The channel section selected for this simulation is from the Baihe River to the Huangjin River of the middle route of the SNWDP. The upper boundary condition of the model adopts the flow of the Baihe inverted siphon outlet regulating gate, and the lower boundary condition adopts the water level in front of the Huangjin River inverted siphon outlet regulating gate to simulate the change process of the water level in front of the Dongzhao River inverted siphon outlet regulating gate in the next month, and the simulation results before and after cleaning are compared with the measured data. The hydrodynamic simulation results are shown in Figure 6.
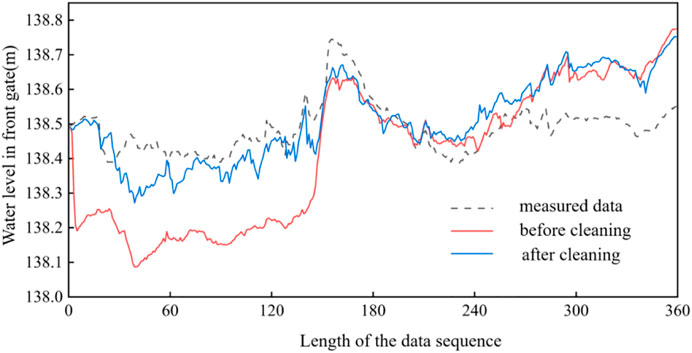
FIGURE 6. Comparison of hydrodynamic simulation results of Dongzhao River control gate.
Figure 6 shows that the simulation results of the first 155 data sequences after cleaning are better than those before cleaning, whereas the simulation results of the latter 205 data sequences before and after cleaning are similar. The causes of this phenomenon are analyzed. 1) In the first 155 data sequences, the upstream Baihe sluice flow data before cleaning are less than those of the downstream Dongzhao River sluice. Through the cleaning model, the flow data of the whole route at this time are cleaned. After cleaning, the flow data of the Baihe sluice are changed and larger than those of the Dongzhao River. The cleaning results ensure the logic of the flow data, so the final simulation results are better than those before cleaning. 2) Among the 205 data sequences after cleaning, the flow data of the upstream Baihe control gate before cleaning are less than those of the Dongzhao River control gate, accounting for 9.7%. The flow data change after cleaning, and in the process of hydrodynamic simulation, the change in the boundary data has a direct impact on the simulation results, so the simulation results before and after cleaning are similar.
The simulation results of the hydrodynamic model are analyzed statistically. Based on the simulation results of the flow data before cleaning, the absolute error range of the water level before the gate is 0.0006–0.373 m, the average absolute error is 0.1537 m, the relative error range is 0.27%–0.17%, and the root mean square error is 0.1845 m. In the simulation results based on the data after cleaning, the absolute error range of water level before sluice is 0.0005–0.207 m, the average absolute error is 0.078 m, the relative error range is 0.14%–0.15%, and the root mean square error is 0.095 m. Through comparison, it can be seen that the hydrodynamic simulation accuracy based on the cleaned data is higher, which proves the rationality of the DC model of flow inversion.
This paper proposes a method for cleaning the flow inversion data at monitoring stations based on the principle of dynamic water volume balance and the longest series of intervals, and the causes of the inversion phenomenon were analyzed. Finally, the influence of DC on simulation model simulation was verified by constructing a hydrodynamic model. The main conclusions are as follows.
1) The aforementioned method was used to clean the historical data from October 2018, and the results showed that this cleaning method can effectively solve the problem of abnormal flow inversion data.
2) From analyzing the inversion data from October 2018, it was concluded that deviations of the monitoring values of the flow monitoring equipment and the interference by gate regulation are the main reasons for the inversion phenomenon at the flow monitoring station.
3) By comparing the simulation results of the pre-gate water level of the Dongzhao River gates with the flow data before and after cleaning of the Baihe gates as the upper boundary of the hydrodynamic model, it was found that the average error of the pre-gate water level simulation was reduced by 0.0757 m and the mean square error was reduced by 0.0995 m, and the cleaned flow data as the upper boundary condition can effectively improve the simulation accuracy. The research results show that the cleaned flow data are better than the measured flow data in terms of logic and consistency in data space and can be promoted and applied in actual projects.
In this paper, data diagnosis and cleaning were carried out for the phenomenon of flow inversion at different monitoring stations, which was carried out to diagnose abnormal data on spatial scale. However, abnormal data in actual engineering may exist on not only the spatial scale but also the temporal scale, so the question of whether future DC models can directly diagnose the two different scales should be studied in depth to explore the laws of data presentation on different scales.
The original contributions presented in the study are included in the article/Supplementary Material; further inquiries can be directed to the corresponding author.
HR and FL: software, methodology, data curation, validation, conceptualization, methodology, writing—original draft, review, and editing. TW and NZ: investigation and visualization. BK, YL, and YT: funding acquisition and project administration. All authors contributed to the article and approved the submitted version.
This work was supported by the National Key Research and Development Program of China (No. 2018YFC1802700); the Open Research Fund Program of State key Laboratory of Hydroscience and Engineering, Tsinghua University (No. sklhse-2020-D-06); the National Natural Science Foundation of China (No. 42107162); the Natural Science Foundation of Anhui Province (No. 1908085QD168); the Fundamental Research Funds for the Central Universities of China (No. PA2021 KCPY0055); and the National Natural Science Foundation of China (No. 51809002).
The authors declare that the research was conducted in the absence of any commercial or financial relationships that could be construed as a potential conflict of interest.
All claims expressed in this article are solely those of the authors and do not necessarily represent those of their affiliated organizations, or those of the publisher, the editors, and the reviewers. Any product that may be evaluated in this article, or claim that may be made by its manufacturer, is not guaranteed or endorsed by the publisher.
1. Li YQ, Ma FP, Xue P. Research on perception of open channel water flow imbalance and early warning method of water level overrun. Water Resour Hydropower Eng (2022) 53(1):73–82. doi:10.13928/j.cnki.wrahe.2022.01.008
2. Zhan PY. The analysis and design of North Water Transfer project in Shandong hydrological monitoring and dispatching management system. Jinan: Shandong University (2014).
3. Liao SY. A review of data cleansing research. Comp knowledge Technol (2020) 16(20):44–7. doi:10.14004/j.cnki.ckt.2020.2361
4. Elshorbagy A, Simonovic P, Panu U. Estimation of missing streamflow data using principles of chaos theory. J Hydrol (2002) 255(1-4):123–33. doi:10.1016/s0022-1694(01)00513-3
5. Wang YL, Jin YG, Chen XN. Comparison between LSTM neural network and dimensional analysis method in discharge calculation of arc gates. South-to-North Water Transfers Water Sci Tech (2022) 20(3):590–9. doi:10.13476/j.cnki.nsbdqk.2022.0060
6. Shi JG, Zhang YF. Application of Pauta criterion in handling regional hydrological data outliers. Haihe Water Resour (2016) 5:49–51. doi:10.3969/j.issn.1004-7328.2016.05.017
7. Chen QNS. Research of hydrologic data cleansing scheme based on Hadoop. Wuhan: Wuhan University of Technology (2016).
8. Choong MK, Charbi M, Yan H. Autoregressive-model-based missing value estimation for DNA microarray time series data. IEEE Trans Inf Tech Biomed (2009) 13(1):131–7. doi:10.1109/titb.2008.2007421
9. Amiri M, Jensen R. Missing data imputation using fuzzy-rough methods. Neurocomputing (2016) 205:152–64. doi:10.1016/j.neucom.2016.04.015
11. Hao YW. Research on deep learning based imputation model for clinical time series. Changchun: Jilin University (2019).
12. Ren T, Liu XF, Niu JW, Lei X, Zhang Z. Real-time water level prediction of cascaded channels based on multilayer perception and recurrent neural network. J Hydrol (2020) 585:124783. doi:10.1016/j.jhydrol.2020.124783
13. Jin RJ, Lou DS, Huang HD. Research on cleaning method of condition monitoring data of hydropower units. China Rural Water and Hydropower (2022) 7:187–92. doi:10.1093/bioinformatics/btg287
14. Yan YN, Han CL, Chen XS. Improved data cleaning framework of hydropower telemetry dataset based on time series characteristics. Water Power (2021) 47(11):79–83. doi:10.1186/1471-2105-5-160
15. Zheng XZ, Chen GL, Zou T. Cleaning of abnormal dam monitoring data considering time series association. Water Power (2020) 46(4):111–4. doi:10.3969/j.issn.0559-9342.2020.04.023
16. Wang YH, Huang PN, Li ZJ. Study on applicability of different evaporation data in rainfall runoff simulation. South-to-North Water Transfers Water Sci Tech (2020) 18(3):48–56. doi:10.13476/j.cnki.nsbdqk.2020.0049
17. Tian JH, Chang SY, Huang X. Analysis of water conveyance loss of Beijing-Shijiazhuang emergency water supply section in South-to-North Water Diversion Project. South-to-North Water Transfers Water Sci Tech (2015) 13(2):395–8. doi:10.13476/j.cnki.nsbdqk.2015.02.045
18. Yun ZD, Hu QF, Wang YT, Wu HY, Wang LZ, Shang SW. Accuracy validation of remote sensing and reanalysis evapotranspiration data: A comparative study based on grace and monthly water balance model. J Hydraulic Eng (2022) 54, 117–27. doi:10.13243/j.cnki.slxb.20220391
19. Li JG, Qiao Y, Chen XN. Flow - through equation calibration and curve drawing for Diaohe check gates in middle route project of South-to-North water diversion. Yangtze River (2019) 50(8):224–7. doi:10.16232/j.cnki.1001-4179.2019.08.039
20. Liu MK, Wang CD, Feng XB. Analysis on the hydraulic response of long distance canal control system during ice period. Trans Chin Soc Agric Eng (2011) 27(2):20–7. doi:10.3969/j.issn.1002-6819.2011.02.004
21. Litrico X, Fromion V, Baume JP, Arranja C, Rijo M. Experimental validation of a methodology to control irrigation canals based on Saint-Venant equations. Control Eng Pract (2005) 13(11):1425–37. doi:10.1016/j.conengprac.2004.12.010
22. Mehmed Y. Steady non-uniform flow in open channel[M]. Beijing: Water Resources and Electric Power Press (1987).
23. Wang C, Yang J, Nilsson H. Simulation of water level fluctuations in a hydraulic system using a coupled liquid-gas model. Water (2015) 7(8):4446–76. doi:10.3390/w7084446
24. Yan PR, Zhang Z, Lei XH, Hou Q, Wang H. A multi-objective optimal control model of cascade pumping stations considering both cost and safety. J Clean Prod (2022) 345:131171. doi:10.1016/j.jclepro.2022.131171
25. Feng ZY, Li LQ, Wu YY. The variation of water loss in the main canal of middle route of South-to-North water transfer first stage project. South-to-North Water Transfers Water Sci Tech (2022) 20(3):600–9. doi:10.13476/j.cnki.nsbdqk.2022.0061
Keywords: South-to-North Water Diversion Project, middle route, data cleaning, flow inversion, water balance, the loss of water volume, hydrodynamic model
Citation: Ren H, Tao Y, Wei T, Kang B, Zhang N, Li Y and Lin F (2023) Model and application of inversion data cleaning for flow monitoring stations in the middle route of the South-to-North Water Diversion Project. Front. Phys. 11:1134353. doi: 10.3389/fphy.2023.1134353
Received: 30 December 2022; Accepted: 06 March 2023;
Published: 21 March 2023.
Edited by:
Francisco Vega Reyes, University of Extremadura, SpainReviewed by:
Vijayanandh Raja, Kumaraguru College of Technology, IndiaCopyright © 2023 Ren, Tao, Wei, Kang, Zhang, Li and Lin. This is an open-access article distributed under the terms of the Creative Commons Attribution License (CC BY). The use, distribution or reproduction in other forums is permitted, provided the original author(s) and the copyright owner(s) are credited and that the original publication in this journal is cited, in accordance with accepted academic practice. No use, distribution or reproduction is permitted which does not comply with these terms.
*Correspondence: Fei Lin, bGluZmVpQG1haWwuaGZ1dC5lZHUuY24=
Disclaimer: All claims expressed in this article are solely those of the authors and do not necessarily represent those of their affiliated organizations, or those of the publisher, the editors and the reviewers. Any product that may be evaluated in this article or claim that may be made by its manufacturer is not guaranteed or endorsed by the publisher.
Research integrity at Frontiers
Learn more about the work of our research integrity team to safeguard the quality of each article we publish.