- 1School of Information Engineering, Minzu University of China, Beijing, China
- 2College of Science, Minzu University of China, Beijing, China
To accurately measure the surrounding refractive index (SRI), an all-fiber microstructure multi-parameters optical sensor based on Mach–Zehnder interferometer (MZI) has been designed. A homemade elliptical multilayer-core fiber (EMCF), in which only two modes could be propagated, is used in this sensor. This sensor has a sandwich structure of EMCF-SMF-EMCF (ESE). The sensitivities of RI, temperature, and strain are analyzed practically, and different from each other which would provide a basis for restraining cross-sensitivity of sensor and improving measuring precision. According to the numerical simulation, the relationship between the guided mode and relevant excitation coefficient is shown, and the sensing characteristic of the interference spectrum is well expatiated. Maximum sensitivities of ∼31.83 nm per refractive index unit (RIU), ∼69 pm/°C, and ∼2.06 pm/µε have been experimentally achieved. The monitoring system is promoted by the fact that the resonance dips have their individual sensitivities, and the standard matrix inversion method is used for simultaneous three parameters determination. Consequently, this fiber sensor could ensure the completion of accurate SRI measurements with temperature and strain decoupled.
1 Introduction
The reliable and compact fiber sensors are significantly indispensable in many fields due to their unique characteristics, such as extremely high sensitivity and precision, stable electric insulation, chemical stability, resistance to electromagnetic interference, distributed measurement, and durability. Therefore, the fiber sensor has drawn a great deal of attention in various fields, such as the securities and protection monitoring [1, 2], biomedical instruments [3, 4], the construction industry [4, 5], aerospace [6, 7], etc. Apart from the above, the fiber sensor has the potential research values in measuring the surrounding refractive index (SRI). Compared with the conventional refractometer, which is mostly based on electrical and mechanical technologies [8], the fiber-optic SRI sensor has the advantages of compact size, anti-electromagnetic interference, high voltage, and corrosion resistance. However, due to the higher order modes guided in fibers, a stable clean interference spectrum would be hardly obtained. In addition, due to the temperature and axial micro-strain cross-sensitivity, the fiber-based refractometer could hardly achieve high-accuracy survey as well.
To attain a stable clean interference spectrum, the number of guided modes in the fiber must be limited, and the energy occupation of each mode should be roughly the same [9]. To restrict the number of interference modes, some solutions like using few modes fiber (FMF) have been demonstrated, such as temperature and strain sensors using an elliptical central silica core [10], gas concentration measurement based on the dual-mode Fiber Bragg Grating (FBG) structure [11], dual-parameter active fiber sensor based on a fiber ring laser [12], liquid-core optical fiber [13], and et al. A novel SRI sensor based on a specially designed polyimide coated dual-mode fiber (DMF) is presented by Lei [14]. The structure of this fiber is fabricated with an inner core, three inner claddings, and a pure silica outer cladding, which only permits the fundamental mode,
This sensor has the advantage of a stable structure and is relatively easy to be fabricated. Furthermore, it could simultaneously measure SRI, temperature, and axial micro-strain. The transmission dips have their individual sensitivities. Thus, the temperature could be compensated, and axial micro-strain error could be corrected, which leads to an improvement in SRI measurement. In addition, by utilization of the EMCF, the higher order modes are suppressed, and it could only support the
2 Design and principles of operation
2.1 Structure of the EMCF
This homemade strict dual-mode EMCF could be obtained with conventional modified chemical vapor deposition (MCVD) and solution-doping techniques. It is composed of an elliptical core area and conventional cladding. Figure 1A illustrates the cross-section micrograph of the elliptical core area, while the cross-section microstructure of the EMCF is shown in Figure 1D. It could be found from Figures 1A, D that the elliptical core area consists of a central elliptical core and three inner elliptical layers. The elliptical core area has a slow/fast axis with a length of 22.64/18.05 μm, and the diameter of the fiber is 125 μm. This special structure guarantees the feasibility of the strict dual-mode operation, which will be described in more detail later.
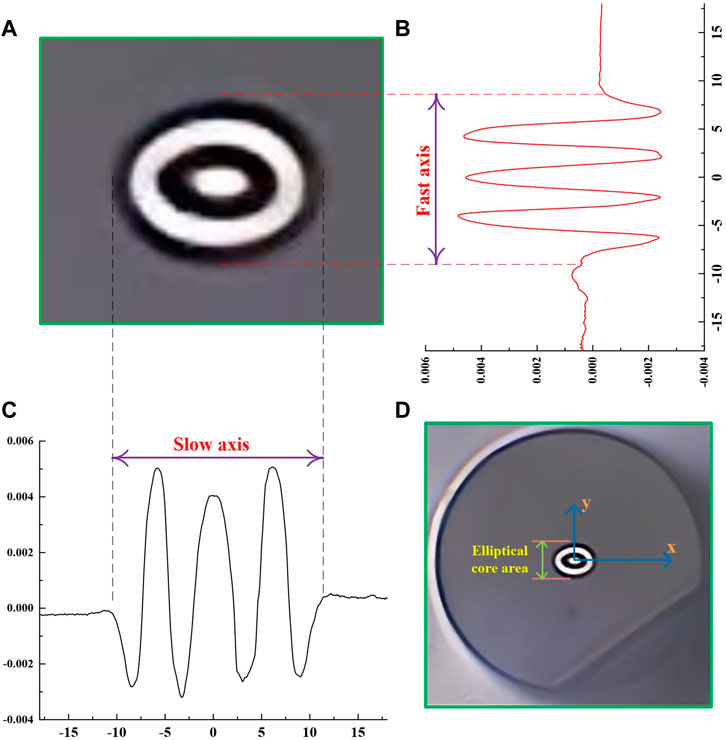
FIGURE 1. Schematic diagrams of (A) the cross-section micrograph of the elliptical core area; (B), (C) the index profile along the fast/slow axis; and (D) the cross-section microstructure of the EMCF.
Figures 1B, C depict the distribution of the refractive index (RI), which is gained by an optical fiber analyzer (EXFO NR9200). This alternating low and high refractive index in the elliptical ring structure is acquired by doping with fluorine and germanium. The EMCF has a conventional cladding, the gray part, whose RI is 1.444. The highest RI of the slow/fast axis could achieve about 1.449/1.4485, while the lowest part could be approximately 1.4408/1.4415. The RI distribution is non-uniform and not strictly axisymmetric, which might have some influence on the mode distribution [20].
2.2 Configuration of the sensor and transmission principle
A fiber sensor, an in-fiber MZI based on ESE, has been utilized, and schematically plotted in Figure 2A and widely detailed in Figure 2C. It has a symmetrical ESE structure in that two same EMCFs are spliced to each end of a central SMF (Corning SMF-28). Then, two segments of SMF are stitched to the opposite ends of the ESE, playing the role of input and output SMF, respectively. Each segment is combined by the fiber fusion splicer (Fujikura, FSM-100M/P). As depicted in Figure 2B, the ESE is 48 mm long, which is 10 mm less than the total length of the sensor. This compact size enables this sensor to have a great potential for development and application in the field of micro-sensing. In more detail, the EMCF and central SMF lengths are 5 mm and 38 mm, respectively. This geometrical size is specially designed for an ideal coupling ratio of the propagating modes, which would be discussed in detail later.
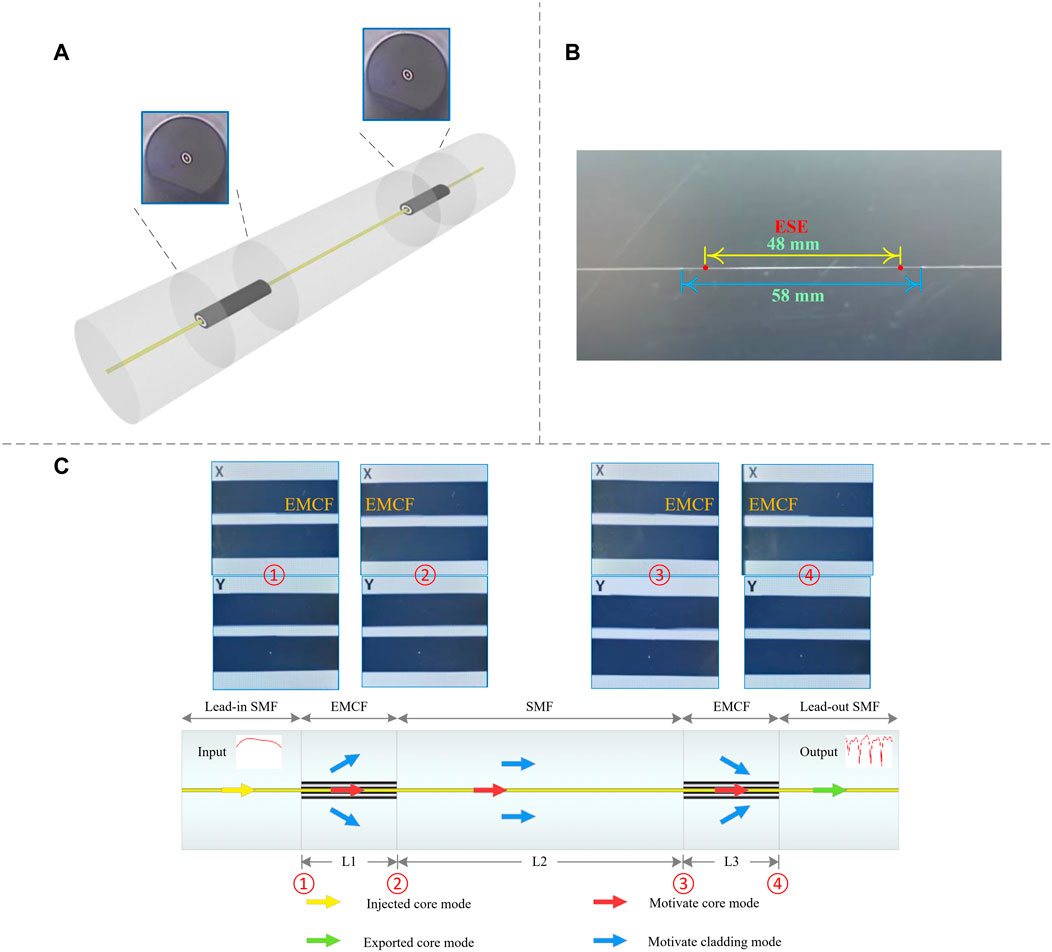
FIGURE 2. Details of the proposed sensor, (A) the three-dimensional structure; (B) the close view and geometrical sizes; (C) the representation and operation.
Figure 2C shows the basic sensing principle of the sensor. A Gaussian beam is injected into the lead-in SMF, playing the role of the light source. Before reaching the central SMF, whose core and cladding act as the two arms of MZI, the fundamental modes (
As mentioned above, the largest RI difference in the core area is only 0.0082, which satisfies the weakly guiding approximation [23]. By accumulating all the excited modes, which could be described as normalized and orthogonal wave functions, the total optical field distribution
Where N is the number of excited modes in the EMCF.
Where
Figure 3A describes the curves of different effective refractive index
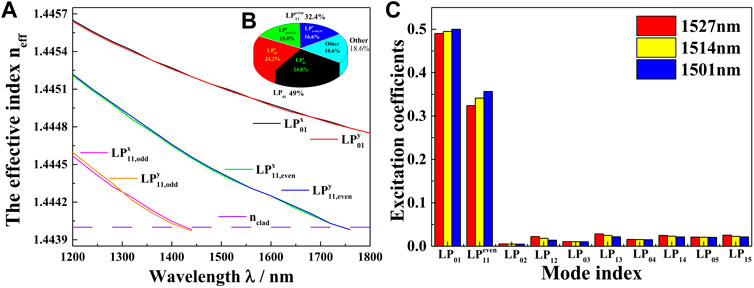
FIGURE 3. The guided-mode propagation analysis in EMCF, (A) the curves of
According to the definition of the half beat length
Where the propagation constants of
According to the definition of the normalized constant
Where
Figure 4 shows the transmission spectrum and the free spectral range (FSR). As depicted, the interference spectrum is clean and stable. Since the two dominant mode groups have a close excitation coefficient, this phenomenon could be explained by the distinct dual-mode interference process. Therefore, regardless of other modes, the FSR could be described as [25].
Where
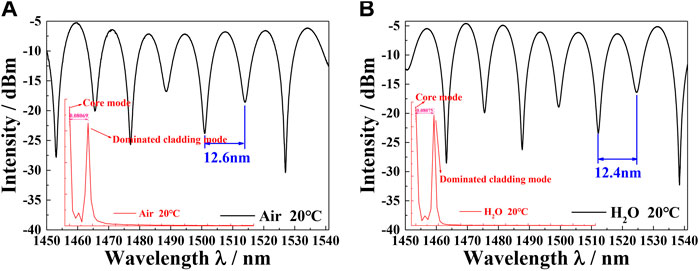
FIGURE 4. Interference-pattern analysis: the measured transmission spectrum and corresponding spatial frequency of the EMCF-based MZI in (A) air/ (B) water.
2.3 Sensing principle
According to the optical waveguides theory [20], compared with
Where
Where
When axial micro-strain serves as the only source of interference, the change of
Where
Overlooking the affect by axial micro-strain and SRI, the change of
Where
When only SRI is considered,
Where
Where
In addition, the sensitivity of each dip is different due to higher modes, which would be demonstrated with emulation and experiment results. To sum up,
The essential condition to facilitate discrimination among these three parameters is differences in drift-sensitivity and drift-direction for environment variables. This phenomenon is caused by the higher order modes and has been analyzed in Figure 5. Based on the waveguide property, different
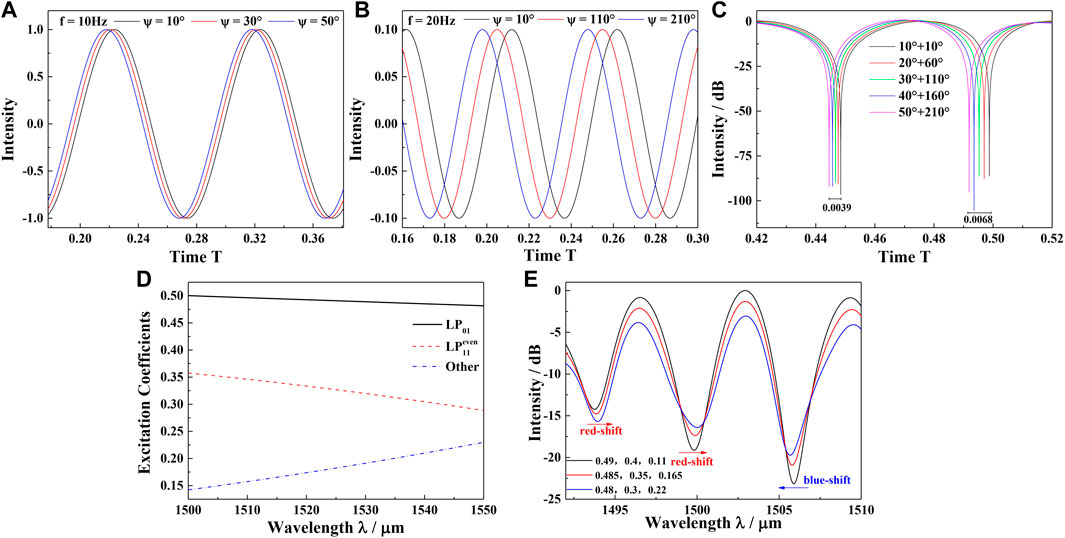
FIGURE 5. The mechanism analysis of the spectra shift, (A), (B), (C) the different sensitivities of the dips as the variation of the
3 Experimental methods and discussion
As mentioned above, a precision refractometer with temperature and strain compensated simultaneously could be accomplished with the structure of ESE. For this purpose, this sensor has been tested under different environments with one variable controlled.
Figure 6A presents the experimental architecture for temperature measurement. The sensor is secured with two fiber clips to prevent transverse bending. The micro-adjusters are applied to obviate the disturbance of the axial micro-strain. All the devices are placed in a temperature control box (WEISS, WT1-180). A broadband source (KOHERAS, superK uersa) serves as a light source. The S + C band range is provided for the sensing system, which is used for conventional communication. As a result, this refractometer could have potential application in remote sensing system. The optical spectrum analyzer (OSA) is used for detecting the interference spectrum. The experimental transmission spectra showing a wavelength red shift corresponding to the temperature of 0°C–80°C, are presented in Figure 7A. The temperature range is divided into nine values (0, 10, 20, 30, 40, 50, 60, 70, 80°C). With the increase of the ambient temperature, the resonant wavelength increases by 4.625 nm on average. A linear relationship between the temperature and resonance wavelength is shown in Figure 7D. The line slopes represent the different drift-sensitivities, which are about ∼69.02 pm/°C, ∼59.03 pm/°C, and ∼45.45 pm/°C, respectively. The average correlation coefficient of polynomial fitting, R2, is above 0.998, demonstrating very accurate linearity.
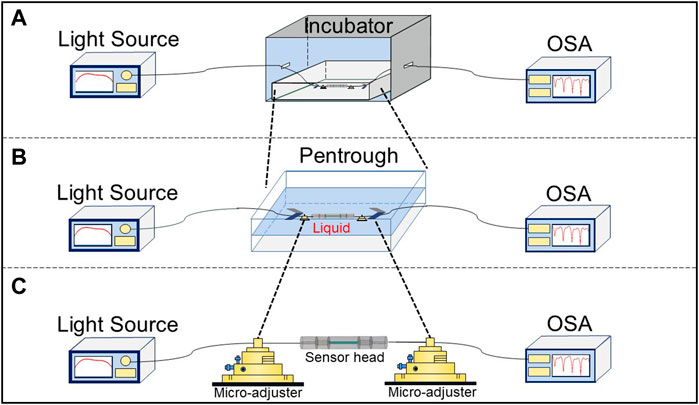
FIGURE 6. The schematic diagram of experimental setup for (A) temperature, (B) SRI, and (C) strain measurement.
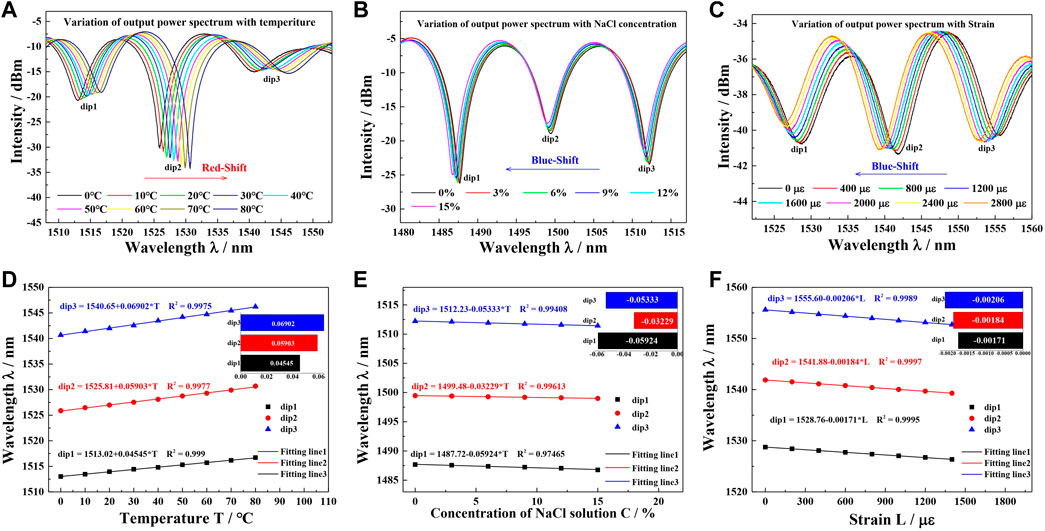
FIGURE 7. The tri-parameter monitoring results, (A), (B), (C) experimental transmission spectra under different RI/temperature/strain of surrounding areas; (D), (E), (F) the fitted line of dips wavelength shifts with different RI/temperature/strain.
Figure 6B shows the SRI experiment, in which this sensor is submerged in NaCl solutions of 0%–15% at 20.0°C with zero strain. The SRI increases in line from 1.3330 to 1.3609 with the concentration of NaCl increasing, which is measured by an Abbe refractometer. The measuring approach is referenced to [28]. In contrast with temperature sensing, the dip wavelength shows a blue shift as depicted in Figure 7B. The accurate linear relationship between SRI and the resonance dips with an average R2 over 0.988 is shown in Figure 7E. The sensitivities of SRI for each dip are ∼28.66 nm/RIU, ∼17.35 nm/RIU, and ∼31.83 nm/RIU, respectively.
Figure 6C illustrates the experiment of measuring axial micro-strain at room temperature. In it, the sensor could be elongated by the micro-adjuster. The axial strain experiment, Figure 7C, is carried out by elongating the ESE structure at a step of 10 µm, corresponding to 208 µε. Similarly, it shows a blue shift. The linear relationship between the axial micro-strain and the resonance dips with an average
To sum up, the linearity of this refractometer is very accurate. In both the simulation and experiment, the resonance dips have their individual sensitivities. In addition, in the experiments, the dips’ drift direction is depended on the
The standard matrix inversion method could be used for simultaneous determination of axial micro-strain, temperature, and SRI, when taking
Where
4 Conclusion
In conclusion, a precision fiber refractometer with temperature and axial micro-strain compensation has been demonstrated. Based on the strict dual-mode EMCF, the in-fiber MZI could obtain a stable clean interference spectrum. This high-quality spectrum is a guarantee for multi-parameter sensing. The FFT analysis of the interference spectrum demonstrates that almost only foundation modes and
Data availability statement
The raw data supporting the conclusion of this article will be made available by the authors, without undue reservation.
Author contributions
XL: optical experiment, XL and BZ: guidance and revision.
Funding
The authors would like to thank the financial support by the National Natural Science Foundation of China (Grant No. 61905293), the Fundamental Research Funds for the Central University (Grant Nos. 2022QNYL32, 2022QNPY78), the Foundation of Key Laboratory of All Optical Network and Advanced Telecommunication Network, Ministry of Education, China (Beijing Jiaotong University) (Grant No. AON2022001).
Conflict of interest
The authors declare that the research was conducted in the absence of any commercial or financial relationships that could be construed as a potential conflict of interest.
Publisher’s note
All claims expressed in this article are solely those of the authors and do not necessarily represent those of their affiliated organizations, or those of the publisher, the editors and the reviewers. Any product that may be evaluated in this article, or claim that may be made by its manufacturer, is not guaranteed or endorsed by the publisher.
References
1. Peng Z, Peng Z, Jian J, Wen H, Gribok A, Wang M, et al. Distributed fiber sensor and machine learning data analytics for pipeline protection against extrinsic intrusions and intrinsic corrosions. Opt Express (2020) 28:27277–92. doi:10.1364/OE.397509
2. Li J, Zhang J, Sun H, Hong D, Li L, Yang Y, et al. An optical fiber relative humidity sensor based on hollow-core fiber and hydroxypropyl methylcellulose hydrogel film. Optik (2019) 195:163172. doi:10.1016/j.ijleo.2019.163172
3. Shang Z, Li S, Li B, Wu H, Sampaolo A, Patimisco P, et al. Quartz-enhanced photoacoustic NH3 sensor exploiting a large-prong-spacing quartz tuning fork and an optical fiber amplifier for biomedical applications. Photoacoustics (2022) 26(2022):100363100363–5979. doi:10.1016/j.pacs.2022.100363,ISSN
4. Alwis LSM, Bremer K, Roth B. Fiber optic sensors embedded in textile-reinforced concrete for smart structural health monitoring: A review. Sensors (2021) 21:4948. doi:10.3390/s21154948
5. Chan S, William Y, Wang H-P, Xiang P. Optical fiber sensors for monitoring railway infrastructures: A review towards smart concept. Symmetry (2021) 13(12):2251. doi:10.3390/sym13122251
6. Rocha H, Semprimoschnig C, Nunes JP. Sensors for process and structural health monitoring of aerospace composites: A review. Eng Struct (2021) 237:112231. doi:10.1016/j.engstruct.2021.112231
7. Goossens S, Berghmans F, Sharif Khodaei Z, Lambinet F, Karachalios E, Saenz-Castillo D, et al. Practicalities of BVID detection on aerospace-grade CFRP materials with optical fibre sensors. Compos Struct (2021) 259:113243. doi:10.1016/j.compstruct.2020.113243
8. Yang H, Shin S, Kumar S, Seo D, Oh S, Lee M, et al. A CMOS image sensor based refractometer without spectrometry. Sensors (2022) 22(3):1209. doi:10.3390/s22031209
9. Born M, Wolf E. Principles of optics: Electromagnetic theory of propagation, interference and diffraction of light. Great Britain: Elsevier (2013).
10. Abbas LG, Ai Z, Mumtaz F, Muhammad A, Dai Y, Parveen R. Temperature and strain sensing with hybrid interferometer. IEEE Sens J (2021) 21:26785–92. doi:10.1109/JSEN.2021.3120798
11. Rani S, Haider S, Bukhari SHR, Zaidi SAA, Huda AB. Performance optimization of apodized FBG biomedical sensor for variation in temperature and presence of noise. IEEJ Trans Electr Electron Eng (2022) 17:847–55. doi:10.1002/tee.23573
12. Wan H, Zhang J, Chen Q, Wang Z, Zhang Z. An active fiber sensor based on modal interference in few-mode fibers for dual-parameter detection. Opt Commun (2021) 481:126498. doi:10.1016/j.optcom.2020.126498
13. Liu Q, Ma Z, Wu Q, Wang W. The biochemical sensor based on liquid-core photonic crystal fiber filled with gold, silver and aluminum. Opt Laser Technol (2020) 130:106363. doi:10.1016/j.optlastec.2020.106363
14. Lei X, Dong X, Lu C. Sensitive humidity sensor based on a special dual-mode fiber. IEEE Sens J (2019) 19:2587–91. doi:10.1109/JSEN.2018.2889799
15. Ouyang Y, Xu X, Zhao Y, Zhou A, Yuan L. Temperature compensated refractometer based on parallel fiber fabry–pérot interferometers. IEEE Photon Technol Lett (2018) 30:1262–5. doi:10.1109/LPT.2018.2844543
16. Kong L-X, Zhang Y-X, Zhang W-G, Li Z, Zhang Y-S, Yan T-Y, et al. Temperature-independent micro-refractometer based on cascaded in-fiber air cavities with strain-error correction. IEEE Sens J (2018) 18:8773–80. doi:10.1109/JSEN.2018.2868739
17. Harris J, Lu P, Larocque H, Xu Y, Chen L, Bao X. Highly sensitive in-fiber interferometric refractometer with temperature and axial strain compensation. Opt Express (2013) 21:9996. doi:10.1364/OE.21.009996
18. Geisler T, Pedersen ME, Herstrøm S. Measurement of spatial and polarization birefringence in two-mode elliptical core fibers. In: Optical Fiber Communication Conference; 17-21 March 2013; Anaheim, CA, USA. Optica Publishing Group (2013). OW1K. 3.
19. Kim YH, Song KY. Mapping of intermodal beat length distribution in an elliptical-core two-mode fiber based on Brillouin dynamic grating. Opt Express (2014) 22:17292. doi:10.1364/OE.22.017292
20. Kasap SO. Optoelectronics and photonics: Principles and practices. 2nd ed. Boston: Pearson (2013).
21. Li H, Li H, Meng F, Lou X, Zhu L. All-fiber MZI sensor based on seven-core fiber and fiber ball symmetrical structure. Opt Lasers Eng (2019) 112:1–6. doi:10.1016/j.optlaseng.2018.08.021
22. Liang X, Liu S, Li Y, Liu Z, Jian S. Characteristics of a high extinction ratio comb-filter based on LP01–LP11even mode elliptical multilayer-core fibers. Opt Fiber Technol (2015) 21:103–9. doi:10.1016/j.yofte.2014.09.005
24. Li H, Ren G, Atakaramians S, Kuhlmey BT, Jian S. Linearly polarized single TM mode terahertz waveguide. Opt Lett (2016) 41:4004. doi:10.1364/OL.41.004004
25. Liang X, Ning T, Li J, Li Y, Liu Z. Axial micro-strain sensor based on resonance demodulation Technology via dual-mode CMECF. Photonic Sens (2019) 9:78–88. doi:10.1007/s13320-018-0513-x
26. Zuo B-Z, Liang X, Zhang X-R, Yin T-H. Detection of refractive index with a temperature-compensated MZI-based optical sensor using few-mode fiber. IEEE Access (2021) 9:158651–9. doi:10.1109/ACCESS.2021.3130371
Keywords: strict dual-mode fiber, fiber sensor, mulit-parameters, axial micro-strain, in-fiber MZI
Citation: Liang X and Zuo B (2023) A precision refractometer using strict dual-mode elliptical multilayer-core fibers with temperature and strain decoupled. Front. Phys. 11:1127505. doi: 10.3389/fphy.2023.1127505
Received: 19 December 2022; Accepted: 30 January 2023;
Published: 21 February 2023.
Edited by:
Tonglei Cheng, Northeastern University, ChinaReviewed by:
Yue Wu, Beijing Information Science and Technology University, ChinaMuguang Wang, Beijing Jiaotong University, China
Zhongwei Tan, Beijing Jiaotong University, China
Copyright © 2023 Liang and Zuo. This is an open-access article distributed under the terms of the Creative Commons Attribution License (CC BY). The use, distribution or reproduction in other forums is permitted, provided the original author(s) and the copyright owner(s) are credited and that the original publication in this journal is cited, in accordance with accepted academic practice. No use, distribution or reproduction is permitted which does not comply with these terms.
*Correspondence: Xiao Liang, eGlhb2xpYW5nQG11Yy5lZHUuY24=
 Xiao Liang
 Binzhou Zuo2