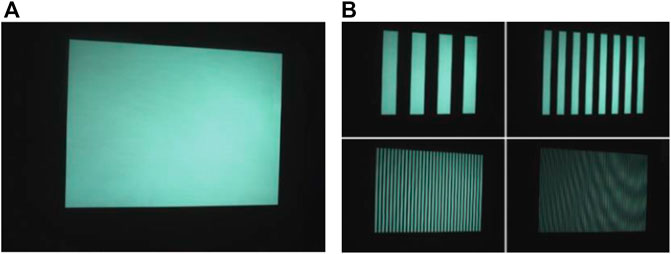
- Harbin University of Science and Technology, Harbin, Heilongjiang, China
Coded structured light plays a crucial role in the field of non-contact three-dimensional measurement. To improve the accuracy, we propose a novel method based on shortest path search and edge and central singular operator, which is able to detect the edge of Gray code and locate its line shift fringes more accurately. Starting from the patterns of the Gray code edge and the center of the line shift strip, we develop the corresponding singular operators and hence the cost function. The Euler distance is used as the distance condition for the adjacent key points, which are located by the fast-marching algorithm. We propose a method to compute the graph with minimum energy by finding the shortest path. The shortest path was automatically calculated and found both the edge of the Gray code and the center of the bar stripe accurately.
1 Introduction
The rapid development of machine vision has had a great influence on the development of modern industry. One of the most important tasks of intelligent image processing is to increase the accuracy of three-dimensional (3D) measurement. 3D measurement based on structured projection light is one of the most important technologies in machine vision. It is widely used in robot assembly, visual inspection, medical treatment and other fields because it is easy to use, non-contact, non-destructive and efficient. The 3D measurement method of coded structured light is widely accepted by researchers because of its large field of view, high efficiency. The common 3D measurement methods with coded structured light consist of the phase shift code and the Gray code, which is combined with line shift fringe coding. However, when the structured light is encoded by a Grayscale code or a line-shift stripe, the edge of the Grayscale code and the center of the line-shift stripe are susceptible to deformation due to the varying surface shape, texture, and other factors of the object.
Edge detection is a popular topic in the image processing community. At the pixel level, the Sobel operator and the Prewitt operator [1] can be used to eliminate the deviation of individual points from the straight template of the Roberts operator [2]; Marr.H [3] proposed the Log operator based on the Laplacian operator. The Canny operator [4] can be used to detect and extract blurry edges associated with sharp edges. At the subpixel level, researchers have proposed many basic and advanced versions of subpixel edge detection methods around interpolation and matching methods [5–7]. Jason [8] has achieved the positioning of the step edges of a given continuous space. Sui Liansheng [9] proposed the NURBS matching method to detect and locate the edge of the light strip. The Gray level moment method is an earlier moment method. In the literature [10], the suppression of pseudo edges is achieved by analyzing the influence of parameters on the positioning result during the detection process. Lyvers [11] proposed a subpixel edge detection method based on spatial moments. Zhu Hong [12] uses Zernike moment method on pixel-level edges obtained by classical operators and obtains a new recognition method. Li Jie [13] uses structural elements for image shape recognition and complete edge detection in images. There are also neural network techniques [14], Gray theory of image edge detection [15], diffuse edge detection method [16], and so on.
Despite continuous improvements, the pixel-level light streak detection method still struggles with shortcomings, such as susceptibility to noise and heavy dependence on a specific image requirement. We propose a method for detecting the edges of Gray stripes based on the techniques of singular operator and shortest path search in order to increase the positioning accuracy of the light strip edge.
2 Construction and calibration of experimental system platform
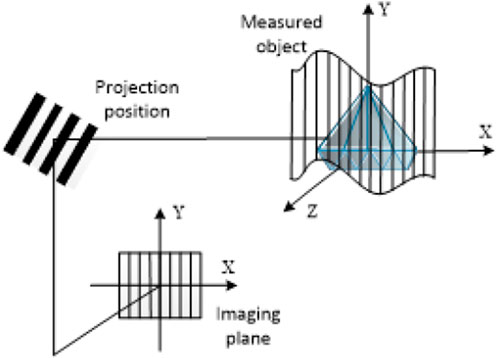
The 3D measurement system used in this work consists of three parts: Projection module, image acquisition module and image processing module.
The images encoded by the Gray scale code and the line shift strip are projected onto the surface of the object in chronological order by the projection module, and the surface image information of the measured object is acquired by the image acquisition module and transferred to the image processing module for post-processing and calculation to obtain the spatial coordinates of the sampling point of the surface of the measured object to realize 3D measurement. As is shown in Figure 1.
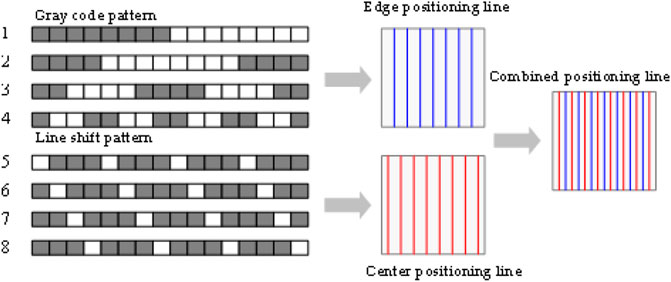
The principle of encoding and decoding is shown in Figure 2. In encoding, Gray code and line-shift strip do not interfere with each other. In decoding, the four-step line-shift strip is in a whole period of Gray code, which theoretically avoids the interference of position.
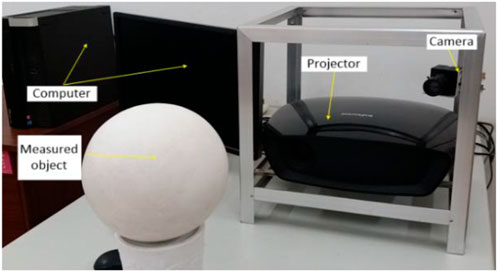
The experimental system is as follows: the camera and the projector are connected to the computer through serial ports; the encoded image is sequentially projected on the surface of the object to be measured, where the ball in the image is the object to be measured; the encoded image captured by the camera is decoded by the computer; the hardware configuration of the system consists of three major functional modules: the projection module is an InFocus 82 projector (resolution 1024 pixels × 768 pixels); the image capture module is a AT-200GE industrial camera (resolution 1624 × 1236); the image processing and computation module is the Dell Precision T7910. The real picture is shown in Figure 3.
3 Research on edge and centroid detection method based on shortest path search technology of singular operator
3.1 Principle of shortest path technology
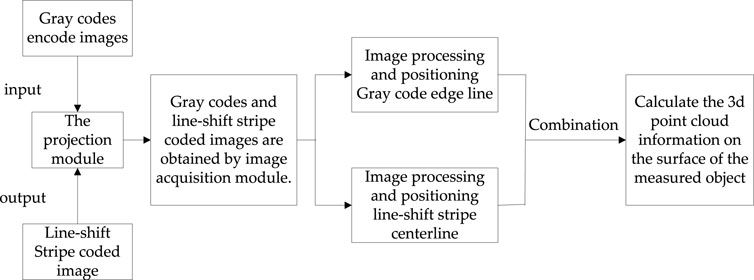
As there is a phenomenon that the light stripes from the projector spread light fringes to dark stripes. Therefore, in this work, we use singular operators to improve the signal characteristics of the edge or the center, and the shortest path search technology is used to locate the sampling points of the edge or the center with high precision. The specific process is shown in figure 4:
Curve evolution theory is very effective in the field of image segmentation and feature extraction. Cohen [17] proposes a global minimum energy method for geometric active contours. Instead of specifying the initial path, this method only requires the key points on the path in advance and then determines the minimum energy curve between the two key points by solving the functional equation.
From the above, a brief summary of the procedure for finding the shortest path in the detection of Gray scale edges and the center of line shift fringes is given: The cost function is introduced by using the difference between the feature of the edge line or the center line and that of other positions in the image, so that the cost function at the edge or center line to be extracted is different from other values. Starting from the initial point, we solve the equation of the equation and obtain the minimum energy map. Finally, starting from the desired key points, the starting point can be obtained by searching along the direction in which the minimum energy decrease and the fastest change cannot be obtained, and the corresponding curve of the shortest path can be obtained.
3.2 Construction of shortest path cost function based on singular operators
Figure 5A is a standard gray code image. Projecting it onto the surface of the object to be measured, we get the image shown in Figure 5B.
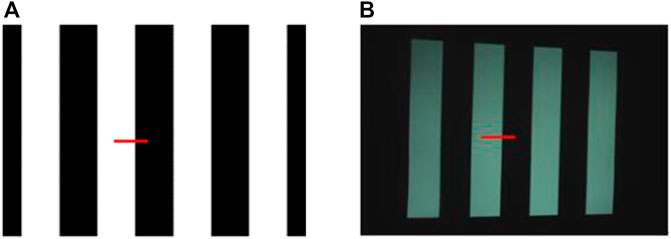
FIGURE 5. The standard image of Gray code and image projection. (A) Standard Gray code; and (B) Projection image of plane.
In Figure 5A, the grayscale image at the striped edge of the scribed position Figures 6A, B, by comparing the change curve of the gray level and the gray gradient within the measurement range, it can be seen that the striped edge of the standard grayscale code has a good step property. The same treatment was performed for Figure 5B to obtain the curves in Figures 6C, D. It can be seen that the edge of the gray code stripe in the projected image corresponds to a smooth step curve.
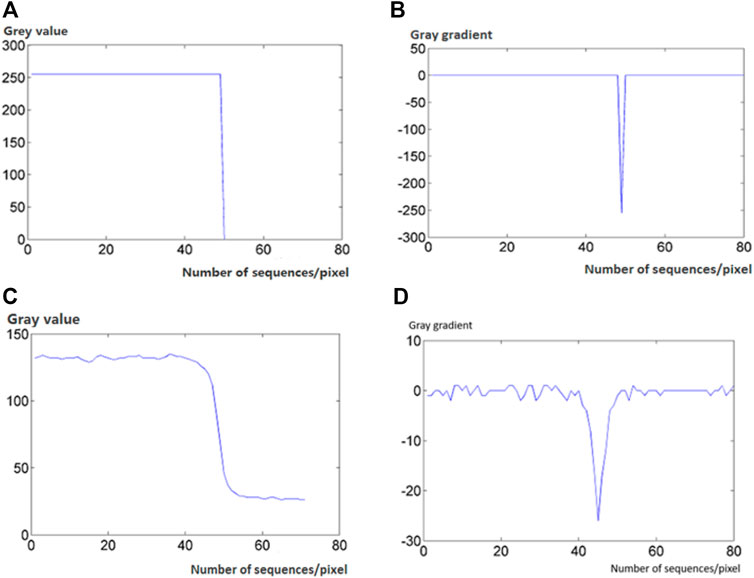
FIGURE 6. Grey value and grey gradient curve of fringe edge. (A) Grey value of standard Gray code; (B) Grey gradient of standard Gray code; (C) Grey value of projection plane with Gray code; and (D) Grey gradient of projection plane with Gray code.
According to the properties of the Gray level distribution of the Gray level edge in the coded image, the singularity operator of the Gray level edge is constructed as shown in Eq. 1:
In the formula, a is the factor of the scale constant and the Gaussian kernel scale.
According to above, at the edge of the Gray code, the first derivative of the image reaches a local maximum and the second derivative goes to zero, giving a large value to singular operator; the singular operator has a solid response to the step signal and the smooth step curve and can suppress impulse signals and other noises in Gray code images, which is very suitable for stripe edge extraction.
In summary, the cost function for the shortest path of the singular Gray code edge detection operator is constructed as shown in Eq. 2:
In the formula,
3.3 Research on shortest path extraction method
3.3.1 Key point detection
Given image I, image domain
It is known that the initial wavefront is a circle, and the center of the circle is
1) To find the map with minimum energy, we set the iterative step size to t and solve the equation function U using the fast-marching algorithm. Then the technique of finding the shortest path in the reverse direction from the request point is applied and the map with the minimum energy of the initial point is obtained;
2) The energy integral E of each path is calculated using Eq. 1. The algorithm for the shortest path requires the minimum energy integral E, the corresponding boundary point is the key candidate
3) Calculate the Euler distance of the path between
In the formula: n is the number of points through which the path passes.
3.3.2 Path tracking detection
After finding the key point
The following steps are used to iteratively detect key points on the path curve:
1) The updated key point set is S, all of them are set as source points after updating. We use the fast-marching algorithm to find the minimum energy graph, calculate for each key point the shortest path integral energy E between it and the edge point of the surrounding minimum energy graph, and determine the next candidate key point in the edge point;
2) The Euler distance constraint is used to determine the candidate key points which exceed the threshold T and upgrade to the new key point
3) Update the key point set and the path set, which are:
4) The key point
5) If the stop condition is not met, loops a) to d), the final set of key points and the final set of paths are obtained by iteration.
3.3.3 Stop condition
The next key point in the path is identified during each loop of the path tracing, and we need to compare their Euler distance with the default threshold T. This comparison criterion makes the Euler distances between adjacent key points in the extracted shortest path approximately equal, this feature in the shortest path can be used to determine the endpoint of the path tracing.
We give two known adjacent key points p and q,
Since noise can easily interfere with path tracing, here is the allowable error, Eq. 5 can be changed to the standard for monitoring the stopping of path tracing, as shown in Eq. 6:
If the candidate key points do not satisfy Eq. 6, end the pursuit the path tracing.
4 Experiments and results
4.1 Contrast experiment with classical edge detection operator
We compare the edge detection method proposed in this article with various classical edge detection operators, and choose as the object of study the edge of the stripe in the projected Gray code plane. As shown in Figure 7, several classical operator methods for edge detection perform the detection of the stripe edge on the image shown in Figure 7A.
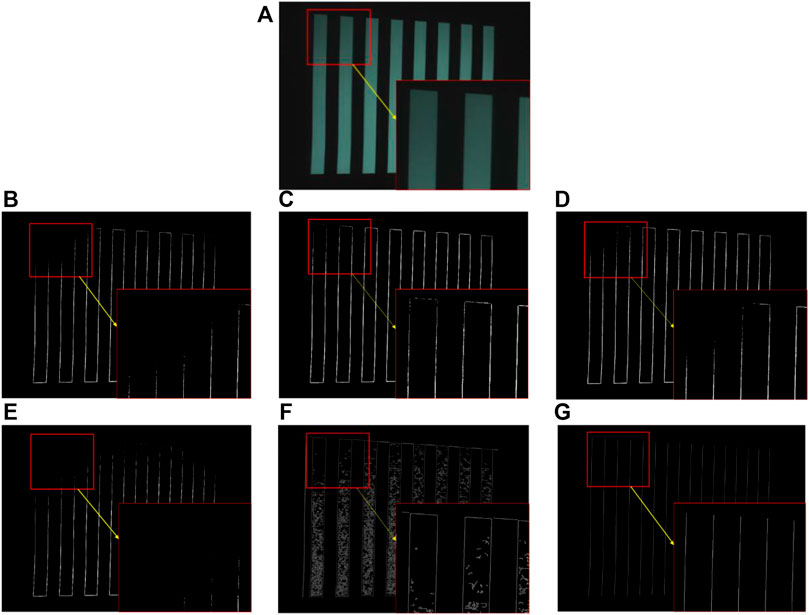
FIGURE 7. Edge detection image. (A) Gray projection plane; (B) Edge image of Sobel operator; (C) Edge image of Robers operator; (D) Edge image of Prewitt operator; (E) Edge image of Laplacian operator; (F) Edge image of Canny operator; and (G) The method we propose.
Figure 7G illustrates the detection results at the pixel level. The comparison shows that in the real measurement scenario, the upper left corner of the image shown in Figure 7A is darker than the other parts. The Sobel operator, the Prewitt operator, and the Laplacian operator cannot perform Gray code edge detection in this case, and the edge detected by the Roberts operator suffers from disconnection; noise in the edge images detected by the Canny operator is an obstacle. In the edge line image obtained by the method presented here, the edge line shown is the edge image drawn by matching the sub-pixel edge line with the pixels with the shortest distance. In the darker part of the image, the position of the Gray code edge can still be accurately located, and no discontinuity is observed.
4.2 Contrast experiment of central detection
Figure 8 shows that the results of the detection and localization of the strip center based on the local Gray centroid method [18] and the shortest path search technology based on the singular operator are evaluated and compared when the center line-shift strip in the 3D measurement is 4 pixels wide.
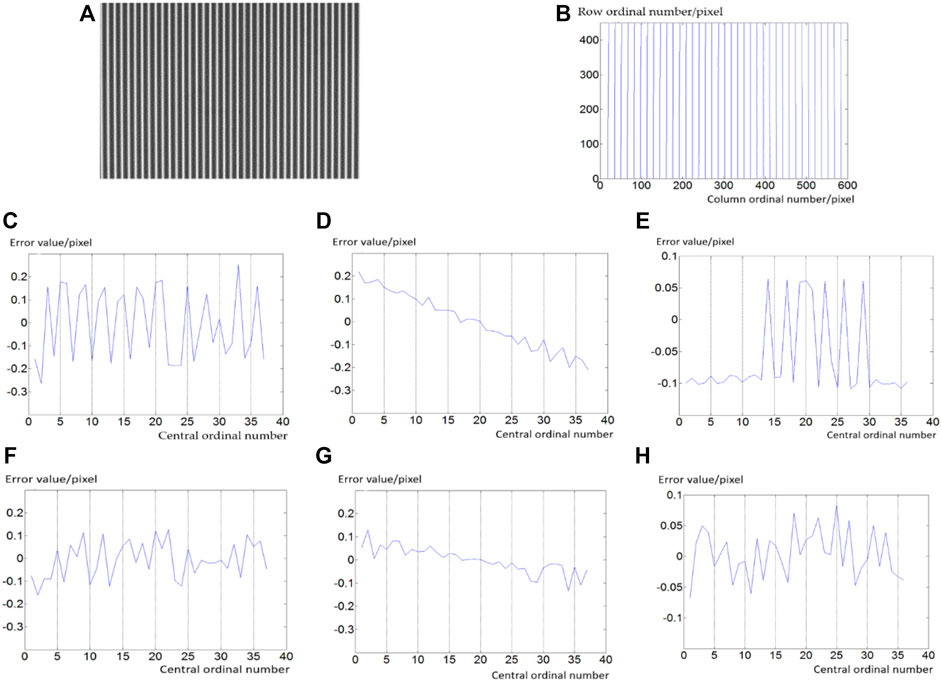
FIGURE 8. Line-shift stripe center detection. (A) Stripe image; (B) The fitting center line; (C) Gray Gravity method straightness; (D) Straightness with this article method; (E) Gray Gravity method parallelism; (F) Parallelism with this article method; (G) Gray Gravity method equidistance; and (H) Equidistance with this article method.
Table 1 tabulates the data of the positioning error in detecting the center of a strip with a width of 4 pixels. The method described in this article reduces the comprehensive error in detecting the center of the stripe by the Gray barycenter method from 0.305 pixels to 0.145 pixels. Comparing the comprehensive detection and positioning errors between the two methods, the center detection position is more accurate in this article method.
4.3 Plane measurement experiments and error analysis
The shortest path search technique based on the singular operator is used to detect the edge of the Gray code and the center of the line shift fringes in the three-dimensional measurement of structured light, and realize the three-dimensional measurement of the measured object. Figure 9 is the measured plane using Cartesian coordinates, and the position of the measured plane is Z = 0. Figure 9A is the measured plane, Figure 9B is the coding diagram of the projected Gray code and line shift fringe on the measured plane.
Table 2 shows the measurement data of the plane. The first method in the table is the detection of the three-dimensional measurement plane by combining the edge detection of the intersection method and the centre detection of the gray centroid method, and the second is our proposed method. The mean plane error of the five positions measured by the second method is 0.152 mm, which is smaller than the 0.279 mm measured by the first method. The mean square plane error of the five positions measured by the second method is 0.201 mm, which is smaller than the 0.322 mm measured by the first method. The results show that our proposed method is superior in terms of accuracy.
4.4 Spherical measurement experiments
Figure 10A is the measured spherical image, Figure 10B is the encoding diagram of the Gray code and the line-shift strip of the measured spherical projection.
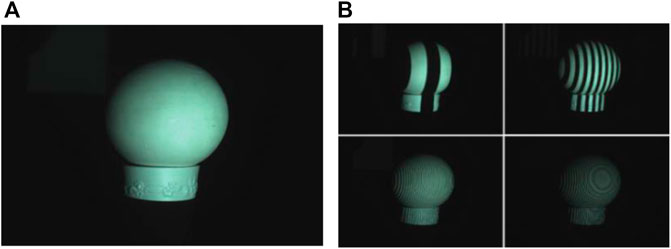
FIGURE 10. The measured sphere and its coding diagram. (A) Measured sphere; and (B) Encoding pattern.
Figure 11A shows the reconstruction of the spherical surface by combining the edge detection of the intersection method with the center detection of the gray centroid method, Figure 11B shows the results using the edge and center detection method of the singular operator based shortest path search technology.
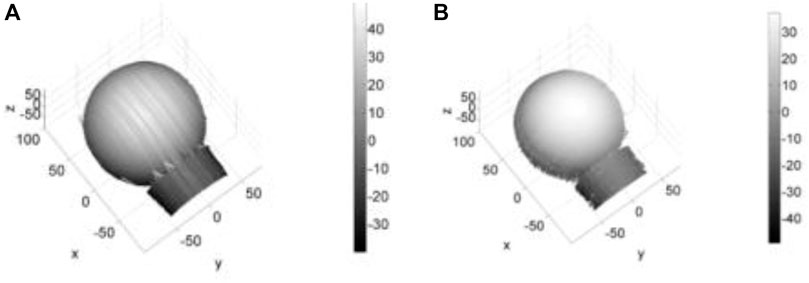
FIGURE 11. Spherical Reconstructed Image. (A) The method of combining Intersection method and Gray Gravity method; and (B) This article method.
In Figure 11A, due to inaccurate edge or center positioning, there are many perturbations for some positions in the reconstructed object, while there are few points for adjacent positions. This leads to errors in point positioning during decoding and also to streaky protrusions or depressions in the graph. Therefore, the proposed method is more accurate in positioning and striped protrusions or depressions can be reduced or even eliminated.
5 Discussion
In this article, we propose the singular operators and cost functions based on a thorough review of the signal properties of the Gray code edge and the center of the line-shift strips, and then use the Euler distance as a constraint on the neighboring key points computed by the fast-marching algorithm, integrated with the computation of the minimum energy map in the shortest path search technology. The experiments show that the shortest path search method based on the singular operator for the edge and the singular operator for the center proposed in this article improves the accuracy of the positioning of the edge of the Gray scale strip and the center of the line-shift strip in 3D measurement and decoding, and thus increases the accuracy of 3D.
Data availability statement
The original contributions presented in the study are included in the article/Supplementary Material, further inquiries can be directed to the corresponding author.
Author contributions
YW: Conceptualization, Methodology, Software, Writing—Original Draft XS: Validation, Formal analysis, Investigation YD: Data Curation, Writing—Review YC: Writing—Editing.
Funding
This research was supported by the Fundamental Research Funds for the Universities in Heilongjiang Province (2018-KYYWF-1681), the University Nursing Program for Young Scholars with Creative Talents in Heilongjiang Province (UNPYSCT-2017086), and National Natural Science Foundation of China (61671190, 61571168).
Conflict of interest
The authors declare that the research was conducted in the absence of any commercial or financial relationships that could be construed as a potential conflict of interest.
Publisher’s note
All claims expressed in this article are solely those of the authors and do not necessarily represent those of their affiliated organizations, or those of the publisher, the editors and the reviewers. Any product that may be evaluated in this article, or claim that may be made by its manufacturer, is not guaranteed or endorsed by the publisher.
References
1. Rewitt JM. Object enhancement and extraction. New York, U.S.A: picture Processing and Psychopictoric Press (1970).
2. Roberts LG. Machine perception of three-dimensional solid. Boston, U.S.A: Massachusetts Institute of Technology (1965).
3. Marr D, Hildreth E. Theory of edge detection. Proceeding R Soc Lond (1980) 207:187–217. doi:10.1098/rspb.1980.0020
4. Canny J. A computational approach to edge detection. IEEE Trans Pattern Anal Machine Intel (1986) 8:679–98. doi:10.1109/tpami.1986.4767851
5. Kong FT. Research on edge thinning algorithm in image magnification. Comput Appl Softw (2010) 27:261–264.
6. Chen H. Research on image edge detection technology. Harbin, China: Harbin Engineering University (2012).
7. Chen YH. A survey of image edge detection methods. J Baoji Univ Arts Sci (Natural Sci Edition) (2013) 33:16–21. doi:10.13467/j.cnki.jbuns.2013.01.001
8. Jensen K, Anastassiou D. Subpixel edge localization and the interpolation of still images. IEEE Trans Image (1995) 4:285–295. doi:10.1109/83.366477
9. Sui LS, Jiang ZD. Image subpixel edge extraction method based on NURBS curve fitting. J Chin Comput Syst (2004) 25:1502–1505.
10. Zheng XP, Bi YW. Improved algorithm about subpixel edge detection based on Zernike moments and three-grayscale pattern. In: 2009 2nd International Congress on Image and Signal Processing; 17-19 October 2009; Tianjin, China. IEEE (2009).
11. Lyvers EP, Mitchell O, Akey ML, Reeves A. Subpixel measurements using a moment-based edge operator. IEEE Trans Pattern Anal Machine intelligence (1989) 11:1293–309. doi:10.1109/34.41367
12. Zhu H, Zen XJ. Sub-pixel edge extraction based on Zernike moment and least squares ellipse fitting. Comput Eng Appl (2011) 47:148–150.
13. Li J, Peng YY. Image edge refinement based on mathematical morphology thinning algorithm. J Comput Appl (2012) 32:512–520. doi:10.3724/SP.J.1087.2012.00514
14. Zhang XM, Jia KF, Zhuo DF. Application of BP neural network in image edge detection. J Comput Appl (2011) 32:2146–2149. doi:10.16208/j.issn1000-7024.2011.06.060
15. Guo KB. Theoretical research on image edge detection based on gray relational degree. Kaifeng, China: Henan University (2016).
16. Lin XT, Liu T, Wang ZY. A new subpixel detection method for diffuse edge. Chin J Sensors Actuators (2010) 23:973–977.
17. Wu HB. Research on three-dimensional measurement technology of gray-scale edge gray code and line-shift fringe. Harbin: Harbin University of Science and Technology (2008).
Keywords: three-dimensional measurement, Gray code edge, line-shift stripe center, singular operator, shortest path
Citation: Wang Y, Sun X, Duan Y and Chen Y (2023) Three-dimensional measurement method based on the singular operator and the shortest path search technique. Front. Phys. 11:1126903. doi: 10.3389/fphy.2023.1126903
Received: 18 December 2022; Accepted: 10 January 2023;
Published: 01 February 2023.
Edited by:
Zhenxu Bai, Hebei University of Technology, ChinaReviewed by:
Jianping Huang, Northeast Forestry University, ChinaLihui Wang, Guizhou University, China
Copyright © 2023 Wang, Sun, Duan and Chen. This is an open-access article distributed under the terms of the Creative Commons Attribution License (CC BY). The use, distribution or reproduction in other forums is permitted, provided the original author(s) and the copyright owner(s) are credited and that the original publication in this journal is cited, in accordance with accepted academic practice. No use, distribution or reproduction is permitted which does not comply with these terms.
*Correspondence: Xiaoming Sun, c3VueGlhb21pbmdAaHJidXN0LmVkdS5jbg==
 Yongliang Wang
 Xiaoming Sun