 Yuan-Tao Zhang
 Shu-Han Gao
 Fei Ai
94% of researchers rate our articles as excellent or good
Learn more about the work of our research integrity team to safeguard the quality of each article we publish.
Find out more
ORIGINAL RESEARCH article
Front. Phys., 30 January 2023
Sec. Low-Temperature Plasma Physics
Volume 11 - 2023 | https://doi.org/10.3389/fphy.2023.1125548
This article is part of the Research TopicEditor’s Challenge in Low-Temperature Plasma Physics: Atmospheric Pressure Nonequilibrium PlasmaView all 4 articles
Plasma simulation is an important but sometimes time-consuming approach to study the discharge behaviors of atmospheric pulsed discharges. In this work, an efficient simulation method is proposed by introducing deep learning to investigate the discharge characteristics driven by very short pulsed voltages. A loss function is designed and optimized to minimize the discrepancy between the Deep Neural Network (DNN) and the verified fluid model. The prediction data obtained via well-trained DNN can accurately and efficiently reveal the key discharge characteristics, such as the waveforms of discharge current and gap voltage, spatial profiles of charged particles density and electric field. The spatial distributions of charged particles density and electric field obtained from DNN are also given to unveil the underlying mechanisms. Additionally, the predictions from deep learning and the formula analysis both highlight that the breakdown voltage and current density can be effectively reduced by increasing repetition frequency, which quantitatively agrees well with the experimental observations. This study provides a great potential promise for vastly improving the simulation efficiency by introducing deep learning in the field of atmospheric plasmas computation.
In recent years, atmospheric plasmas excited by the pulsed voltage with millisecond to nanosecond duration have attracted ever-growing attention for its promising advantages in many application fields, such as polymeric surfaces modification [1], carbon dioxide splitting [2, 3], and plasma biomedical treatment [4, 5]. The pulsed voltage with a sharp rising edge provides intensified electric field and larger breakdown voltage in the discharge space, which could bring abundant energetic electrons and improved plasma species density in an extremely energy-efficient way, instead of heating the ambient gas [6–9]. The comparisons have also revealed that the short pulsed excitation contributes greatly to generating large-volume and homogeneous atmospheric plasmas over the whole discharge space [10–13], which are expected in the view of practical applications [14]. Furthermore, due to the presence of a large number of high-energy electrons and continual collisions at atmospheric pressure, quantities of reactive species can be generated in pulsed discharges with appropriate mixtures of chemically rich gases, such as He + O2, He + N2 and He + Ar, etc., which are supposed to be very crucial in many potential applications [15–17], especially in the novel application of plasma medicine [4, 5, 18, 19]. Further experimental and simulation researches have illustrated that the pulsed discharges can be deeply optimized by tailoring the pulsed voltage waveforms to gain desirable plasma properties [7, 20–22], and the repetition frequency of pulsed voltage has also been demonstrated to have a remarkable influence on the characteristics of pulsed discharges [23, 24]. However, due to the extreme transient nature of pulsed discharges and the limited applicability of conventional experimental diagnosis developed for low-pressure plasmas, the essential evolution processes and the ways of optimization of atmospheric pulsed discharges are still difficult to assess quantitatively [7]. On the other hand, as an important investigation approach, numerical simulation overcomes the experimental difficulties and can offer the insights into the underlying physics of the atmospheric pulsed discharges with broad range of discharge parameters and high credibility [22, 25, 26], which is helpful to select appropriate discharge operation parameters to achieve more desirable atmospheric plasmas with higher chemical activity and less risk of filamentation.
From the perspective of numerical simulation, the steep rise rate of pulsed voltage and large discharge current density in pulsed discharges bring huge challenges to the simulation code, and in order to describe the dynamic evolvement of pulsed discharges more accurately, the selection of time step and spatial step in the computational model needs to be strictly limited, which presents a great computational cost to achieve the dynamic steady state of pulsed discharges after several pulse repetition periods in time scales of milliseconds. Therefore, it is necessary to develop a more efficient computation methodology for the atmospheric pulsed discharges to cope with the further potential challenges. With the rapid development of Artificial Intelligence (AI) and Machine Learning (ML) technology, deep learning, as a promising branch of ML, has drawn growing attentions in recent years [27–29]. The fundamental idea in deep learning is that training a multilayered AI-driven model for predicting or discovering patterns in the behavior of a complex system by learning representations of data with multiple levels of abstraction [30, 31], which can be significantly more efficient than developing a commonly used purely physics-based model [27]. With the advancement of high performance computing and the increasing size of available data sets, deep learning has been widely implemented for data analytics, such as pattern recognition [32], gene discovery [33], medical image processing [34] and semantic analysis [35], etc. Recent studies have shown that deep learning, in form of the DNN, exhibits surprising capabilities in modeling low-temperature plasmas [30, 36, 37]. DNN is constructed using the simulation data from physics-based models and can be used as a black-box method to approximate the physical systems [31, 38–40]. The critical step of developing a deep learning algorithm for accurately simulating the properties of discharge plasmas is to construct a DNN which can continuous minimize the discrepancy between the corresponding prediction and simulation data. Simulating discharge properties is therefore reduced to solving optimization problems. Although the validity of deep learning in the pulsed discharge simulation is still not well explained, the DNN with multi-hidden layers that follow universal approximation theorems are supposed to be able to approximate a set of governing equations in the numerical model for the atmospheric pulsed discharge simulations [30, 41], which makes the practice of deep learning in discharge plasma simulations have a solid theoretical basis. Compared with the conventional physics-based simulation methods, the deep learning-based approaches is considered as a powerful tool which could markedly improve the computational efficiency of atmospheric pulsed discharge simulations [37, 41, 42].
In this paper, a deep learning-based algorithm is constructed and trained to predict the discharge characteristics of pulsed discharges with various pulse rise rates and repetition frequencies in atmospheric pure helium, which shows the great exploitation foreground of deep learning technology in the field of discharge plasma simulation. In Section 2, the numerical model used to calculate the training data and the deep learning method in form of the DNN with constructed four hidden layers applied in this study are described briefly. Based on the prediction results from deep learning, the validity of the well-trained DNN is verified in Section 3 by comparing with the simulation results, then the discharge evolutions of atmospheric pulsed discharges with the varying of pulse rise rate and repetition frequency, and the corresponding fundamental mechanisms are further investigated via deep learning with high accuracy and efficiency, the predicted data are also validated by the corresponding derived analytical equations from the numerical model. In Section 4, a summary is concluded.
In this study, the numerical model for atmospheric pulsed discharges is based on the one-dimensional fluid description, which is used as the data source of the DNN to investigate the characteristic quantities that govern the pulsed discharges. A parallel-plate structure is adopted to generate and sustain the discharge plasmas, the discharge gap distance is set to 2 mm and both two electrodes are covered with dielectric with the relative permittivity of 6.1 and the thickness of 1 mm. The applied pulsed voltage waveform is depicted by a piecewise function with the smooth approximation
where V0 is the voltage amplitude, T1, T2 and T3 are the durations of pulse rising phase, plateau phase and falling phase respectively. The smooth approximation is used here mainly to numerically satisfy the requirements of the continuity of equations [22, 43], and the effects of this approximation on the discharge characteristics can be considered negligible. The working gas in the simulation model is pure helium at a pressure of 760 Torr, and six pivotal plasma species are taken into consideration, which are electrons (e), helium atoms (He), atomic helium ions (He+), molecular helium ions
In the fluid model, the continuity equations coupled with the diffusion-drift approximation are given to describe the generation and loss of plasma species, Poisson equation is to determine the electric field in the electrode spacing, and the electron energy conservation equation is to calculate the mean electron temperature [26, 45, 46], which are briefly described as follows:
where the subscripts i, e and He denote the ith species, electrons and background helium gas, respectively. N indicates the number density, Γ represents the flux density in the diffusion-drift approximation, and S denotes the source term.The sign marker sgn(qi) is negative (−) for electrons, positive (+) for ions and nil for neutral species. μ and D are the drift and diffusion coefficients respectively. E is the electric field, ɛ0 and q are the vacuum permittivity and elementary charge, respectively. ɛ represents the mean electron energy, ΔEj and Kj are the energy loss and the corresponding rate coefficient of jth reaction. me and mHe are the masses of electron and helium respectively, and Kel is the momentum transfer collision frequency between electrons and background helium. kb is the Boltzmann constant. Te and THe are the electron temperature and background gas temperature respectively. THe is fixed at 300 K in this model because it has only a slight variation in the low-temperature plasmas [47]. At the boundary of the discharge region, the flux boundary conditions for plasma species and electron energy are adopted [26], and the emission of secondary electrons is also taken into consideration with a simplified coefficient value of 0.03 [19, 48].
Generally speaking, in atmospheric pulsed discharges, there are two current pulses of opposite polarity can be observed during one applied voltage cycle, which has been extensively investigated by experimental measurements and numerical simulations [20, 22, 26, 44, 49]. The first current pulse is generated during the voltage rising phase after the gap voltage exceeds the breakdown voltage in the electrode spacing, and the second current pulse is induced by the surface charges accumulated on the dielectric barriers during the falling phase of the applied voltage [6]. Therefore, the discharge current varies dramatically that its Full Width Half Maximum (FWHM) is only dozens of nanoseconds during the pulse rising phase and falling phase, on the other hand, it becomes very weak with a minor derivative during the plateau phase and afterglow phase. From point of view of mathematical analysis, this relatively complex discharge evolution characteristics of pulsed discharges poses a great challenge to the application of the deep learning. After full technical comparison and demonstration, a fully connected four-hidden-layer Back Propagation (BP) DNN is developed to predict the corresponding discharge characteristics of atmospheric helium pulsed discharges [31, 50]. As shown in Figure 1, the DNN has three layers of units: the input layer, the hidden layer, and the output layer. Time and pulse rise rate are adopted as the inputs of the DNN, and the outputs are the predicted temporal evolutions of the atmospheric pulsed discharges, such as discharge current density and the gap voltage. The DNN also supports more diverse inputs and outputs, for instance, with the spatial position and pulse rise rate as inputs, the profiles of charged particles density and electric field at characteristic moments can be output. Four hidden layers with 30 neurons in each layer are used in the DNN, in which the Rectified Linear Unit (ReLU) function, hyperbolic tangent (tanh) function, hyperbolic tangent (tanh) function, and sigmoid function are successively adopted as the activation functions [51]. A detailed description of the DNN with multiple hidden layers can be found in Refs. [31, 36]. In order to achieve the high precision prediction of the discharge characteristics, a loss function L is designed to measure the discrepancy between the prediction and simulation data, which can be expressed as
Where M denotes the number of the scattered points which can be uniformly or randomly selected in the corresponding calculation domain. ypre stands for the predicted data output from the DNN, and ysim represents the simulation data obtained from the numerical model. This deep learning-based algorithm is based on the open-source software package Google’s TensorFlow [52], which supports Graphics Processing Unit (GPU) acceleration to improve learning efficiency [53], and uses the well-known optimizer Adam to minimize the loss function L and achieve the optimization of the DNN [54].
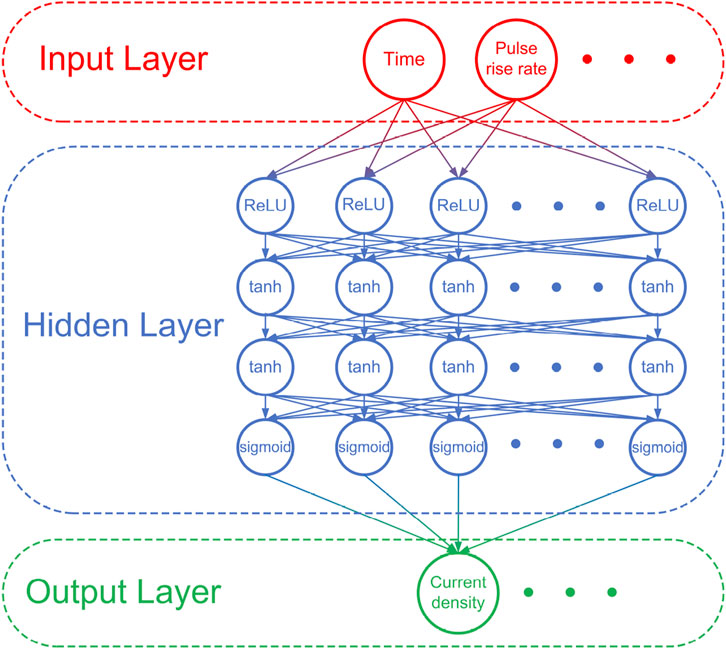
FIGURE 1. Structure diagram of the DNN constructed based on the characteristics of atmospheric pulsed discharges.
In this study, the training datasets are calculated from the fluid model, then the DNN is trained against these data and eventually applied to make new predictions. In the fluid model, the governing equations are numerically discretized and solved with the improved Scharfetter-Gummel (ISG) scheme [55–57]. Generally speaking, to achieve a dynamic steady state of the atmospheric pulsed discharge with a repetition frequency of 5 kHz, at least 10 repetition periods need to be applied before the final calculation results are obtained, which will cost about 24 h by means of a powerful computing platform (3.0 GHz Core i7-9700 CPU with 16 G RAM), something computationally expensive. On the other hand, the application of fluid model to the description of atmospheric pulsed discharges under sub-microsecond has been widely validated by the experimental observations under various discharge conditions [7, 8, 20, 24, 26], thus this work mainly focuses on improving the efficiency and effectiveness of the pulsed discharge simulation by introducing deep learning. In addition, the formed datasets from experiments can also be used as the training datasets to predict various discharge properties of the atmospheric pulsed discharges.
A good deep learning model should present good performance not only on a training set, but more importantly on a testing set [58]. The validation of the predicted data from well-trained DNN is performed in this section by comparing with the testing set obtained from the fluid simulations. Figure 2 displays the discharge current density and the gap voltage predicted by the DNN, together with the corresponding waveforms simulated by the fluid model. The amplitude of applied pulsed voltage is 5000 V with a repetition frequency of 5 kHz, the durations of pulse rising phase, plateau phase and falling phase are 100 ns, 1,000 ns and 100 ns respectively, which suggests the corresponding pulse rise rate is 50 V/ns. It is clear in Figure 2 that the DNN achieves a perfect agreement compared to the simulation results, even in domains with rapidly changing profiles. The variance between deep learning prediction and fluid simulation for the current density and gap voltage are only 7.79 × 10⁻⁹ and 1.42 × 10⁻⁸ respectively with a mean prediction time of 3.11 s, which saves four orders of magnitude of computation time compared to the fluid simulation. As shown in Figure 2, the current density rises slightly just as the pulsed voltage is applied, which is mainly due to the displacement current, and for the main discharge process of pulsed discharges, the displacement current is negligible. The insert Figure 2 enlarges the rising phase of the pulsed voltage to show more details. As the applied voltage increases, the gap voltage is enhanced almost linearly at a rise rate slightly less than that of the applied voltage, then it reaches its peak value of 1.83 kV, which is denoted as breakdown point Tb; and approximately at this point, the current density starts to rapidly rises and reaches its amplitude of 0.398 A/cm2. Then due to the gas breakdown, charges produced by the intense discharge event and accumulated on the dielectric barriers induce a memory voltage leading to a sharp drop in the gap voltage until the current becomes too weak to compensate for the increase of the applied voltage [59]; Based on the prediction data, the FWHM of the positive current pulse in Figure 2 is 21.66 ns under the given discharge conditions. In the following discussion, the data about the peak current and breakdown voltage are both taken from the positive current pulse ignited during the pulse rising phase.
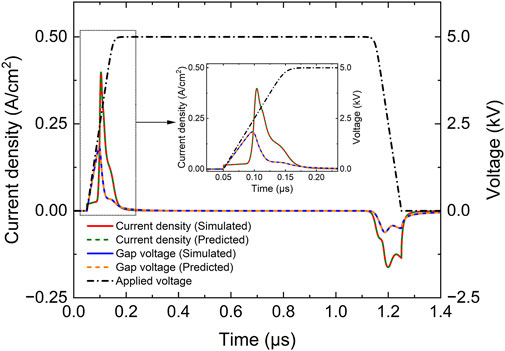
FIGURE 2. Prediction on current density and gap voltage in the atmospheric pulsed discharge via deep learning with comparison of the simulation results. The insert figure is to show details.
The deep learning predictions for the spatial distributions of electron density, ion density and electric field at the moment when the discharge current reaches its peak value are also compared with the simulation data in Figure 3. It can be seen that the predicted profiles are in good agreement with the simulation results, particularly in the sheath region where the values changes dramatically. The variance of the electron density, ion density and electric field are only 3.40 × 10⁻⁸, 5.71 × 10⁻⁸ and 2.36 × 10⁻⁸ respectively, and the mean prediction time is only 3.01 s. When the discharge current achieves its positive peak, the atmospheric pulsed discharge develops a prominent cathode fall region on the right side of the electrode spacing, where the ion has a large density gradient in Figure 3A and the electric field reaches a large peak of 3.87 × 10⁴ V/cm in Figure 3B, which is the results of both the flow of the electrons toward the anode (the left hand side) and the movement of the ions toward the cathode (the right hand side) under the action of the applied electric field [44], and the much stronger electric field in the cathode sheath leads to intense ionization events, together with the greatly increase in electron density and ion density nearby the cathode. On the left side of the cathode sheath, Figure 3 shows that the electric field declines rapidly to almost zero and the electron density reaches its peak, indicating the formation of the negative glow region, which agrees well with the dark zone as observed by iCCD camera in experimental observations [7, 46], and it is supposed to be essential in maintaining the current continuity in the sheath region in discharges with large current density [60–64]. The rest of the electrode spacing is identified as the positive column, which is a large quasi-neutral plasma region where the electron density and ion density are almost equal with a relatively lower electric field. These features indicate that the pulsed discharge is in the glow mode at this instant, and the DNN could precisely capture the main dynamics of the atmospheric pulsed discharges with a remarkable computational efficiency.
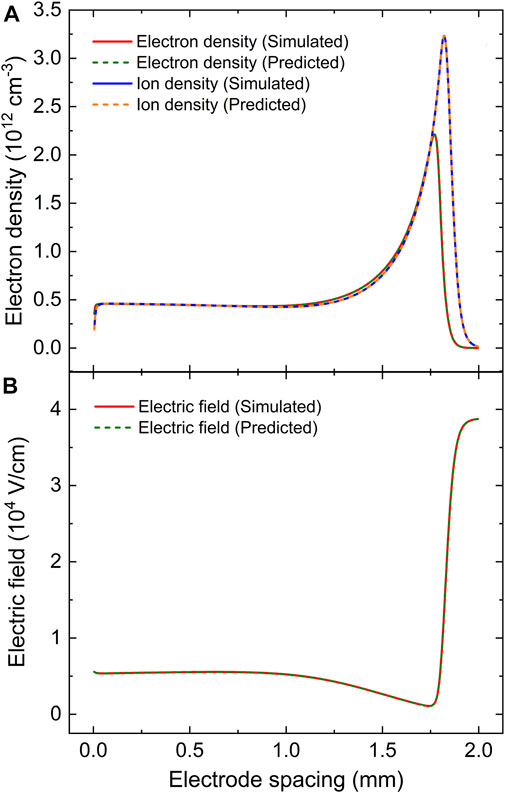
FIGURE 3. Prediction on spatial distributions of (A) electron density and ion density and (B) electric field at the moment when the current density gets to the peak value in the atmospheric pulsed discharge via deep learning with comparison of the simulation results.
In this section, the DNN is used to predict the pulsed discharge properties with various pulse rise rates at a fixed voltage amplitude of 5000 V, in which 36 sets of data obtained from the fluid simulation along the pulse rise rate ranging from 15 to 85 V/ns are uniformly selected as the training datasets. Based on the prediction results via deep learning, Figure 4 displays the waveforms of discharge current density with different pulse rise rates of 20, 50, and 80 V/ns, and the insert figure is to show details. When the pulse rise rate is set to 20 V/ns, the peak current density is about 0.17 A/cm2, and if the pulse rise rate is increased to 50 V/ns at a fixed voltage amplitude, the pulsed discharge is obviously enhanced with a peak of 0.398 A/cm2, then when the pulse rise rate is further increased to be larger than 80 V/ns, the peak current density of 0.61 A/cm2 is remarkably stronger than either of the above; the negative discharge current is also enhanced by increasing the pulse rise rate in Figure 4. The prediction data indicate that at a given voltage amplitude, increasing the pulse rise rate can effectively enhance the discharge current density of pulsed discharges. From the foregoing discussion in Figure 2, the gap voltage evolution is particularly important for the discharge characteristics because it determines the breakdown voltage Vb, which is the maximum value of the gap voltage and directly governs the peak value of the discharge current density. Thus a more deeply investigation on the breakdown voltage should be performed via deep learning to unveil the corresponding underpinning physics.
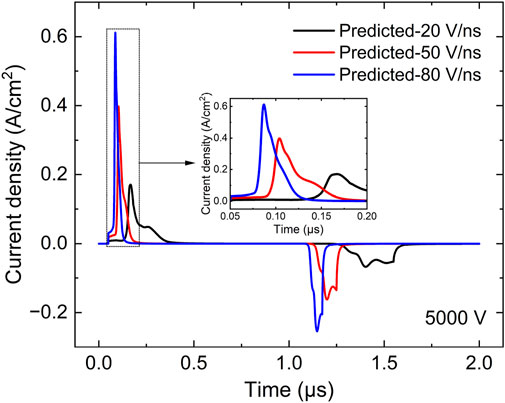
FIGURE 4. Prediction on current density in the atmospheric pulsed discharges via deep learning with various pulse rise rates at a fixed voltage amplitude of 5000 V. The insert figure is to show details.
Correspondingly, the predicted breakdown voltage as a function of pulse rise rate is given in Figure 5. It is shown that as the pulse rise rate is increased from 15 to 85 V/ns at a fixed voltage amplitude of 5000 V, the breakdown voltage has a weak linear dependence on the pulse rise rate, increasing from 1.49 to 2.01 kV. The prediction data obtained by deep learning can be further validated by the derived equations from the fluid model. In the governing equations of the fluid model, the derivation of the gap voltage Vg can be expressed by
where dg and ds are the thickness of gas gap and dielectric respectively, and ɛr is the relative dielectric constant. Kr represents the rise rate of the pulsed voltage, which is given by
thus Eq. 7 can be further derived as
consequently, the expression of breakdown voltage Vb can be explicitly given by
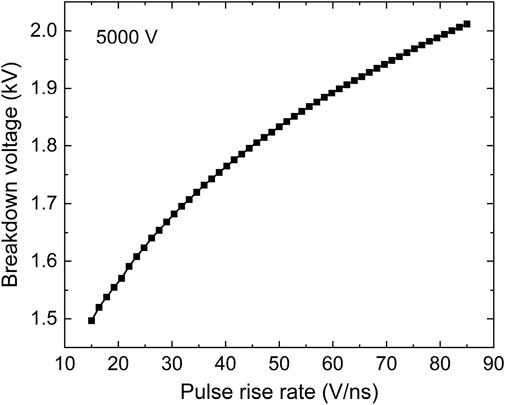
FIGURE 5. Breakdown voltage as a function of pulse rise rate at a fixed voltage amplitude of 5000 V.
In Eq. 10, dg, ds and ɛr are both the constants for the present discharge conditions. At the breakdown point Tb, the discharge is still not fully ignited and thus the electron density Nξ has not yet varied significantly. So roughly speaking, Eq. 10 analytically illustrates that the breakdown voltage is mainly dependent on the pulse rise rate Kr, of course to be exact, it should linearly depend on the ratio of
Figure 6 shows the predicted peak current density and the FWHM of the current pulse as functions of the pulse rise rate at a given voltage amplitude of 5000 V. As can be seen, the peak current density is almost linearly dependent on the pulse rise rate. When the pulse rise rate increases from 15 to 85 V/ns, the peak value of the discharge current density rises from 0.13 to 0.65 A/cm2, which demonstrates that the larger pulse rise rate indicates the larger discharge current at a given applied voltage amplitude. Meanwhile as the peak current density increases, the deep learning prediction shows that the corresponding FWHM of current pulse eventually reduces from 43.66 to 15.67 ns, which clearly suggests that the larger current peak tends to rise and drop more rapidly, agreeing well with the experimental observations [20, 66].
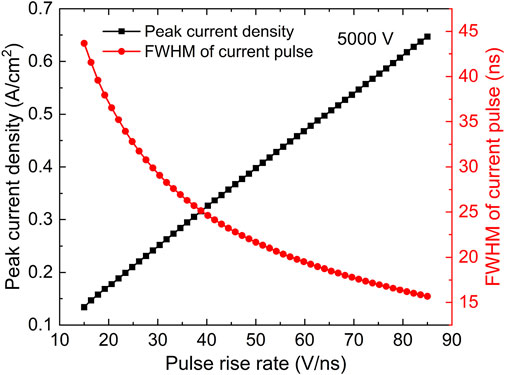
FIGURE 6. Peak current density and FWHM of current pulse as functions of pulse rise rate at a fixed voltage amplitude of 5000 V.
In order to unravel the underlying mechanisms of atmospheric pulsed discharges via deep learning, the spatial distributions of charged particles density and electric field at the instant when the discharge current gets to the peak value are predicted in Figure 7A and 7B respectively with various pulse rise rates at the fixed voltage amplitude of 5000 V. As the pulse rise rate increases in Figure 7A, the larger electron density and ion density can be observed especially in the sheath region, meanwhile the location of the density peak moves toward the cathode together with the sustained shrinkage of the sheath thickness. When the pulse rise rate is set to 80 V/ns, the predicted results indicate that the maximums of electron density and ion density reach 2.94 × 10¹² and 4.18 × 1012 cm−3 respectively near the cathode, which suggests the density of the space charge is approximately 1.24 × 1012 cm−3 in the sheath region, then the large space charge density greatly enhances the electric field in the cathode sheath, as predicted and plotted in Figure 7B, the peak value of the electric field is 3.19 × 10⁴ V/cm at a pulse rise rate of 20 V/ns, and it gets to 3.87 × 10⁴ and 4.27 × 10⁴ V/cm with the increasing pulse rise rate from 50 to 80 V/ns. By accelerating the secondary electrons toward anode, the enhanced electric field in cathode sheath could effectively improve the ionization rates in the discharge region, leading to a significantly increase in discharge current density in Figure 6.
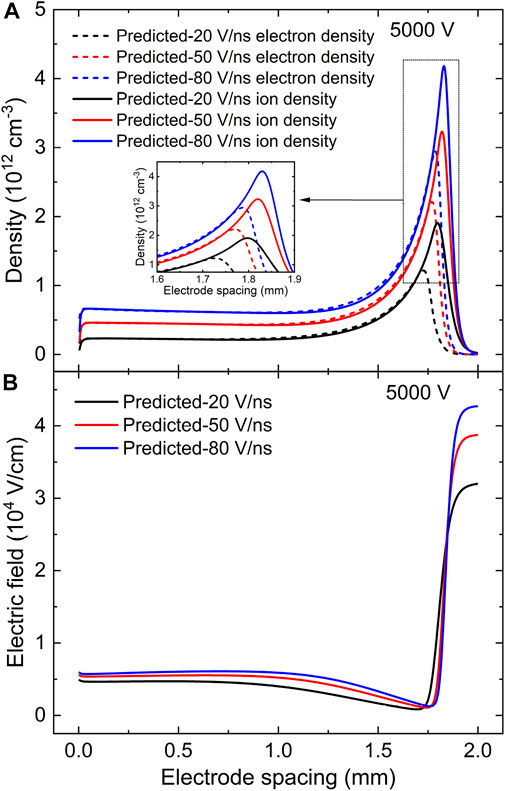
FIGURE 7. Prediction on spatial distributions of (A) electron density and ion density and (B) electric field at the moment when the current density gets to the peak value in the atmospheric pulsed discharges via deep learning with various pulse rise rates at a fixed voltage amplitude of 5000 V. The insert figure is to show details.
Based on the ultra prediction efficiency of the well-trained DNN, Figure 8 gives the spatial profiles of electron density at the instant when the discharge current gets to the peak value and its corresponding maximum value as functions of pulse rise rate. As the pulse rise rate is increased from 15 to 85 V/ns, Figure 8A shows that the electron density tends to get larger values throughout the discharge space, especially in the sheath region, and its peak rises from 1.01 × 10¹² to 3.04 × 1012 cm−3 in Figure 8B. Meanwhile as the pulse rise rate increases, the corresponding electric field and its maximum value are eventually enhanced in Figure 9. These prediction data explicitly indicate that a larger discharge current is commonly accompanied by a higher plasma species density and a stronger electric field in the sheath region. More importantly, the prediction profiles in Figures 8, 9 propose that by constructing a training dataset containing 36 sets of simulation data at various pulse rise rates and after the fully training, an effective and efficient deep learning-based algorithm is developed, which could quickly and accurately predict the essential discharge properties of the atmospheric pulsed discharges, such as temporal evolutions of discharge current density and gap voltage, spatial distributions of electron density, ion density and electric field, for the pulse rise rate range of 15–85 V/ns at a fixed voltage amplitude of 5000 V. That is to say, not only can any point on the curves in Figures 5, 6, 8, and 9 be exactly obtained via deep learning, but the prediction process takes only a few seconds for a single case compared to tens of hours of CPU time adopting the conventional fluid simulation, indicating a remarkable improvement in computational efficiency in the atmospheric pulsed discharge simulations.
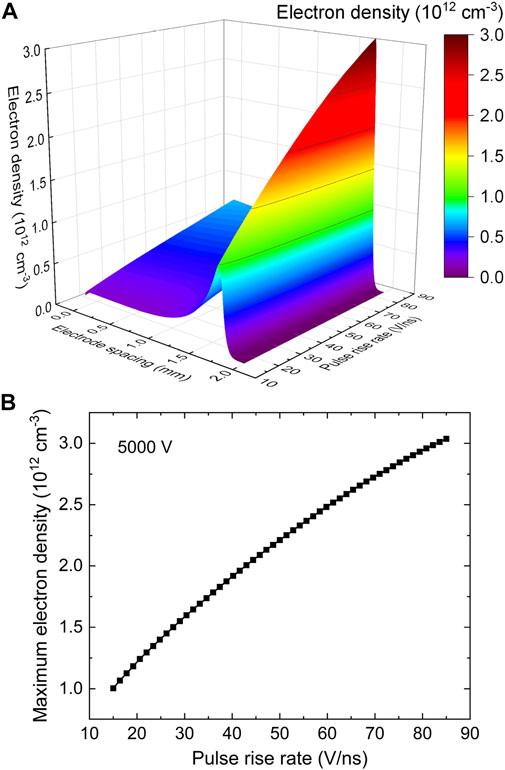
FIGURE 8. (A) spatial distribution of electron density and (B) its maximum value at the moment when the current density gets to the peak value as functions of pulse rise rate at a fixed voltage amplitude of 5000 V.
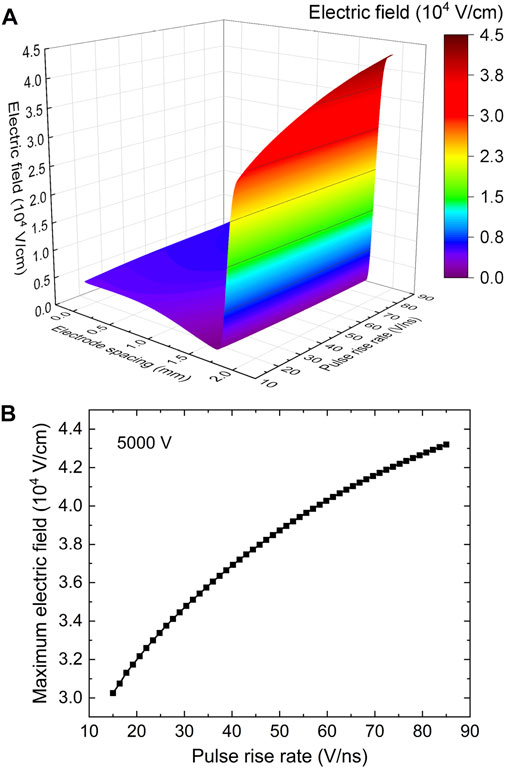
FIGURE 9. (A) spatial distribution of electric field and (B) its maximum value at the moment when the current density gets to the peak value as functions of pulse rise rate at a fixed voltage amplitude of 5000 V.
In the atmospheric pulsed discharges, the repetition frequency of pulsed voltage also strongly influences the discharge behaviors, which has been widely observed in experimental measurements [23, 24, 67]. For exactly predicting the pulsed discharge properties at various repetition frequencies, 65 sets of data ranging from 4 to 100 kHz were uniformly selected as the training datasets of the DNN considering the variation of discharge behaviors with repetition frequency is relatively complicated. Figure 10 gives the temporal evolutions of discharge current density and gap voltage predicted via deep learning with various repetition frequencies from 4.75 to 60.75 kHz, and the pulsed voltage waveform remains unchanged. Figure 10 shows that the predicted peak value of the current density is 4.06 A/cm2 and the breakdown voltage is 1.85 kV at a repetition frequency of 4.75 kHz. Then as the repetition frequency is increased to 13.75 kHz, the current density only peaks at 2.56 A/cm2, dropping by 36.95%, and the breakdown voltage is 1.45 kV, decreasing by a factor of 21.62%. When the repetition frequency rises to 60.75 kHz, the deep learning prediction suggests that the peak current density is nearly 1.85 A/cm2, and the breakdown voltage is close to 0.99 kV. The prediction data are summarized in Figure 11, where the peak values of discharge current density and the breakdown voltage are plotted with various repetition frequencies at a fixed pulsed voltage waveform. From Figure 11, when the repetition frequency is increased, the breakdown voltage and discharge current density will decrease very sharply especially when the repetition frequency is lower than 20 kHz. The evolution profiles predicted by deep learning is quantitatively consistent with the experimental observations [23, 24].
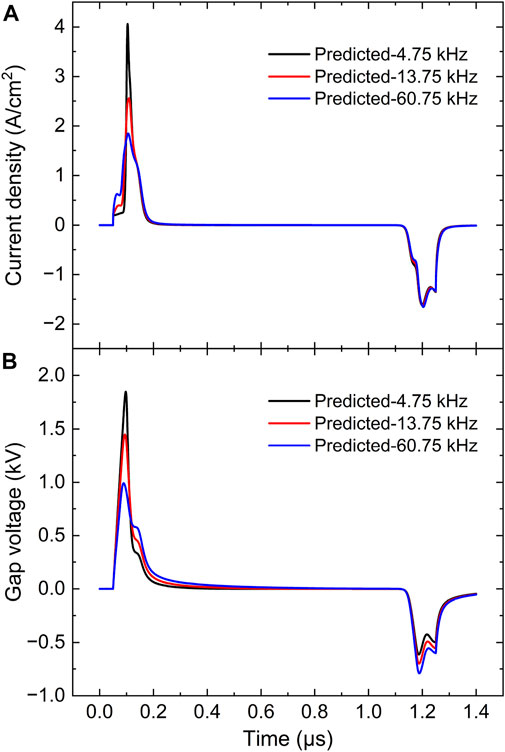
FIGURE 10. Prediction on (A) current density and (B) gap voltage in the atmospheric pulsed discharges via deep learning with various repetition frequencies at a fixed pulsed voltage waveform.
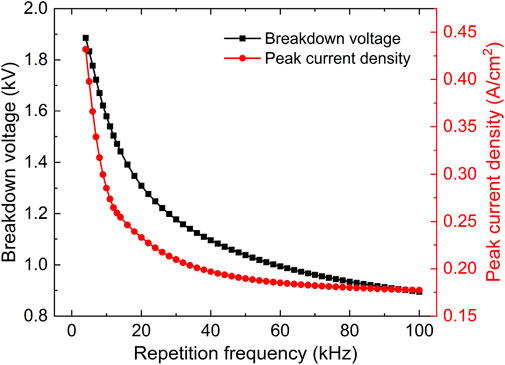
FIGURE 11. Breakdown voltage and peak current density as functions of repetition frequency at a fixed pulsed voltage waveform.
Generally speaking, the afterglow phase is shortened with the increase of repetition frequency, thus more plasma species could stay in the electrode spacing until the next breakdown event just because they have less time to completely recombine and accumulate on the dielectric barriers by traveling across the gas gap. Therefore, as the electron density Nξ increases with the increasing repetition frequency, the breakdown voltage is indicated by Eq. 10 to decrease at a fixed pulse rise rate Kr, thus the prediction results in Figure 11 are eventually validated by the derived equation from the fluid model. Furthermore, the predicted curves in Figure 11 show that the well-trained DNN is fully competent to describe various discharge properties of atmospheric pulsed discharges at different repetition frequencies under a fixed pulsed voltage waveform, while the computational efficiency is much higher than that of the fluid model, which will help to greatly extend the traversal range of discharge parameters and facilitate the understanding of atmospheric pulsed discharge evolutions.
In this paper, a deep learning-based method is developed to investigate the discharge characteristics in pulsed discharges controlled by dielectric barriers at atmospheric pressure. The feasibility and validity of the deep learning algorithm in describing the discharge behaviors are verified by comparing with the simulation data obtained from the fluid model. After fully training, the essential quantities of pulsed discharges, such as the temporal evolution of discharge current density and gap voltage, spatial distribution of electron density, ion density and electric field, can be efficiently and accurately yielded from DNN, which agrees well with the data from the heavy-cost physics-based model solution. The prediction results via DNN show that the breakdown voltage can be effectively enhanced by increasing the pulse rise rate, and the peak current density is linearly dependent on the pulse rise rate. The analysis of the derived equation also confirms this conclusion. The predicted spatial profiles of charged particles density and electric field are further given to illustrate the underpinning physics, which shows a significant increase in electron density and electric field with the pulse rise rate, especially in the sheath region. Further prediction data and formula analysis suggest that the residual plasma species from previous breakdown event can also seriously influence the discharge properties, and increasing repetition frequency can obviously reduce the breakdown voltage and discharge current density in pulsed discharges. These evolution profiles from DNN show a good agreement with the experimental observations. This study provides a great potential promise for vastly improving the simulation efficiency by introducing DNN in the field of atmospheric plasmas computation, which could contribute to a better understanding of discharge mechanisms in pulsed discharges.
The raw data supporting the conclusion of this article will be made available by the authors, without undue reservation.
Y-TZ: Methodology, investigation, supervision, Writing S-HG: Writing—original draft. Formal analysis.
This work was supported by National Natural Science Foundation of China (No. 11975142).
The authors declare that the research was conducted in the absence of any commercial or financial relationships that could be construed as a potential conflict of interest.
All claims expressed in this article are solely those of the authors and do not necessarily represent those of their affiliated organizations, or those of the publisher, the editors and the reviewers. Any product that may be evaluated in this article, or claim that may be made by its manufacturer, is not guaranteed or endorsed by the publisher.
1. Kong JL, Kong MG. 10ns pulsed atmospheric air plasma for uniform treatment of polymeric surfaces. Appl Phys Lett (2007) 91:251504. doi:10.1063/1.2825576
2. Wang XC, Zhang TH, Sun Y, Wu ZC, Zhang YT. Numerical study on discharge characteristics and plasma chemistry in atmospheric CO2 discharges driven by pulsed voltages. Phys Plasmas (2022) 29:023505. doi:10.1063/5.0080735
3. Wang XC, Bai JX, Zhang TH, Sun Y, Zhang YT. Comprehensive study on plasma chemistry and products in CO2 pulsed discharges under Martian pressure. Vacuum (2022) 203:111200. doi:10.1016/j.vacuum.2022.111200
4. Chu PK. Plasma-treated biomaterials. IEEE Trans Plasma Sci (2007) 35:181–7. doi:10.1109/tps.2006.888587
5. Fridman G, Friedman G, Gutsol A, Shekhter AB, Vasilets VN, Fridman A. Applied plasma medicine. Plasma Process Polym (2008) 5:503–33. doi:10.1002/ppap.200700154
6. Laroussi XP, Laroussi M. Electron density and temperature measurement of an atmospheric pressure plasma by millimeter wave interferometer. Appl Phys Lett (2008) 92:051501. doi:10.1063/1.2840194
7. Iza F, Walsh JL, Kong MG. From submicrosecond-to nanosecond-pulsed atmospheric-pressure plasmas. IEEE Trans Plasma Sci (2009) 37:1289–96. doi:10.1109/tps.2009.2014766
8. Huang BD, Takashima K, Zhu XM, Pu YK. The influence of the voltage rise rate on the breakdown of an atmospheric pressure helium nanosecond parallel-plate discharge. J Phys D: Appl Phys (2015) 48:125202. doi:10.1088/0022-3727/48/12/125202
9. Gao SH, Wang XL, Zhang YT. Modeling study on the enhancement of atmospheric pulse-modulated radio-frequency discharge assisted by pulsed voltage. Phys Plasmas (2021) 28:113501. doi:10.1063/5.0061546
10. Ayan H, Fridman G, Gutsol AF, Vasilets VN, Fridman A, Friedman G. Nanosecond-pulsed uniform dielectric-barrier discharge. IEEE Trans Plasma Sci (2008) 36:504–8. doi:10.1109/tps.2008.917947
11. Xiong Q, Lu XP, Ostrikov K, Xian Y, Zou C, Xiong Z, et al. Pulsed dc- and sine-wave-excited cold atmospheric plasma plumes: A comparative analysis. Phys Plasmas (2010) 17:043506. doi:10.1063/1.3381132
12. Shao T, Niu Z, Zhang C, Yu Y, Jiang H, Li WF, et al. IEEE Trans Plasma Sci (2011) 39:2062. doi:10.1109/tps.2011.2161495
13. Kettlitz M, Höft H, Hoder T, Weltmann K, Brandenburg R. Comparison of sinusoidal and pulsed-operated dielectric barrier discharges in an O2/N2mixture at atmospheric pressure. Plasma Sourc Sci. Technol. (2013) 22:025003. doi:10.1088/0963-0252/22/2/025003
14. Zhang YT, Wang DZ, Wang YH. Two-dimensional numerical simulation of the splitting and uniting of current-carrying zones in a dielectric barrier discharge. Phys Plasmas (2005) 12:103508. doi:10.1063/1.2119698
15. Knake N, Niemi K, Reuter S, Schulz-von der Gathen V, Winter J. Absolute atomic oxygen density profiles in the discharge core of a microscale atmospheric pressure plasma jet. Appl Phys Lett (2008) 93:131503. doi:10.1063/1.2995983
16. Ellerweg D, Benedikt J, von Keudell A, Knake N, Schulz-von der Gathen V. Characterization of the effluent of a He/O2microscale atmospheric pressure plasma jet by quantitative molecular beam mass spectrometry. New J Phys (2010) 12:013021. doi:10.1088/1367-2630/12/1/013021
17. Zhang J, Zhang YT. Modeling study on the generation of reactive oxygen species in atmospheric radio-frequency helium-oxygen discharges. Plasma Process. Polym (2012) 9:919–28. doi:10.1002/ppap.201200067
18. Laroussi M. Low temperature plasma-based sterilization: Overview and state-of-the-art. Plasma Process Polym (2005) 2:391–400. doi:10.1002/ppap.200400078
19. Iza F, Kim GJ, Lee SM, Lee JK, Walsh JL, Zhang YT, et al. Microplasmas: Sources, particle kinetics, and biomedical applications. Plasma Process Polym (2008) 5:322–44. doi:10.1002/ppap.200700162
20. Huang XJ, Sun LQ, Bao Y, Zhang J, Shi JJ. An experimental study on discharge mechanism of pulsed atmospheric pressure glow discharges. Phys Plasmas (2011) 18:033503. doi:10.1063/1.3566005
21. Uchida G, Takenaka K, Setsuhara Y. Effects of discharge voltage waveform on the discharge characteristics in a helium atmospheric plasma jet. J Appl Phys (2015) 117:153301. doi:10.1063/1.4918546
22. Wang YT, Wang YH. Modeling study on the effects of pulse rise rate in atmospheric pulsed discharges. Phys Plasmas (2018) 25:023509. doi:10.1063/1.5011949
23. Uchida G, Takenaka K, Kawabata K, Miyazaki A, Setsuhara Y. Effects of driving voltage frequency on the discharge characteristics of atmospheric dielectric-barrier-discharge plasma jet. Jpn J Appl Phys (2014) 53:11RA08. doi:10.7567/jjap.53.11ra08
24. Huang BD, Takashima K, Zhu XM, Pu YK. The influence of the repetition rate on the nanosecond pulsed pin-to-pin microdischarges. J Phys D: Appl Phys (2014) 47:422003. doi:10.1088/0022-3727/47/42/422003
25. Zhang J, Wang YH, Wang DZ. Nonlinear behaviors in a pulsed dielectric barrier discharge at atmospheric pressure. Thin Solid Films (2011) 519:7020–4. doi:10.1016/j.tsf.2010.11.062
26. Song ST, Guo Y, Choe W, Zhang J, Zhang J, Shi JJ. Sub-microsecond pulsed atmospheric glow discharges with and without dielectric barrier. Phys Plasmas (2012) 19:123508. doi:10.1063/1.4772780
27. Mitchell MI, Mitchell TM. Machine learning: Trends, perspectives, and prospects. Science (2015) 349:255–60. doi:10.1126/science.aaa8415
28. Bilionis RK, Bilionis I. Deep UQ: Learning deep neural network surrogate models for high dimensional uncertainty quantification. J Comput Phys (2018) 375:565–88. doi:10.1016/j.jcp.2018.08.036
29. Carleo G, Cirac I, Cranmer K, Daudet L, Schuld M, Tishby N, et al. Rev Mod Phys (2019) 91:045002. doi:10.1103/revmodphys.91.045002
30. Graves A, Graves DB. Machine learning for modeling, diagnostics, and control of non-equilibrium plasmas. J Phys D: Appl Phys (2019) 52:30LT02. doi:10.1088/1361-6463/ab1f3f
31. Hong Y, Hou B, Jiang HL, Zhang JC. Wiley Interdiscip Rev Comput Mol Sci (2020) 10:e1450. doi:10.1002/wcms.1450
32. Bishop CM, Nasrabadi NM. Pattern recognition and machine learning, vol. 4. Berlin, Germany: Springer (2006).
33. DePristo MA, Banks E, Poplin R, Garimella KV, Maguire JR, Hartl C, et al. A framework for variation discovery and genotyping using next-generation DNA sequencing data. Nat Genet (2011) 43:491–8. doi:10.1038/ng.806
34. Razzak MI, Naz S, Zaib A. Deep learning for medical image processing: Overview, challenges and the future. In: N Dey, AS Ashour, and S Borra, editors. Classification in BioApps: Automation of decision making. Cham: Springer International Publishing (2018). p. 323–50. doi:10.1007/978-3-319-65981-7_12
35. Wang C, Han YF, Wang WD. An end-to-end deep learning image compression framework based on semantic analysis. Appl Sci (2019) 9:3580. doi:10.3390/app9173580
36. Gidon D, Pei XK, Bonzanini AD, Graves DB, Mesbah A. Machine learning for real-time diagnostics of cold atmospheric plasma sources. IEEE Trans Radiat Plasma Med Sci (2019) 3:597–605. doi:10.1109/trpms.2019.2910220
37. Zhong LL, Wu BY, Wang YF. Low-temperature plasma simulation based on physics-informed neural networks: Frameworks and preliminary applications. Phys Fluids (2022) 34:087116. doi:10.1063/5.0106506
38. Dongare AD, Kharde RR, Kachare AD. Introduction to artificial neural network. Int J Eng Innovative Technol (2012) 2:189.
40. Abiodun OI, Jantan A, Omolara AE, Dada KV, Mohamed NA, Arshad H. State-of-the-art in artificial neural network applications: A survey. Heliyon (2018) 4:e00938. doi:10.1016/j.heliyon.2018.e00938
41. Zhong LL, Gu Q, Wu BY. Deep learning for thermal plasma simulation: Solving 1-D arc model as an example. Comput Phys Commun (2020) 257:107496. doi:10.1016/j.cpc.2020.107496
42. Liu HY, Liu YM, Yang M, Li XP. A joint demodulation and estimation algorithm for plasma sheath channel: Extract principal curves with deep learning. IEEE Wireless Commun Lett (2019) 9:433. doi:10.1109/LWC.2019.2957811
43. Lieberman RA, Lieberman MA. Model of plasma immersion ion implantation for voltage pulses with finite rise and fall times. J Appl Phys (1991) 70:3481–7. doi:10.1063/1.349240
44. Chen B, Tan ZY, Song XX, Zhang YT. Characteristics of atmospheric-pressure helium barrier pulse discharges. IEEE Trans Plasma Sci (2011) 39:1949–57. doi:10.1109/tps.2011.2162345
45. Yuan XH, Raja LL. Computational study of capacitively coupled high-pressure glow discharges in helium. IEEE Trans Plasma Sci (2003) 31:495. doi:10.1109/TPS.2003.815479
46. Simeni MS, Zheng YS, Barnat EV, Bruggeman PJ. Townsend to glow discharge transition for a nanosecond pulse plasma in helium: Space charge formation and resulting electric field dynamics. Plasma Sourc Sci. Technol. (2021) 30:055004. doi:10.1088/1361-6595/abf320
47. Zhang YT, Lou J, Li QQ, Li QM. Electrode-gap effects on the electron density and electron temperature in atmospheric radio-frequency discharges. IEEE Trans Plasma Sci (2013) 41:414–20. doi:10.1109/tps.2013.2244912
48. Yang X, Moravej M, Nowling G, Babayan S, Panelon J, Chang J, et al. Comparison of an atmospheric pressure, radio-frequency discharge operating in the α and γ modes. Plasma Sourc Sci. Technol. (2005) 14:314–20. doi:10.1088/0963-0252/14/2/013
49. Laroussi XP, Laroussi M. Temporal and spatial emission behaviour of homogeneous dielectric barrier discharge driven by unipolar sub-microsecond square pulses. J Phys D: Appl Phys (2006) 39:1127–31. doi:10.1088/0022-3727/39/6/018
50. Holyoak KJ. A Connectionist View of Cognition: Parallel Distributed Processing. Explorations in the Microstructure of Cognition. David E. Rumelhart, James L. McClelland, and the PDP Research Group. MIT Press, Cambridge, MA, 1986. In two volumes. Vol. 1, Foundations. xx, 547 pp., illus. $27.50. Vol. 2, Psychological and Biological Models. xiv, 611 pp., illus. $27.50. Computational Models of Cognition and Perception. A Bradford Book. Science (1987) 236:992–6. doi:10.1126/science.236.4804.992
51. Zhang C, Woodland PC. Sixteenth annual conference of the international speech communication association (2015).
52. Abadi M, Barham P, Chen J, Chen Z, Davis A, Dean J, et al. 12th USENIX symposium on operating systems design and implementation (OSDI 16). Savannah, GA: USENIX Association (2016). p. 265–83.
53. Brodtkorb AR, Hagen TR, Sætra ML. Graphics processing unit (GPU) programming strategies and trends in GPU computing. J Parallel Distributed Comput (2013) 73:4–13. doi:10.1016/j.jpdc.2012.04.003
54. Kingma DP, Ba J, Adam: A Method for Stochastic Optimization. arXiv preprint arXiv:1412.6980 (2014).
55. Gummel DL, Gummel HK. Large-signal analysis of a silicon Read diode oscillator. IEEE Trans Electron Devices (1969) 16:64–77. doi:10.1109/t-ed.1969.16566
56. Kulikovsky AA. The structure of streamers in N2. I. fast method of space-charge dominated plasma simulation. J Phys D: Appl Phys (1994) 27:2556–63. doi:10.1088/0022-3727/27/12/017
57. Kulikovsky AA. A More Accurate Scharfetter-Gummel Algorithm of Electron Transport for Semiconductor and Gas Discharge Simulation. J Comput Phys (1995) 119:149–55. doi:10.1006/jcph.1995.1123
58. Zhong LL. Fast prediction of electron-impact ionization cross sections of large molecules via machine learning. J Appl Phys (2019) 125:183302. doi:10.1063/1.5094500
59. Zhang DZ, Wang YH, Wang DZ. The transition mechanism from a symmetric single period discharge to a period-doubling discharge in atmospheric helium dielectric-barrier discharge. Phys Plasmas (2013) 20:063504. doi:10.1063/1.4812454
60. Gottscho RA, Mitchell A, Scheller GR, Chan YY, Graves DB. Electric field reversals in dc negative glow discharges. Phys Rev A (1989) 40:6407–14. doi:10.1103/physreva.40.6407
61. Pitchford JP, Pitchford LC. Field reversal in the negative glow of a DC glow discharge. J Phys D: Appl Phys (1995) 28:2083–8. doi:10.1088/0022-3727/28/10/013
62. Wang Q, Economou DJ, Donnelly VM. Simulation of a direct current microplasma discharge in helium at atmospheric pressure. J Appl Phys (2006) 100:023301. doi:10.1063/1.2214591
63. Schulze J, Donkó Z, Heil BG, Luggenhölscher D, Mussenbrock T, Brinkmann RP, et al. Electric field reversals in the sheath region of capacitively coupled radio frequency discharges at different pressures. J Phys D: Appl Phys (2008) 41:105214. doi:10.1088/0022-3727/41/10/105214
64. Simeni MS, Goldberg BM, Zhang C, Frederickson K, Lempert WR, Adamovich IV. J Phys D: Appl Phys (2017) 50:184002.
65. Zhang J, Zhang YT. Analytical and Numerical Study on the Characteristics at the α-γ Transition Point in Radio-Frequency Helium Discharges at Atmospheric Pressure. IEEE Trans Plasma Sci (2013) 41:274–9. doi:10.1109/tps.2012.2234764
66. Kong JL, Kong MG. Sharp bursts of high-flux reactive species in submicrosecond atmospheric pressure glow discharges. Appl Phys Lett (2006) 89:231503. doi:10.1063/1.2397570
Keywords: pulsed discharge, numerical simulation, fluid model, deep learning, electron density
Citation: Zhang Y-T, Gao S-H and Ai F (2023) Efficient numerical simulation of atmospheric pulsed discharges by introducing deep learning. Front. Phys. 11:1125548. doi: 10.3389/fphy.2023.1125548
Received: 16 December 2022; Accepted: 17 January 2023;
Published: 30 January 2023.
Edited by:
XinPei Lu, Huazhong University of Science and Technology, ChinaReviewed by:
Chen Zhaoquan, Anhui University of Technology, ChinaCopyright © 2023 Zhang, Gao and Ai. This is an open-access article distributed under the terms of the Creative Commons Attribution License (CC BY). The use, distribution or reproduction in other forums is permitted, provided the original author(s) and the copyright owner(s) are credited and that the original publication in this journal is cited, in accordance with accepted academic practice. No use, distribution or reproduction is permitted which does not comply with these terms.
*Correspondence: Yuan-Tao Zhang, eXR6aGFuZ0BzZHUuZWR1LmNu
Disclaimer: All claims expressed in this article are solely those of the authors and do not necessarily represent those of their affiliated organizations, or those of the publisher, the editors and the reviewers. Any product that may be evaluated in this article or claim that may be made by its manufacturer is not guaranteed or endorsed by the publisher.
Research integrity at Frontiers
Learn more about the work of our research integrity team to safeguard the quality of each article we publish.