- 1Key Lab of In-Fiber Integrated Optics, Ministry Education of China, Harbin Engineering University, Harbin, China
- 2National Demonstration Center for Experimental Physics Education, Harbin Engineering University, Harbin, China
- 3Photonics Research Center, Guilin University of Electronics Technology, Guilin, China
Investigating the thermal decomposition characteristics and mechanisms of nano- and submicron-aluminized 1,3,5-trinitro-1,3,5-triazine (RDX) is essential to optimize the formulations and improve combustion/detonation efficiencies. However, no research has focused on the microscopic scale of a single aluminized RDX particle. We demonstrate an all-fiber probing method for the violent thermal decomposition of a single nano-aluminized micron-RDX particle, which we address as micro-explosion in this paper. We believe studying micro-explosion will be beneficial to the research of thermal decomposition. In experiments, we first characterize the micro-explosion as a three-step process, i.e., melting, first decomposition, and second decomposition. Then, we measure micro-explosion properties, i.e., shockwave-like flow velocity, initiation energy threshold, and shockwave-like flow pressure. Among the aluminized RDX particles with 0%, 5%, 10%, 15%, 20%, 25%, and 30% surface coverage ratios (SCRs), the sample with 20% surface coverage ratio shows the highest flow velocity and force, which are about 69.9 mm/s and 39.4 μN, respectively. Moreover, the threshold decreases with rising surface coverage ratios, and the mean threshold of 30% surface coverage ratio is 75 μJ. The experimental results prove that the all-fiber micro-explosion probing method is feasible, safe, and robust.
1 Introduction
Energetic materials, e.g., explosives, pyrotechnics, and propellants, have a wide range of civilian and military applications. As a solid-propellant and an explosive, 1,3,5-trinitro-1,3,5-triazine (RDX) has drawn extensive attention [1, 2]. To improve combustion/detonation performance, RDX is usually mixed with metallic fuel particles (e.g., Al, Mg, B, and Zr) [3]. Al is the most popular additive for RDX due to its high enthalpy of combustion and low cost.
The combustion/detonation performance of aluminized RDX depends on the size of Al particles [4]. Coarse Al powder with a limited surface area has a high ignition threshold and low energy release rate, while nano- and submicron-Al particles with excellent dispersity have features of rapid combustion and large heat generation [5, 6]. It is known that thermal decomposition is the initial process of aluminized RDX combustion and detonation. Therefore, investigating the thermal decomposition characteristics and mechanisms of nano- and submicron-aluminized RDX is essential to optimize the formulations and improve combustion/detonation efficiencies.
Through simulations, some research has been performed to investigate the thermal pathways of nano-aluminized RDX. For example, X. -H. Ju et al. examined the thermal decomposition of RDX on nano-Al particles by reactive dynamics simulations using a parameterized reactive force field with low gradient correction (ReaxFF-lg). They confirmed that the energy release rate of RDX was dramatically enhanced by nano-Al [7]. Then, X. -H. Ju et al. simulate the thermal decomposition of RDX systems with Al, surface-nitrided Al, and surface-oxidized Al nano-particles. They found different thermal decomposition pathways for these particles [8]. S. Zhang et al. mixed partially passivated nano-Al particles with RDX, TNT, and TNT/RDX supercells. They proved that the thermal decomposition process of TNT/RDX/nano-Al has six stages by numerical calculations [4].
Because of lacking prior knowledge, it is not easy to acquire all intermediate processes in simulations. Therefore, much work has been dedicated to nano- and submicron-aluminized RDX decomposition experiments. For instance, D. E. G. Jones et al. studied the thermal decomposition behaviors of nano-Al, submicron-Al, and aluminized RDX powders. They proved Al’s reactivity decreased with rising particle diameter using differential scanning calorimetry (DSC), simultaneous thermogravimetry and differential thermal analysis (TG-DTA), and accelerating rate calorimeter (ARC) [9]. C. An et al. focused on the influence of nano-Al particles on the thermal decomposition of RDX. They found that the decomposition peak temperature of RDX was reduced by nano-Al particles [10]. H. Ren et al. integrated RDX with nano-Al particles and Viton using a two-solvent strategy. The thermal analysis indicated that nano-Al particles could accelerate the energy release of decomposition [11].
Despite the efforts on the thermal decomposition of nano- and submicron-aluminized RDX, no research has focused on the dynamic physiochemical process of a single aluminized RDX particle. Experiments of a single aluminized RDX particle could provide a better understanding of how Al particles affect the thermal decomposition of RDX.
This paper demonstrates an all-fiber probing method for the thermal decomposition of a single nano-aluminized micron-RDX particle. A microfabricated fiber probe locally coated with gold absorbs energy from laser pulses and transfers heat to the surface of an aluminized RDX particle. As a result, the particle absorbs heat rapidly and undergoes a violent thermal decomposition. We find that a single particle’s violent thermal decomposition shows micro-scale phenomena (e.g., dispersion of product particles and gas flow with a shockwave-like morphology) that mimic the macro-scale phenomena of an explosion [12–14]. Thus, we define the violent thermal decomposition of a single particle as micro-explosion. Note that the definition of micro-explosion here differs from the one applied in the combustion process of slurry droplet fuels [15–18]. The micro-explosion process is simultaneously recorded by a homemade fiber Fabry-Perot (F-P) pressure sensor and a high-speed camera. The all-fiber micro-explosion probing method is cost-effective, robust, and environmentally insensitive. In addition, as the mass of the aluminized explosive is minimal, it is safe to carry out the experiments in labs without explosion protection equipment. Therefore, we believe the micro-explosion probing method could be an alternative to conventional methods (e.g., DSC, TG-DTA, ARC) for studying aluminized RDX thermal decomposition.
2 Materials and methods
2.1 Materials
2.1.1 Nano-aluminized micron-RDX particle
We use magnetron sputtering to coat nano-Al particles (purity 99.999%) on the surface of a micron-RDX particle, maximizing reactive surface area. The mean particle sizes of nano-Al and micron-RDX are about 400 nm and 10 μm, respectively. The radio frequency sputter (JS-1600, HTCY) works under vacuum conditions. Figure 1A shows the optical micrograph of an uncoated micron-RDX particle. Figure 1B shows that the surface of the micron-RDX particle is uniformly coated with nano-Al. The density of nano-Al deposited on the surface of RDX particles is controllable by adjusting the sputtering time. For subsequent experiments, aluminized micron-RDX particles with different surface coverage ratios (SCRs, i.e., 0%, 5%, 10%, 15%, 20%, 25%, and 30%) are obtained. The SCRs are calculated using micrographs like Figure 1B with ImageJ (RRID: SCR_003070).
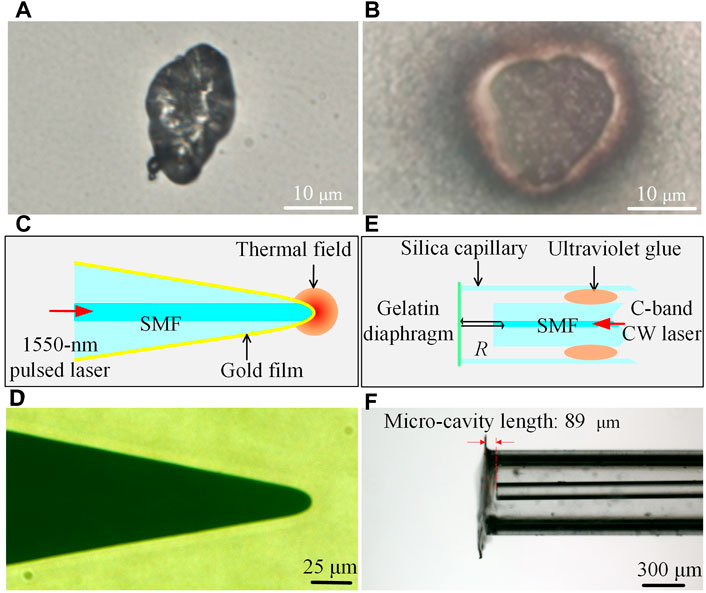
FIGURE 1. Preparation of the materials. (A) An uncoated micron-RDX particle. (B) A micron-RDX particle coated with coated nano-Al. (C) Schematic of the fiber probe. (D) Picture of the fiber probe. (E) Schematic of the fiber F-P sensor. (F) Picture of the fiber F-P sensor. The micro-cavity length is 89 μm.
2.1.2 The fiber probe for heat generation
We micro-fabricate a segment of single-mode fiber (SMF, FullBand G.652, YOFC) to acquire a fiber probe with a gold-coated parabolic-shaped tip using a unique three-step procedure. The SMF fiber has an effective group index of refraction of 1.476 at 1,550 nm and a mode field diameter of ∼10.3 μm at 1,550 nm. The first step is selective chemical etching. The chemical etching solution comprises hydrofluoric acid (HF) and xylene C8H10 [19]. The volume ratio for HF and C8H10 is 1.5:1. The SMF is inserted into the etching solution for 60 min at room temperature, and a cone-shaped fiber tip is achieved. The second step is discharged current fusion molding. We generate a single arc discharge with a short fusion time using a fusion splicer (FSM-100P+, Fujikura). The arc discharge molds the cone-shaped fiber tip into a parabolic-shaped one. In the final step, we use the sputter JS-1600 to realize gold coating on the surface of the parabolic-shaped fiber tip. When pumped with a pulsed laser, the fiber probe can efficiently absorb heat from laser pulses due to multiple total reflections, generating a thermal field to initiate micro-explosion (Figure 1C). Figure 1D shows the optical micrograph of the fiber probe.
2.1.3 The fiber F-P pressure sensor
We combine an SMF (FullBand G.652, YOFC), a silica capillary, and a gelatin diaphragm to fabricate a fiber F-P pressure sensor. First, a gelatin diaphragm is fixed on an end face of a small segment of silica capillary with ultraviolet glue. The thickness of the gelatin diaphragm is 800 nm, and the glass capillary has an inner diameter of 400 μm. Then, an SMF is inserted in the silica capillary through the other end face. The position of the SMF is adjusted by a motorized micromanipulator (MP-225, Sutter Instrument). Next, we coaxially align the SMF and the silica capillary, whose end faces are separated by 89 μm. As a result, a microcavity is formed between the SMF and the gelatin diaphragm. At last, we seal the microcavity and fix the SMF with ultraviolet glue. When the SMF is pumped with a laser, the fiber F-P microcavity can detect external pressure variation through the deflection of the gelatin diaphragm (Figure 1E). Figure 1F shows the optical micrograph of the F-P pressure sensor.
2.2 Methods
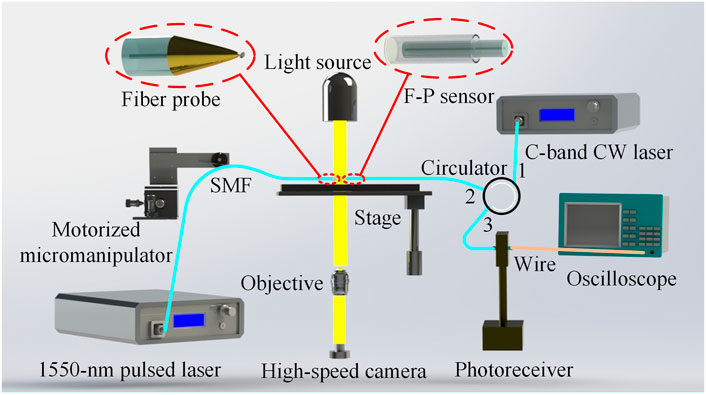
As shown in Figure 2, the experimental setup comprises three parts, the micro-explosion initiation module, the pressure sensing module, and the microscope.
The micro-explosion initiation module includes a 1,550-nm pulsed laser (VFLS-1550-M-PL, Connet), the motorized micromanipulator (MP-225, Sutter Instrument), and the micro-fabricated fiber probe. The 1,550-nm pulsed laser characterizes a 1-MHz repetition rate and a 10-ns full-width-at-half-maximum (FWHM) pulse width. The pulsed laser’s single-mode pigtail (SMF-28, Corning) is spiced to the micro-fabricated fiber probe. The pulses from the laser are injected into the fiber probe, providing a thermal field to initiate the micro-explosion. The motorized micromanipulator holds part of the laser pigtail, controlling the micro-explosion initiation position on the aluminized RDX.
The pressure sensing module is composed of the fiber F-P pressure sensor, a C-band wavelength-tunable continuous wave (CW) laser (VLSP-C-M-TL, Connet), a circulator, an InGaAs photoreceiver (Model 2117-FC, New Focus), and a digital storage oscilloscope (SDS6000A, Siglent). The CW laser’s single-mode pigtail (SMF-28, Corning) and the fiber sensor are spiced to Port 1 and Port 2 of the circulator, respectively. The photoreceiver and Port 3 of the circulator are connected. The laser is pumped into the microcavity of the fiber F-P pressure sensor through the circulator. The photoreceiver collects the reflected light from the sensor through the circulator and sends the amplified electrical signal to the digital storage oscilloscope through a variable bandpass filter. The pressure variation originating from the micro-explosion can be acquired by interpreting the waveform.
Aluminized RDX sample is placed on a two-dimensional stage of an inverted microscope (IX73, Olympus). The fiber probe and the F-P pressure sensor, whose optical axes are aligned with each other, are located on each side of the sample. The microscope’s light source illuminates the aluminized RDX sample, and a high-speed camera (Mini AX100, Photron) records the micro-explosion process through a ×40 objective. The camera’s maximum frame rate is 13,600 fps for a 512 × 512 image, capable of measuring micro-explosion thresholds and velocities.
3 Results and discussion
3.1 Characterization of the fiber F-P pressure sensor
To characterize the performance of the fiber F-P pressure sensor, we conduct a static pressure test [20–22]. Figure 3A shows the static pressure test setup, including a supercontinuum white light laser (SuperK COMPACT, NKT Photonics), a circulator, a syringe pump (LSP01-1A, Longer Pump), and an optical spectrum analyzer (OSA, AQ6373, Yokogawa). We seal the pressure sensor inside the syringe pump. The supercontinuum white light laser’s single-mode pigtail and the OSA are connected to Port 1 and Port 3 of the circulator, respectively. The fiber sensor is spiced to Port 2 of the circulator. We pump the laser into the microcavity of the fiber F-P pressure sensor through the circulator. The OSA collects the reflected light from the sensor through the circulator. Figure 3B shows the spectra collected under different pressures applied by the syringe pump. As the rising pressure deforms the diaphragm and reduces the F-P micro-cavity length, the fringes shift toward the shorter wavelength. Figure 3C shows the relationship between valley wavelength λ and pressure P. According to the linear fitting, the wavelength shift caused by pressure P is 0.376 nm/kPa. The length of the micro-cavity d can be demodulated by
where λ1 and λ2 are adjacent valley wavelengths of the same fringe [23]. Thus, the micro-cavity length of the sensor is ∼89 μm, in agreement with the value in Figure 1F. Thus, fringes and Eq. 1 can acquire the diaphragm deflection Δd originating from pressure. Figure 3C shows the relationship between diaphragm deflection Δd and pressure P. According to the linear fitting, the sensor’s pressure sensitivity between 0 and 24 kPa is 0.055 μm/kPa.
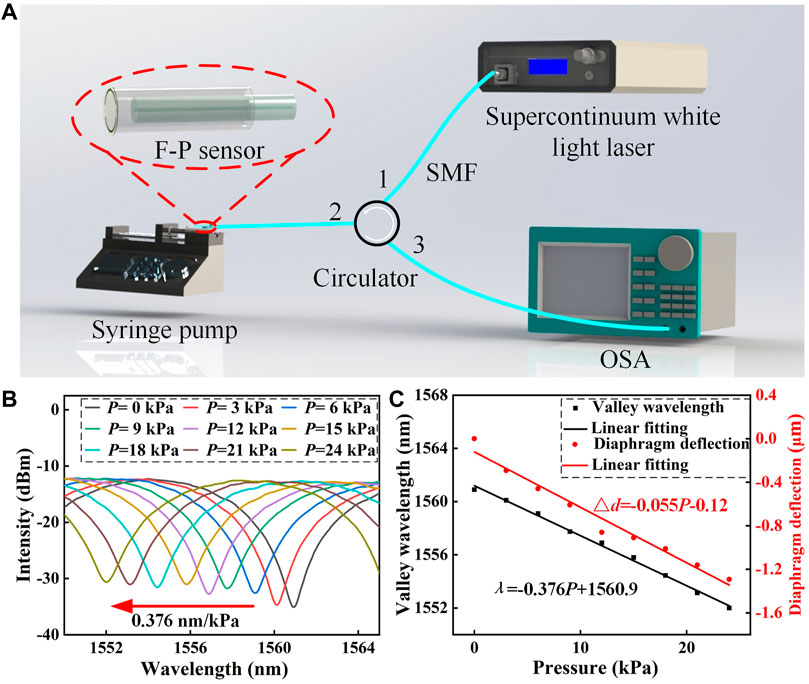
FIGURE 3. Static pressure test of the fiber F-P sensor. (A) Experimental setup of the static pressure test. This figure is not to scale. (B) Spectra collected under different pressures. (C) The relationship between valley wavelength λ and pressure P, and the relationship between diaphragm deflection Δd and pressure P.
3.2 Measurement of micro-explosion properties
To prove the probing method’s capability, we first characterize the process of nano-aluminized micron-RDX micro-explosion. The typical process of RDX thermal decomposition includes three steps, which are melting, first decomposition, and second decomposition [2]. Melting is an endothermic process, while first decomposition and second decomposition are exothermic processes. Figure 4A (the frame rate is 2000 frames and 1,024 × 1,024 image of the original video) confirms that micro-explosion is composed of melting, first decomposition, and second decomposition. First, the pulses from the 1,550-nm laser accumulate energy on the gold film of the fiber probe and elevate the temperature applied to the sample, causing melting. The pictures at t0 and t1 show the process of melting, during which the sample becomes spherical. Then, the first decomposition occurs, slowly releasing heat and spreading reaction products, as shown in pictures at t2 and t3. Slight mass loss can be observed during the first decomposition. At last, the second decomposition generates a gas flow with a shockwave-like morphology, which mainly propagates along the optical axis of the fiber probe. As shown in pictures at t4 − t7, some reaction products spread with the shockwave-like flow, indicating the flow front. Red dashed lines mark the locations of the flow fronts at different moments. The second decomposition is accompanied by enormous mass loss. Then, we measure micro-explosion properties, i.e., shockwave-like flow velocity, initiation energy threshold, and shockwave-like flow pressure.
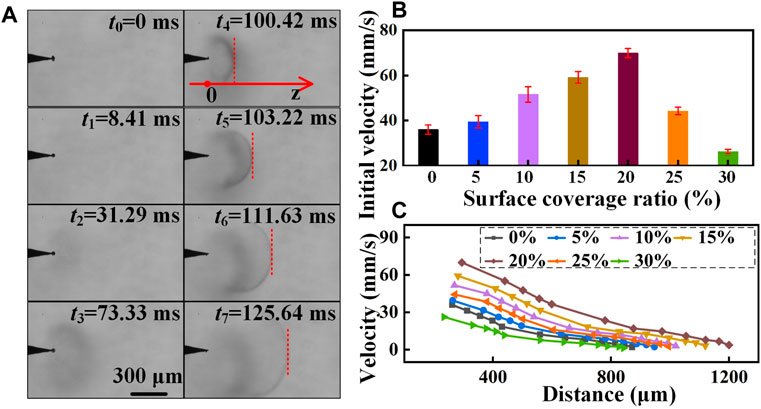
FIGURE 4. The process of micro-explosion. (A) Pictures of micro-explosion acquired at different moments. The dashed red lines indicate the flow fronts of shockwave-like flow. (B) The relationship between the initial flow velocity and surface coverage ratio. Error bars represent standard error. (C) The relationship between the flow velocity and the distance. The distance is calculated from the fiber probe tip to the flow front along the optical axis.
3.2.1 Shockwave-like flow velocity
We measure the velocities of aluminized micron-RDX particles with different SCRs (i.e., 0%, 5%, 10%, 15%, 20%, 25%, and 30%). The shockwave-like flow velocities are acquired by frame-to-frame analysis. Figure 4B shows the relationship between the initial flow velocity and SCR. The initial velocity is acquired at the first moment (e.g., t4) when a clear flow front forms. The measurement of each SCR is conducted 10 times. Note that the laser power stays unchanged during the 10 × 7 measurements. The mean initial velocities of 0%, 5%, 10%, 15%, 20%, 25%, and 30% SCRs are about 36.0, 39.5, 51.6, 59.1, 69.9, 44.2, and 26.2 mm/s, respectively. It can be found that the initial velocity first increases and then decreases with rising SCRs. The initial velocity reaches the maximum when the SCR is 20%. The reason for the rise of the initial velocity under 20% SCR is that the nano-Al can catalyze the micro-explosion process, enhancing the second decomposition. However, a high SCR of Al restricts the propagation of flows, reducing the initial velocity of micro-explosions.
Figure 4C shows the relationship between the flow velocity and the distance. The distance is calculated from the fiber probe tip to the flow front along the optical axis. It can be found that the velocity decreases with increasing distance. Moreover, the locations where flow fronts form are closer to the fiber probe tip with lower initial velocities.
3.2.2 Initiation energy threshold
We measure the initiation energy thresholds of aluminized micron-RDX particles with different SCRs. The initiation energy threshold is the energy of laser pulses, which will lead to a micro-explosion. The energy is integrated from the moment when the laser is turned on to the beginning of the second decomposition. Figure 5 shows the relationship between the initiation energy threshold and SCR. The measurement of each SCR is conducted 10 times. Note that the laser power stays unchanged during the 10 × 7 measurements. The mean thresholds of 0%, 5%, 10%, 15%, 20%, 25%, and 30% SCRs are about 115, 112, 108, 102, 96, 84, and 75 μJ, respectively. It can be found that the threshold decreases with rising SCRs. The threshold is at the maximum when the SCR is 0%. The threshold reduction is attributed to the catalyzation of nano-Al particles.
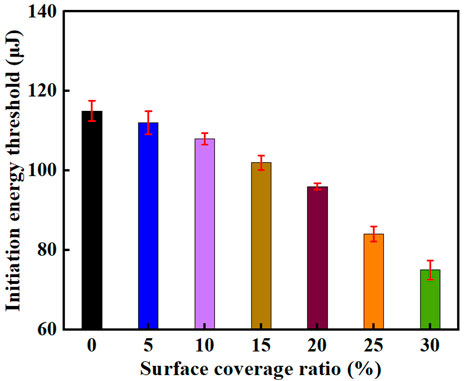
FIGURE 5. The relationship between the initiation energy threshold and surface coverage ratio. Error bars represent standard error.
3.2.3 Shockwave-like flow pressure
We measure the shockwave-like flow pressure using the fiber F-P pressure sensor. The distance between the sensor and the probe is about 300 μm along the optical axis. To achieve a high-frequency response to flow pressure, we replace the setup in Figure 3A with the one in Figure 2. The wavelength of the C-band CW laser is tuned to a quadrature point of the fringe of zero external pressure. The signal from the sensor is detected by the photoreceiver and displayed by the oscilloscope. The relationship between the reflected light intensity IR and the micro-cavity length d is
where R is the reflectivity of the micro-cavity, λ0 is the wavelength of the C-band laser, n is the refractive index of the micro-cavity medium, and I0 is the input light intensity. As mentioned above, we have acquired the relationship between diaphragm deflection Δd and pressure P. Thus, the flow pressure can be real-time demodulated using the waveform recorded by the oscilloscope and Eq. 2.
Figure 6 shows the shockwave-like flow pressures and corresponding forces of different SCRs as a function of time. Note that the laser power stays unchanged during the seven measurements. The high-frequency vibrations of the traces in Figure 6 are attributed to the impacts of the reaction products. The envelopes of the traces depict the flow propagations. The peak forces of 0%, 5%, 10%, 15%, 20%, 25%, and 30% SCRs are about 9.1, 22.2, 32.4, 32.9, 39.4, 26.6, and 24.4 μN, respectively. It can be found that the peak force first increases and then decreases with rising SCRs. The peak force reaches the maximum when the SCR is 20%. Moreover, the vibration signal duration is shorter when the peak force is larger. These experimental results correspond to those in Figures 4B, C.
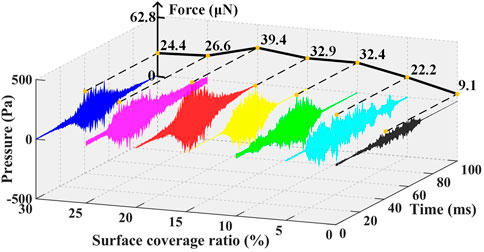
FIGURE 6. The shockwave-like flow pressures and corresponding forces of different surface coverage ratios as a function of time.
4 Conclusion
In conclusion, we demonstrate an all-fiber probing method for the micro-explosion of nano-aluminized micron-RDX particles. A microfabricated gold-coating fiber probe absorbs energy from laser pulses, heating an aluminized RDX particle through thermal conduction. As a result, the particle rapidly absorbs heat and undergoes the process of micro-explosion. A homemade fiber F-P pressure sensor and a high-speed camera simultaneously record the micro-explosion process. In experiments, we first characterize the micro-explosion as a three-step process, i.e., melting, first decomposition, and second decomposition. Then, we perform measurements of micro-explosion properties, i.e., shockwave-like flow velocity, initiation energy threshold, and shockwave-like flow pressure. Among the aluminized RDX particles with 0%, 5%, 10%, 15%, 20%, 25%, and 30% SCRs, the sample with 20% SCR has the highest flow velocity and force, which are about 69.9 mm/s and 39.4 μN, respectively. These results are attributed to the tradeoff between catalyzation and restriction of nano-Al particles. Moreover, the threshold decreases with rising SCRs, and the mean threshold of 30% SCR is 75 μJ. The all-fiber micro-explosion probing method is cost-effective, robust, and environmentally insensitive. Due to the minimal mass of the aluminized RDX, it is safe to carry out the experiments without explosion protection equipment. Furthermore, the movement of the fiber probe can adjust the shockwave-like flow propagation direction, providing additional flexibility for future applications. Therefore, we believe the micro-explosion probing method will be a powerful tool for studying aluminized RDX.
Data availability statement
The original contributions presented in the study are included in the article/supplementary material, further inquiries can be directed to the corresponding author.
Author contributions
Conception, YuZ, WS, YQ, WJ, YaZ, ZL, and LY; Investigation, YuZ, WS, YQ, WJ, YaZ, ZL, and LY; Design, YuZ, WS, YQ, WJ, YaZ, ZL, and LY; Software, WS; Data acquisition, YuZ, WS, YQ, WJ, YaZ, ZL, and LY; Analysis, YuZ, WS, YQ, WJ, YaZ, ZL, and LY; Original draft, YuZ, WS, YQ, WJ, YaZ, ZL, and LY; Review and editing, YuZ, WS, YQ, WJ, YaZ, ZL, and LY; Supervision, YuZ, YQ, YaZ, ZL, and LY; Project administration, YuZ, YQ, YaZ, ZL, and LY; Funding acquisition, YuZ, YQ, YaZ, ZL, and LY. All authors approved the submitted version.
Funding
This work was supported by the National Natural Science Foundation of China (61975039, 62175046, 62205086); China Postdoctoral Science Foundation (2022M720940); Heilongjiang Provincial Natural Science Foundation of China (YQ2020F011); the 111 Project (B13015); Fundamental Research Funds of Harbin Engineering University.
Conflict of interest
The authors declare that the research was conducted in the absence of any commercial or financial relationships that could be construed as a potential conflict of interest.
Publisher’s note
All claims expressed in this article are solely those of the authors and do not necessarily represent those of their affiliated organizations, or those of the publisher, the editors and the reviewers. Any product that may be evaluated in this article, or claim that may be made by its manufacturer, is not guaranteed or endorsed by the publisher.
References
1. Khichar M, Patidar L, Thynell S. Comparative analysis of vaporization and thermal decomposition of cyclotrimethylenetrinitramine (RDX). J Propul Power (2019) 35:1098–107. doi:10.2514/1.b37643
2. Pagoria PF, Lee GS, Mitchell AR, Schmidt RD. A review of energetic materials synthesis. Thermochim Acta (2002) 384:187–204. doi:10.1016/s0040-6031(01)00805-x
3. Hao W, Niu L, Gou R, Zhang C. Influence of Al and Al2O3 nanoparticles on the thermal decay of 1,3,5-trinitro-1,3,5-triazinane (RDX): Reactive molecular dynamics simulations. J Phys Chem C (2019) 123:14067–80. doi:10.1021/acs.jpcc.9b03575
4. Meng J, Wang C, Cheng M, Zhang S, Gou R, Chen Y, et al. The thermal decomposition behavior of the TNT-RDX-Al explosive by molecular kinetic simulation. Int J Quan Chem. (2021) 121:e26635. doi:10.1002/qua.26635
5. Sundaram D, Yang V, Yetter RA. Metal-based nanoenergetic materials: Synthesis, properties, and applications. Prog Energ Combust. Sci. (2017) 61:293–365. doi:10.1016/j.pecs.2017.02.002
6. Sergienko AV, Popenko EM, Slyusarsky KV, Larionov KB, Dzidziguri EL, Kondratyeva ES, et al. Burning characteristics of the HMX/CL-20/AP/polyvinyltetrazole binder/Al solid propellants loaded with nanometals. Propellants Explos Pyrotech (2019) 44:217–23. doi:10.1002/prep.201800204
7. Mei Z, An Q, Zhao F-Q, Xu S-Y, Ju X-H. Reactive molecular dynamics simulation of thermal decomposition for nano-aluminized Explosives. Phys Chem Chem Phys (2018) 20:29341–50. doi:10.1039/c8cp05006f
8. Zhao Y, Zhao F-Q, Xu S-Y, Jua X-H. Molecular reaction dynamics simulation of thermal decomposition for aluminiferous RDX composites. Comp Mater Sci (2020) 177:109556. doi:10.1016/j.commatsci.2020.109556
9. Kwok QSM, Fouchard RC, Turcotte AM, Lightfoot PD, Bowes R, Jones DEG. Characterization of Aluminum nanopowder compositions. Propellants Explos Pyrotech (2002) 27:229–40. doi:10.1002/1521-4087(200209)27:4<229::aid-prep229>3.0.co;2-b
10. Hou C, Geng X, An C, Wang J, Xu W, Li X. Preparation of Al nanoparticles and their Influence on the thermal decomposition of RDX. Cent Eur J Energ Mater (2013) 10:123–33.
11. Yan T, Ren H, Liu J, Jiao Q. Facile preparation and synergetic energy releasing of nano-Al@RDX@Viton hollow microspheres. Chem Eng J (2020) 379:122333. doi:10.1016/j.cej.2019.122333
12. He S, Tan K, Song Q, He G, Cao W. Thermally stable and low-sensitive aluminized explosives with improved detonation performance. Propellants Explos Pyrotech (2021) 46:1428–35. doi:10.1002/prep.202100047
13. Zhang K, Feng X, Zhao J, Feng B, Wang X. Effect of aluminum powder content on air blast performance of RDX-based explosive grenade charge. Adv Mater Sci Eng (2022) 2022:1–7. doi:10.1155/2022/1751182
14. Wang H, Liu Y, Bai F, Huang F. Study on the reaction rate model for shock initiation of aluminized hexahydro-1, 3, 5-trinitro-1, 3, 5-triazine (RDX) explosive under shock waves. J Appl Phys (2021) 129:215902. doi:10.1063/5.0048443
15. Kadota T, Yamasaki H. Recent advances in the combustion of water fuel emulsion. Prog Energ Combust Sci (2002) 28:385–404. doi:10.1016/s0360-1285(02)00005-9
16. Gan Y, Qiao L. Combustion characteristics of fuel droplets with addition of nano and micron-sized aluminum particles. Combust Flame (2011) 158:354–68. doi:10.1016/j.combustflame.2010.09.005
17. Morozumi Y, Saito Y. Effect of physical properties on microexplosion occurrence in water-in-oil emulsion droplets. Energy Fuels (2010) 24(3):1854–9. doi:10.1021/ef9014026
18. Teixeira AR, Hermann RJ, Kruger JS, Suszynski WJ, Schmidt LD, Schmidt DP, et al. Microexplosions in the upgrading of biomass-derived pyrolysis oils and the effects of simple fuel processing. ACS Sustain Chem Eng (2013) 1(3):341–8. doi:10.1021/sc300148b
19. Tao M, Jin Y, Gu N, Huang L. A method to control the fabrication of etched optical fiber probes with nanometric tips. J Optics-uk (2009) 12:015503. doi:10.1088/2040-8978/12/1/015503
20. Xu F, Ren D, Shi X, Li C, Lu W, Lu L, et al. High-sensitivity Fabry–Perot interferometric pressure sensor based on a nanothick silver diaphragm. Opt Lett (2012) 37(2):133–135. doi:10.1364/ol.37.000133
21. Guo F, Fink T, Han M, Koester L, Turner J, Huang J. High-sensitivity, high-frequency extrinsic Fabry–Perot interferometric fiber-tip sensor based on a thin silver diaphragm. Opt Lett (2012) 37(9):1505–1507. doi:10.1364/ol.37.001505
22. Ma J, Jin W, Ho HL, Dai JY. High-sensitivity fiber-tip pressure sensor with graphene diaphragm. Opt Lett (2012) 37(13):2493–2495. doi:10.1364/ol.37.002493
Keywords: fiber optics, fiber optics sensor, aluminized RDX, nano-Al particle, thermal decomposition
Citation: Zhang Y, Su W, Qin Y, Jin W, Zhang Y, Liu Z and Yuan L (2023) All-fiber probing of aluminized RDX particle micro-explosion. Front. Phys. 11:1123818. doi: 10.3389/fphy.2023.1123818
Received: 14 December 2022; Accepted: 13 January 2023;
Published: 26 January 2023.
Edited by:
Shuo Liu, Hebei University of Technology, ChinaCopyright © 2023 Zhang, Su, Qin, Jin, Zhang, Liu and Yuan. This is an open-access article distributed under the terms of the Creative Commons Attribution License (CC BY). The use, distribution or reproduction in other forums is permitted, provided the original author(s) and the copyright owner(s) are credited and that the original publication in this journal is cited, in accordance with accepted academic practice. No use, distribution or reproduction is permitted which does not comply with these terms.
*Correspondence: Yifan Qin, cTEwMjVoYjAwN0AxNjMuY29t
 Yu Zhang1
 Wenjie Su
 Yifan Qin
 Yaxun Zhang