 Mira Sibai1
 Hussein Mehidine
 Darine Abi Haidar
- 1Université Paris-Saclay, CNRS/IN2P3, IJCLab, Orsay, France
- 2Université Paris Cité – Faculté de Médecine Paris Descartes, Paris, France
- 3Service de Neurochirurgie, Hôpital Lariboisière, Paris, France
- 4Service de Neurochirurgie, Pôle Neurosciences, GHU-Paris, Paris, France
- 5Université Paris Cité, IJCLab, Orsay, France
Introduction: Fibred-based optical spectroscopy is advantageous over imaging due to its sensitivity, practicality and precision, providing point of care diagnosis. The unique advantage is that the sampled volume is well defined by the source-detector geometry and that the functionality of multiple optical techniques can be incorporated into one probe so that more information is gained without extra bulkiness or cost, while also mitigating the limitations of each.
Methods: This advantage is utilized here to address the limited accuracy in delineating brain tumors, in situ, by simultaneously characterizing tissue based on the spectral and lifetime properties of five endogenous fluorophores commonly present in brain tissue. A 5-meters multi fibre-optic probe custom-built for neurosurgery guidance with a sterilizable distal end is presented in this paper. It describes its technical features such as architecture, collection efficiency, sensitivity.
Results and discussion: The developed probe have a temporal resolution of 34.6 ps and a temporal impulse response function of 29 ps. The spatial resolution was around 153 μm while the spectral resolution is 1 nm. All of these specifications are ensured under 1 second as acquisition time. The probe is validated using fluorescent dyes and tissue phantoms. Additionally, the fluorescence spectra from fresh and frozen animal tissue and from an epileptic patient are compared to that obtained from confocal fluorescence microscopy, while the lifetime values are compared to that reported in literature. Finally, the effect of pressure applied to the probe in contact with tissue is discussed.
1 Introduction
The translation of optical devices based on fibre-optic light delivery/collection into the clinical setting has gained significant momentum driven by its diagnostic/therapeutic value and its ease of use. Due to the biophysical properties of light, optical measurements uniquely sample tissue at the molecular level, and thus can probe cells, proteins, and tissue. The biological information retrieved from optical measurements depends on the light-tissue interaction taking place, from assessing the changes in the concentration of biomolecules to probing changes in their shape and orientation that manifest during pathogenesis [1]. In the case of diffuse reflectance measurements, the detected signal is a result of multiple elastic scattering and absorption events. Extracting the wavelength-dependent absorption coefficient allows the determination of the concentration of macromolecules such as haemoglobin, lipids, and melanin [1], while the reduced scattering coefficient is modulated by the concentration and distribution of organelles with varying index of refraction such as at the interface of cellular membranes, collagen fibrils, lysosomes and mitochondria [1]. During breast tumor surgery, for example, changes in the reduced scattering coefficient provided more useful diagnostic information compared to monitoring blood oxygenation and total haemoglobin content [2]. In addition, when fluorescence is combined with diffuse reflectance measurements, the fluorophore concentration can be extracted [3].
Fibre-optical probes used in research hospitals are being evaluated for its efficacy to guide surgery [4–7], monitor tissue response to treatment [8, 9], and to obtain an optical biopsy [10–12]. The architecture of fibred probes differs according to application as well as the optical contrast that is being measured. A fibre-optic probe measuring both the steady-state diffuse reflectance and fluorescence can be configured so that both excitation light sources are guided by the same fibre, while several collection fibres are placed in the periphery or linearly at different source detector separations so that the tissue optical properties can be extracted from the diffusion Eq. 13. While previously lagging behind, probes measuring time-resolved fluorescence are slowly entering clinical studies with the advent of faster detectors and pulsed lasers [13]. A promising example is the bifurcated sterilizable probe designed for in vivo intensity and time-resolved fluorescence detection to distinguish between low-grade glioma and normal white matter [14]. Although point-based measurements suffer from mis-sampling errors, fibre-based optical spectroscopy still surpasses imaging in its sensitivity, acquisition speed, practicality and precision, providing point of care diagnosis. The unique advantage of using fibre-optic probes over wide-field imaging is that the sampled volume is well-defined by the source-detector geometry and that the functionality of multiple optical techniques can be incorporated into one probe so that more information about relevant physiological parameters could be extracted without extra bulkiness or cost, while also mitigating the limitations of each [15]. Since lifetime measurements are insensitive to variations in probe to tissue distances or tissue optical properties, they are well suited for a dual modality system such as the system developed by Dochow et al [16].
Translation of intraoperative multimodal fibred-based detection in to the neurosurgical suite is severely lagging due to additional constraints such as further miniaturization of the probe, a sterilizable distal end and the need for rapid acquisition and analysis. Here, we present a novel bimodal spectroscopy device, which combines spectrally- and temporally-resolved fluorescence measurements and is optimally designed for seamless surgical guidance with high temporal (35 ps), spatial (<0.3 mm), and spectral resolution (1 nm) obtained in under one second. Three main characteristics make our probe novel: 1) its ability to simultaneously detect five endogenous fluorophores under one excitation light (405 nm); 2) its hardware is modular in the sense that the probe head used by the surgeon can be sterilized, while the proximal end of the probe (5 m) and black box housing the remaining optical components can be placed in the non-sterile area of the operation room (OR) without affecting the quality of the measurements or intervention; 3) the custom software allows for immediate visualization of the autofluorescence spectrum and lifetime decay profile for each fluorophore with a single-click operation. Post measurement, a custom python-based program is implemented for spectral and lifetime fitting upon one click to retrieve quantitative information. Although the probe design and its development are optimized for epileptic and brain tumor surgery based on the feedback from the co-author at GHU Paris Psychiatrie et Neuroscience Hospital (B.D). It is compatible and useful for any open (or minimally invasive) surgery or in situ tissue monitoring during medical intervention. The probe specifically measures the fluorescence emitted by NADH, flavins (FAD), lipopigments, porphyrin I and porphyrin II, all of which are altered in the brain with the onset of disease [10, 17, 18]. The quantitative metrics of interest in brain cancer or epilepsy are primarily related to the energetic metabolism as mirrored in the FAD/NADH ratio [18], the oxidative stress, as portrayed by the Lipopigments to porphyrin ratio [19, 20], and the degree of vascularization as portrayed by the porphyrin to NADH ratio [21]. Additionally, changes in the short and long fluorescence lifetime of NADH (FAD) are directly related to the conversion of free NAD + (FAD) to bound NADH(FAD) signifying altered metabolic states as seen in hypoxic or inflamed regions [22].
This report starts with Monte Carlo (MC) simulations to characterize the collection efficiency and tissue volumes interrogated by the probe using a customized version of the Monte Carlo multi-layered code by Wang et al. [23]. The spatial resolution and optimal probe to tissue distance is theoretically calculated for a non-turbid medium and then experimentally determined for a turbid medium. Moreover, fluorescent dyes and tissue-simulating phantoms are both used to validate the linearity, the stability, the sensitivity as well as the temporal impulse response of the system. Ex vivo measurements of different organs taken from a rodent model and from human brain biopsy samples are performed. The spectral shapes are compared with those obtained from a 405 nm confocal fluorescence microscope at similar regions of interests, while the fluorescence lifetimes are compared to literature. Finally, the effect of pressure applied to tissue by the probe is experimentally tested. Ongoing ex vivo measurements of freshly excised brain tissue are being performed to delineate optical markers that can best characterize different brain tissue types, healthy and diseased, before moving the system into the OR. The end goal is to enhance needle biopsy and resection surgery by a high information content comprising relevant physiological and metabolic information in situ, unavailable by any other intraoperative technology.
2 Materials and methods
2.1 Probe design
The architecture of fibre-optic probes differs according to application and the corresponding requirements. Each design directly impacts light delivery and propagation into tissue, collection efficiency as well as the origin of the collected light [24]. The probe that is presented in this work is custom designed based on a multifibre bifurcated architecture. The architecture and probe geometry was optimized by Monte Carlo simulations [25, 26]. This included selecting the diameter of the illumination and collection fibres, the separation distance, the angle between the two fibres [25, 26]. Eight multimode fibres are housed in a stainless-steel casing with a sapphire window (diameter of 8 mm) at the distal end that can be disinfected with isopropyl alcohol during surgery. A ring of seven detection fibres surrounds one central illumination fibre. Of the seven, two contralateral fibres collect time-resolved fluorescence at five spectral bandwidths, while the remaining five fibres collect spectrally-resolved fluorescence. All fibres are made of UV-grade silica/silica with a nominal NA of 0.22. The core of the illumination fibre is 200 µm while that of the source-to-detector separation is 600 μm, from centre to centre. Figure 1 shows images of the whole system (Figure 1B), the black box housing all optical components (Figures 1A, B), the probe head (Figure 1C) and the sample holder used for ex vivo measurements (Figure 1C). The probe is coupled to the laser and detectors in the black box via SMA connectors (Figure 1A). The black box contains the 40 MHz pulsed 405 nm collimated excitation source (LDH-P-C-405B, Picoquant, Germany) coupled into the illumination fibre. The box also houses the photomultiplier tube and TCSCP acquisition card (PMA 182 and Time Harp 200, Picoquant, Germany) for fluorescence lifetime detection (Figure 1B). A filter wheel (FW102C, Thorlabs, Newton, United States) is placed in front of the detector with five bandpass filters: 450 ± 10 nm, 520 ± 10 nm, 550 ± 30 nm, 620 ± 10 nm and 680 ± 10 nm. A filter wheel is also placed in front of the spectrometer (QE Pro OceanOptics, Florida, United States), where the choice of a 450 nm high pass filter or the bandpass filters appropriate for the five fluorophores is available.
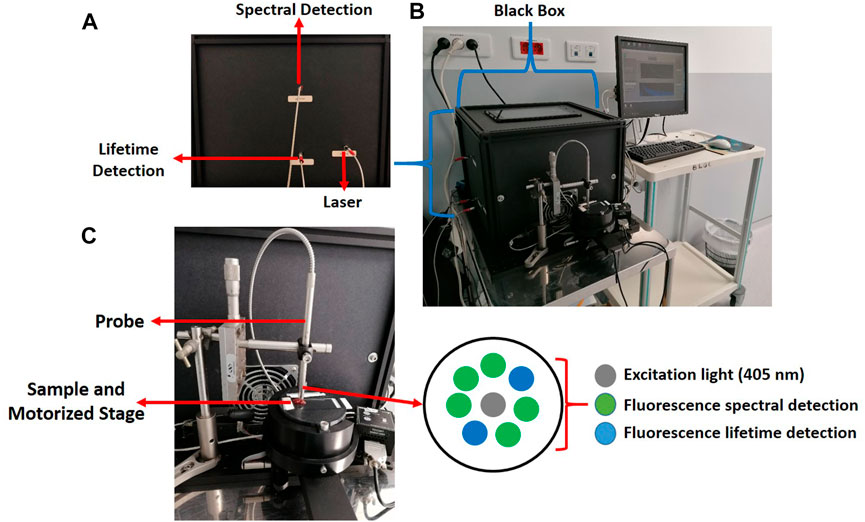
FIGURE 1. Instrumental setup of our spectroscopic probe stationed in the neurosurgical suite at GHU Paris Psychiatrie et Neuroscience Hospital. (A) Side view of one side of the black box with three optical leads exiting the box that are grouped into the bifurcated probe. (B) Photo of the whole system: The black box containing the optical components, the fibre-optic probe fixed vertically over a motorized sample stage, the accompanying computer for direct acquisition and analysis; (C) a close-up photograph of the probe with a biopsy sample positioned for measurements with showing the multi fibres architecture.
2.2 Acquisition and analysis
The probe is fixed above a 2D precision translation stage (Figure 1C), where the sample is placed. The probe can be translated vertically in steps of 1 mm, while the sample stage can be translated in the xy plane in steps of 0.1 mm at a speed of 0.3 mm/s. Measurements are carried out at 40.106 pulses per second with energy output of approximately 1 μJ/pulse. For in vivo measurements, the probe head is free to move as dictated by the surgeon. The 5-meter cable connecting the black box to the distal end of the probe is long and flexible enough to be utilized safely in the OR, while the black box containing the illumination source and detection system can be placed in the non-sterilized area. A homemade LabView acquisition interface (Figure 1B) allows for real-time visualization of the spectral and lifetime decay signal as well as control of the acquisition time (separate for each mode), the choice of applied filters (separate for each mode), dark count correction, and the frequency of signal averaging. Post-measurement, a python-based GUI allows for fast spectral and temporal analysis. The fluorescence lifetime decay signal under a given detection band is fit to a mono (Porphyrins I and II, lipopigments) or bi-exponential decay function [27] (NADH and FAD). The fluorescence spectra for all five fluorophores were modeled as Gaussians with known ranges for peak wavelengths and Gaussian widths based on previous in vivo spectral measurements as described elsewhere [27].
2.3 Monte Carlo modelling of the light propagation though the fibre and tissue
To estimate the cross section of interaction at the tissue interface, a modified MCML code with fluorescence modeling was used where the model was customized based on the probe geometry, refractive index mismatches, and brain tissue optical properties at the excitation and emission wavelengths, determined from in vivo and ex vivo brain tissue [28–30]. The model was previously compared and validated against traditional MC and MCML programs for layered tissue phantoms at different illumination-collection geometries [25, 26]. Modifications to the MCML program included modelling the excitation light as a Gaussian beam exciting a fibre with a core diameter of 200 µm and an NA of 0.22. The absorption (μax) and scattering coefficients (μsx) at the excitation wavelengths ranges from to 3–20 cm−1 and 150–400 cm−1, respectively; the anisotropy factor is set to 0.87. The fluorophore is uniformly distributed in the tissue model with an absorption coefficient of 0.1 cm−1 similar to that of FAD measured in vivo [31]. Additionally, the fluorescence quantum yield, the wavelength-dependent extinction coefficient of FAD, and the wavelength-dependent tissue optical properties (μam, μsm, and g) across the spectral range 475–600 nm are all inputs to the model.
For simulating photon excitation, 107 photons are launched in a 3D Cartesian grid with 50 µm resolution. Absorption matrixes recorded from the individual voxels were created for the tissue background and the fluorophore separately. Consequently, the fluorophore excitation weight is then assembled and each voxel becomes an individual source with optical properties at the randomized emission wavelength. For simulating the fluorescence emission, the separation distance between the excitation and collection fibres (600 µm center to center) is set at an angle of 11° with a detection solid angle of 12.75°. Flow charts depicting the added parameters in the modified MCML for both the absorption and fluorescence emission maps are shown in Figure 2B. Furthermore, the most efficient probe to sample distance was obtained experimentally as well as through Monte Carlo simulations. Through MC modelling, the fluorescence intensity was simulated for varying probes to sample distances from 0 to 4 mm in steps of 0.2 mm for the same range of optical properties mentioned above and for the specific probe geometry. Experimentally, a fixed brain tissue sample (see methods; Section 5) was positioned on the translation stage and the autofluorescence spectrum was acquired at different probe to tissue vertical displacements in steps of 0.5 mm. The integrated fluorescence within the FAD fluorescence emission band was used to compare the predicted fluorescence by MCML.
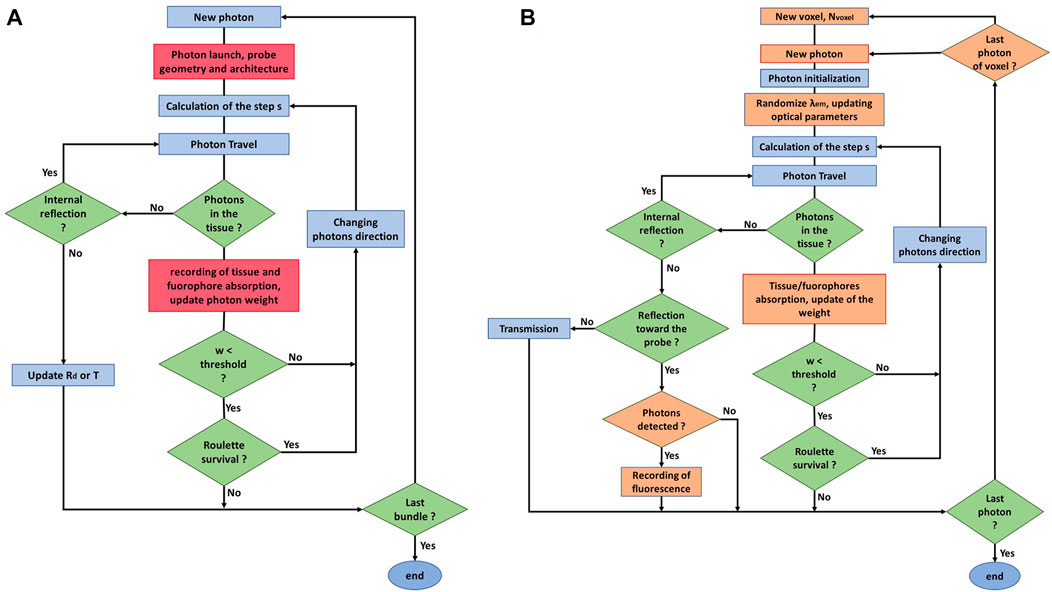
FIGURE 2. (A) Flow chart diagram of the MCML code presented by wang et al (ref 26). (B) Flow chart diagram of the customized version of the MCML code used in this study, modifications and added parts are the one marked in orange.
2.4 Experimental characterization of the probe
The output power at the distal end of the probe was measured periodically to test the stability of the laser source exiting the probe. Then, the radiant exposure was calculated based on the measured mean power, the beam diameter and repetition pulse rate. This was compared to the maximum allowable exposure limit as defined by ICNIRP(32). The spatial and temporal response dictates the spatial and temporal resolution achieved by our probe in a non-turbid medium. A 1951 USAF resolution target (R3L3S1P - Positive 1951 USAF Test Target, Thorlabs, Newton-New jersey, United States) was used to characterize the spatial resolution of the probe by linearly scanning across group -2 and element 3. A homemade script was developed to deconvolve the spatial impulse response function from the measured intensity data and retrieve the full width at half maximum (FWHM). The temporal instrument response function (IRF) was found by measuring the fluorescence lifetime of the laser source exiting the distal end of the probe and being reflected by a mirror. The decay profile was fitted to a Lorentzian function. The linearity and reproducibility of our probe were tested using dilutions of standard fluorescent dyes and liquid tissue simulating phantoms. First, the linearity of the spectral and temporal response as a function of either exposure time or fluorophore concentration simulating tissue simulating phantoms, where the minimum detection limit could be determined. The tissue phantom comprised of a mixture of Intralipid (I141-100ML, Sigma-Aldrich, Missouri, United States), China ink, phosphate-buffered saline (PBS, Sigma-Aldrich, Missouri, United States), and FAD solution (F6224, Sigma-Aldrich, Missouri, United States). The concentrations of Intralipid and ink yielded reduced scattering and absorption coefficients of 2 mm−1 and 1 mm−1 at the excitation wavelength, respectively. For the first test, the acquisition time varied from 10 ms to 1,000 ms and 1 mM of FAD was added to the phantom. Then the fluorescence intensity was detected across the 500–600 nm spectral band for the tissue phantom of varying [FAD], where [FAD] ranged from 0 to 30 µM. These concentrations are within the ranges expected in vivo [31]. The fluorescence decay across the same spectral band was fitted to a bi-exponential decay function to extract the short and long lifetimes of FAD as a function of acquisition time and fluorophore concentration. Secondly, the fluorescence lifetime of several fluorescent dyes as a function of concentration and pH was determined and compared to literature. FAD, NADH, fluorescein, and Rhodamine B (RhdB) were diluted in PBS to obtain different concentrations. Drops of NaOH or HCl solutions were added to change the alkalinity/acidity of the dye solution. The effect of temperature was not studied as the system is stationed in the OR at fixed room temperature.
2.5 Ex vivo animal study. Comparison with confocal fluorescence spectral microscopy
After a mouse was euthanized, its liver, lung, and brain were extracted and washed in PBS. All methods are reported in accordance with ARRIVE guidelines of reporting animal research [32]; All methods were carried out in accordance with relevant guidelines and according to the CEE directives for animal experimentation (decree No 2001–131; JO 06/02/01). The experimental protocols were approved by CNRS-UMR9012 IJCLab laboratory and have already been applied in another published study [27]. Each organ was placed on a microscope slide and positioned on the translation stage (Figure 1C), experiments were performed on the hole organ without any preliminary cut. The probe was fixed at 1.5 mm away from the sample and measurements were acquired in a raster scan manner at 0.4 mm intervals. Following the probe measurements, the fresh samples were imaged on a confocal-multiphoton fluorescence microscope (Leica TCS SP8 MP, Leica Microsystems, Wetzlar, Germany). The confocal fluorescence imaging mode was selected with 405 nm excitation. The microscope is equipped with highly sensitive hybrid non-descanned detectors and a dedicated Leica software. The spectral acquisition mode was selected to capture spectrally-resolved fluorescence images from 380 to 750 nm at 10 nm intervals. Using the acquisition software (Leica LAS X) the mean fluorescence spectra from a z-stack at different regions of the sample were obtained. The probe and confocal microscope measurements were also performed after fixing the samples with Formalin. Temporally-resolved fluorescence were acquired by our probe on both fresh and fixed ex vivo samples. A bi-exponential decay function was used to fit the fluorescence decay profiles of NADH and FAD, while a mono-exponential decay function was used to fit the lipopigments and porphyrins fluorescence decay curves. In the former case, the amplitude weighted lifetime were determined so that one lifetime is reported for all fluorophores.
2.6 The effect of Formalin fixation of human brain tissue samples on the spectral and lifetime fluorescence measurements
The cortical brain tissue sample was collected from the Neurosurgery and Neuropathology department at GHU Paris Psychiatrie et Neuroscience Hospital upon the approval of the GHU Paris Psychiatrie et Neuroscience Hospital—University Paris Descartes Review Board (CPP Ile de France 3, S.C.3227). All methods were carried out in accordance with relevant guidelines and regulations of this approval and informed consents were obtained from all patients prior to sample collection. Although only one cortical brain tissue sample from an epileptic patient is collected for this study, the ex vivo clinical study approved by the GHU Paris Psychiatrie et Neuroscience Hospital—University Paris Descartes Review Board allows the measurement of freshly extracted tissue from patients diagnosed with a wide range of brain diseases as long as the patient consents. The biopsy specimen was placed in saline solution prior to the probe and microscope measurements, it has an approximately size of 15 mm length, 10 mm width and 4 mm thickness. Afterwards, the sample was fixed and the same measurements were repeated.
2.7 The effect of applied pressure on the fluorescence and lifetime measurements
It is well known that the pressure applied to the probe when in contact with tissue in vivo directly affects the tissue remission spectra due to changes in vascularity [33–36]. To test this effect, the probe was first placed barely touching the brain tissue sample (referred to as “light” in Figure 10) and a spectrum was acquired. Then the probe was translated vertically downward in steps of 0.2 mm until the probe was visibly pushing the tissue surface (referred to as “heavy”).
3 Results
3.1 Theoretical characterization of the probe
3.1.1 Spatial distribution of the excited and emitted photons
The distributions of the absorbed and emitted fluorescent photons at the tissue surface are shown in Figures 3A, B, respectively for μax = 10 cm−1 and μsx = 400 cm−1. The full width at half maximum (FWHM) was estimated to be 200 µm for the excited beam at the tissue surface and did not vary when μax varied from 3 to 20 cm−1 and when μsx varied from 150 to 400 cm−1. This indicates that the illumination source acts as a point source and is only modestly affected by changes in tissue optical properties at the excitation wavelength. On the other hand, the FWHM of the emitted fluorescence was estimated to vary between 400 and 500 µm depending on the optical properties at the emission wavelengths. The simulated axial distribution of the fluorescence emission, F(x = y = 50 mm, z), for four pairs of tissue optical properties are plotted in Figure 4B. The fluorescence intensity peaks shown correspond to the intensity at that center x = y = 50 mm of the 3D Cartesian array. Since the fluorescence photons for the higher absorption coefficients at constant scattering coefficient are more concentrated at the center, the recorded fluorescence photons are higher. On the other hand, the more diffuse the medium, the larger the FWHM and the fewer photons that are detected at the center. The scattering coefficient dictates the depths at which most of the photons originated from (maximum sensitivity). At higher scattering values, the probe is sensitive to superficial layers, while the probe samples a more homogeneous volume at lower scattering coefficients. Both optical properties affect the maximum penetration depth, defined here as the depth at which 80% of the fluorescence originate from. A summary of both parameters is provided in Table 1. The maximum penetration depth varies from 0.93 to 0.35 mm as the total attenuation increases. Therefore, the detected volume varies from 0.59 to 0.24 mm3, assuming radial symmetry. To test whether the fluorescence emission varied from one collection fibre to another, the emission matrix was rotated by 52.4° about the z-axis and the emission profiles were compared to that at 0°. The fluorescence intensity reaching the detector did not vary with angle.
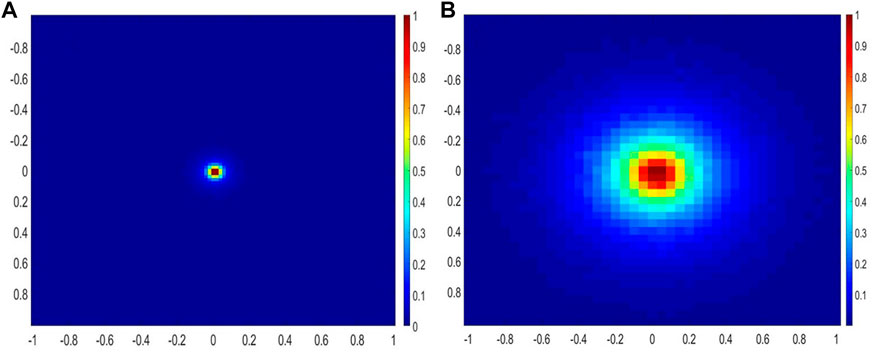
FIGURE 3. (A) Distribution of the excitation photons absorbed specifically by the fluorophore at the tissue surface (lateral dimensions are in mm), (B) distribution of the emitted fluorescence photons reaching the detector. The emission map is similar for all five detectors.

FIGURE 4. (A) The fluorescence intensity as a function of probe to sample distance based on ex vivo tissue measurements (blue curve) as well as on MC predictions (black curve). In each case, the fluorescence is normalized to its maximum intensity, which occurs at 1.5 mm. (B) Simulated Axial distribution (F(z)) of the fluorescent photons for different sets of optical properties (μax, μsx).
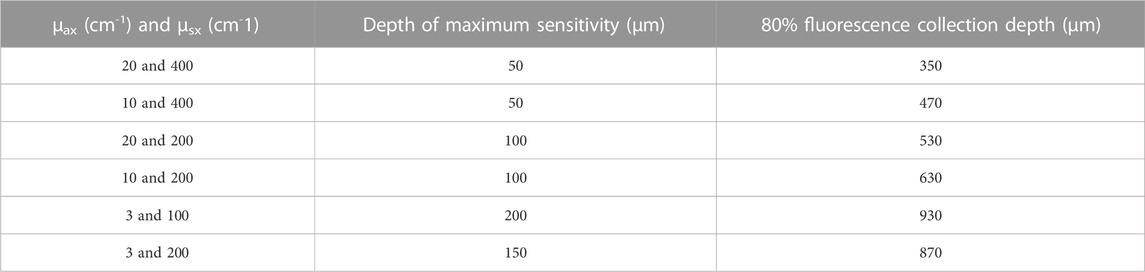
TABLE 1. The depth at which the most number of fluorescent photons originate (mm) and the maximum penetration depth (mm) for different pairs of optical properties.
3.1.2 Optimal probe to sample distance based on Monte Carlo predictions and ex vivo measurements
The MC code systematically predicts fewer detected photons at distances shorter than 1.5 mm, while the opposite trend is seen beyond 1.5 mm. Nevertheless, based on both methods, the optimal probe to sample distance is 1.5 mm, which corresponds to the distance at which there is maximum overlap between the illumination and collection cones. Figure 4 a show the variation of the detected fluorescence intensity as function of probe to sample distance (measured and simulated). Longer distances result in loss of photons due to the quasi-exponential decay law. Liquid phantom measurements with FAD solutions also resulted in similar conclusions.
3.2 Experimental characterization of the probe
3.2.1 Stability of the laser source
Since point-to-point measurements of a typical surgical cavity of 3 cm by 3 cm will take less than 15 minutes, the power of the laser source exiting the probe for the duration of 1 hour was measured in 10-minute intervals. The laser source has 405 nm as emission wavelength and the average laser power was 0.8 ± 0.0076 mW (50% of the power exiting the proximal end of the probe). For the duration of 1 hour, the power varied by only 0.9%. The radiant exposure (J/m2) emitted by the laser source at the distal end was calculated as 59.2 J/m2 for a one second measurement and for a repetition frequency of 40 MHz. This exposure is three orders of magnitude lower than the maximum allowable radiant exposure emitted by a pulsed laser on skin for one second (11 J/m2 x 103 J/m2) [37].
3.2.2 Spatial and temporal impulse response
Figure 5A shows the beam profile obtained after linearly scanning the probe across group -2 and element 3 of the USAF resolution target, while Figure 5B shows the recovered impulse response. The spatial resolution in a non-turbid medium was found to be 153.06 µm. The temporal impulse Response Function (IRF) of the probe system, which corresponds to the time that separate the sending of a laser pulse by the laser source and its detection back by the detector, was measured. For that, a mirror was placed under the probe and the fluorescence lifetime decay profile of the reflected laser beam was recorded fitted to a Lorentzian function. This yielded the IRF and the temporal resolution of 29 and 34.6 ps, respectively. The IRF and temporal resolution also matches the manufacturer’s laser evaluations at the end of the laser without propagating through the fibre-optic probe, hence the probe itself did not cause temporal broadening.
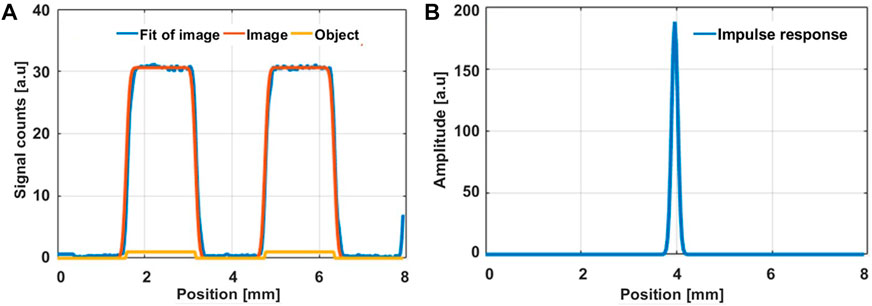
FIGURE 5. (A) Reflected signal detected by raster scanning group -2 and element 3 of the USAF target (orange curve) considered as the image of the target (yellow curve) and the fitted curve of the reflected signal (Blue curve). (B) Spatial impulse response of the light exiting from our probe as obtained by raster scanning group -2 and element 3 (bar width of 1.58 mm). The deconvolution program retrieves a spatial resolution of 153 ± 65 µm.
3.2.3 Spectral and temporal response as a function of exposure time and fluorophore concentration
The fluorescence intensity increases linearly with acquisition time and fluorophore concentration, as expected (Figures 6A, C). The linearity is best when measurements are acquired for more than 40 ms and when the concentration of the standard FAD solution, used in this experiment, is at least 4 µM. FAD is the main source of fluorescence in the spectral range of 500–600 nm for the tissue simulating phantoms, however, Intralipid is also a contributor, with a fluorescence peak at 500 nm [38]. Intralipid fluorescence is therefore the reason for the non-zero signal at [FAD] = 0 (Figure 6C). In fact, the fluorescence lifetime of the tissue phantom with no FAD shows a significantly lower long lifetime value (p < 0.05) than those phantoms with FAD, as we can notice in Figure 6D which represents the variation of FAD fluorescence lifetime with its concentration ([FAD]). In any case, the fluorescence lifetime measurements indicate that indeed they are independent of the fluorophore concentrations commonly present in tissue [31], and also independent of acquisition time as shown in Figure 6B which represent the variation of the FAD fluorescence lifetime with the acquisition time. As for testing the accuracy of our probe to reproduce the lifetime characteristics of common fluorescent dyes, Tables 2, 3 summarize the mean lifetime values obtained with direct comparison to the values published in literature (in parenthesis).
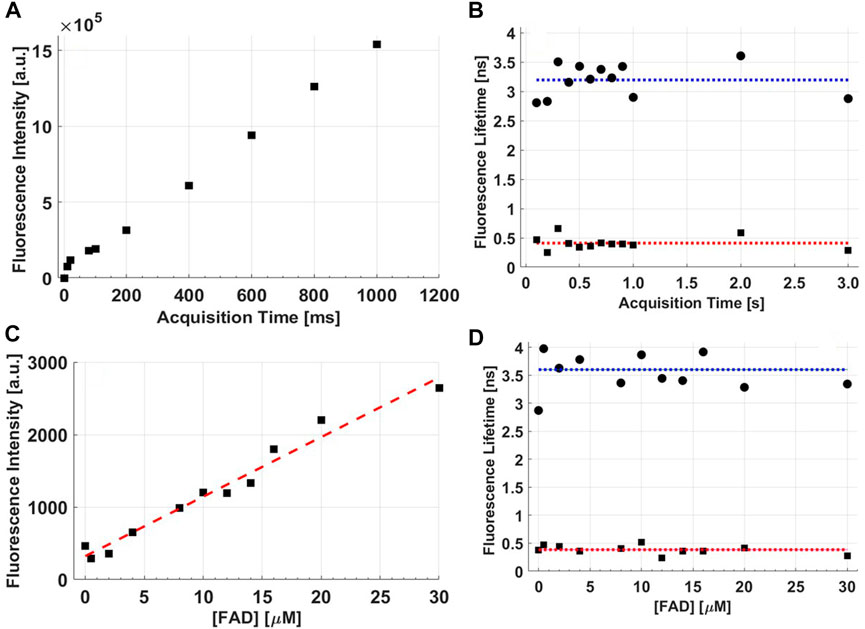
FIGURE 6. (A) Raw fluorescence intensity as a function of acquisition time from a tissue phantom with FAD added as the fluorophore, (B) the fluorescence lifetime of FAD as a function of acquisition time, (C) the raw fluorescence intensity as a function of fluorophore concentration in the tissue phantom, and (D) FAD fluorescence lifetime as a function of [FAD].
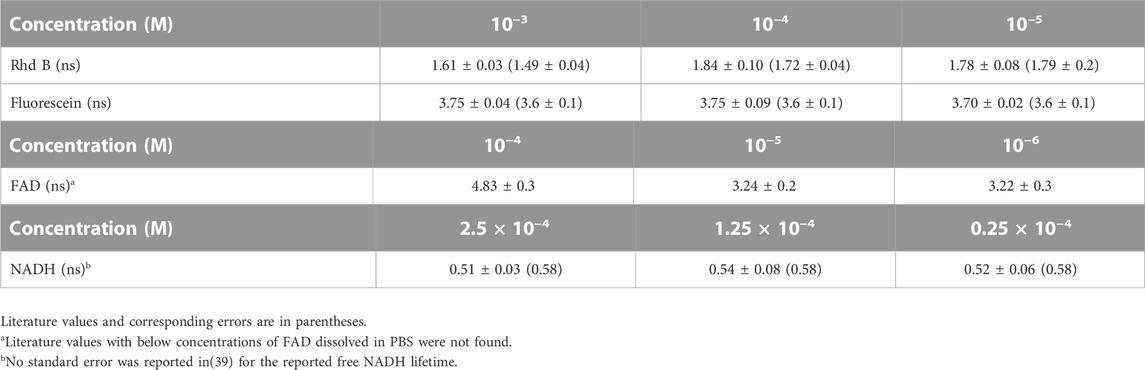
TABLE 2. Fluorescence lifetime values as a function of fluorophore concentrations.
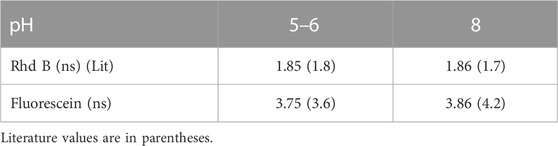
TABLE 3. Fluorescence lifetime values as a function of pH.
The recovered lifetime values are similar to the published values [31, 39, 40]. The error associated to each lifetime obtained experimentally corresponds to the standard deviation in the lifetime value from three measurements at different time points. The errors in parentheses are the errors reported in literature except for (free) NADH, which was not reported [39]. Lifetime values of FAD dissolved in PBS at the given concentrations were not found in literature so that a comparison was not possible, although an average value of 2.99 ns was reported by Nakabayashi et al. for [FAD] = 10−4 M in a mixture of alcohol and water [40]. The fluorescence lifetime of fluorescein is invariant to fluorophore concentration and pH (Tables 2, 3), while RhdB and FAD dyes produced two different values. At low concentrations (≤10−4), RhdB resulted in higher lifetime values compared to when the dye solution was further concentrated (≥10−5), while the opposite behavior is found in FAD solutions. Similar to fluorescein, the acidity/alkalinity of RhdB solution did not affect the recovered fluorescence lifetime.
3.3 Ex vivo animal study
The fluorescence spectra from fresh rodent organs acquired by our probe and shown in Figures 7A, B reproduce the spectral characteristics of the endogenous fluorophores pertaining to both the liver and brain [41]. Both in the liver and brain, NADH, FAD, phospholipids/lipopigments and porphyrins are the main endogenous fluorophores. The confocal fluorescence spectra fail to reproduce the lipopigments and porphyrins peak due to the 650 nm long pass filter added to separate the excitation from the emission signal in the case of two-photon excitation. Additionally, the 405 nm peak in all the spectra acquired from the confocal microscope benchtop system as well as the heightened fluorescence intensity in the 405–450 nm range is a result of the excitation light bleed-through. On the other hand, the fluorescence spectra from fixed tissue, shown in Figures 7C, D, show better correspondence between the two techniques as tissue fixation significantly attenuates the contribution of lipopigments and porphyrins, while almost preserving NADH and FAD fluorescence. The fluorescence intensities were scaled for optimal comparison between the two modalities. In all cases, our probe significantly detects more photons than the confocal microscope in 1/10 of the time. A direct comparison between the normalized autofluorescence spectra from fresh and fixed tissue as measured by our probe under the same integration time is shown in Figures 8A, B. In all cases, the overall fluorescence intensity is enhanced after tissue fixation. In the fresh ex vivo cohort, the fluorescence spectra are distinct for each organ, including slight differences in the location of the fluorescent peaks, while in the fixed tissue study, all three organs show similar emission profiles. Table 4 summarize the fluorescence lifetime values for the five endogenous fluorophores from fresh and fixed animal tissue respectively. Overall, the lifetime values for each fluorophore from the fixed samples were significantly longer (p < 0.05), except for porphyrin I in the lung sample (p > 0.05).
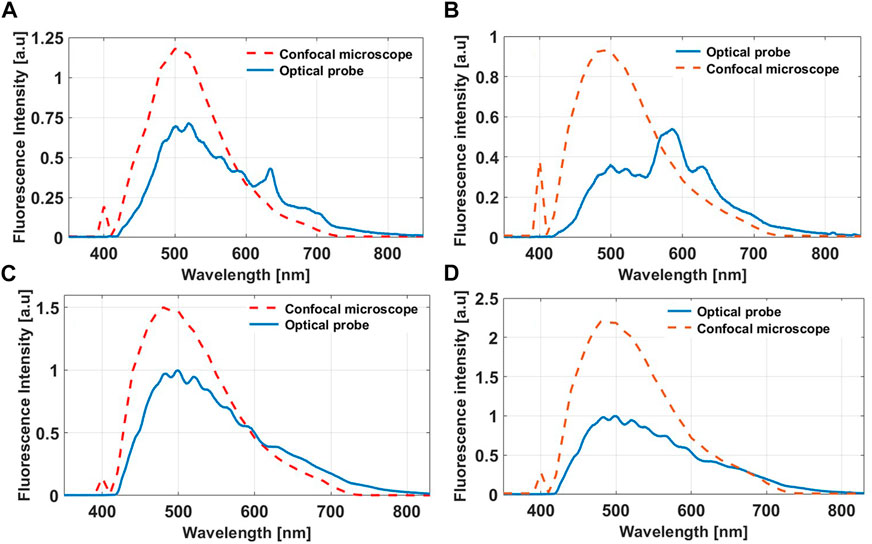
FIGURE 7. Autofluorescence spectra from fresh (A) Mouse liver and (B) Brain tissue obtained with our probe and the confocal microscope benchtop system. The corresponding autofluorescence spectra from fixed (C) Liver and (D) Brain tissue. The fluorescence intensities are scaled for better visualization.

FIGURE 8. Autofluorescence spectra obtained by our probe from fresh (A) and fixed (B) mouse tissue.
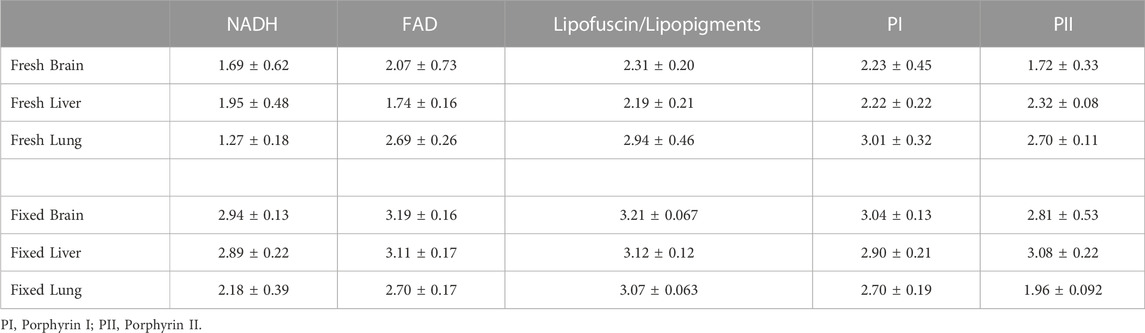
TABLE 4. Average amplitude weighted fluorescence lifetimes (ns) from fresh and fixed brain, liver and lung mouse tissue.
3.4 Ex vivo human cortical tissue
As deduced from the mouse data, the fibred-optic probe is spectrally sensitive and specific enough to characterize the fluorescence peaks of the five endogenous fluorophores. This is not possible with the spectral detection of the confocal microscope (Figure 9A). Following tissue fixation, the autofluorescence spectrum obtained by our probe degenerates to have a similar spectral shape detected by the confocal microscope platform (Figure 9B). There is a systemic decrease in the relative contributions of porphyrins after tissue fixation. Although the spectra in Figure 9A infer that the signals detected by confocal microscope are higher, this is not the case. Rather the spectra are only scaled as such for better visualization. Also similar to the ex vivo mouse results, fixation does enhance the overall autofluorescence signal. There is no significant difference in the recovered mean lifetime values of NADH, FAD and lipopigments between the fresh and fixed brain tissue samples as the values shows in Table 5, while porphyrin II in the fixed samples had significantly higher values than their fresh counterparts (p < 0.05), mirroring the enhanced quenching under its fluorescence peak seen in Figure 9B.
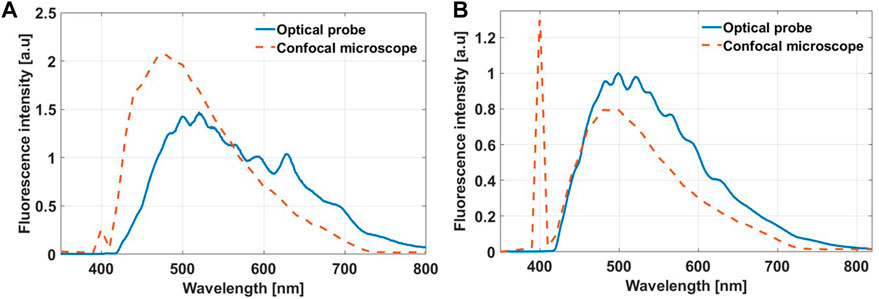
FIGURE 9. Autofluorescence spectra obtained with the optical probe and the confocal fluorescence microscope from fresh (A) and fixed (B) human cortical tissue.
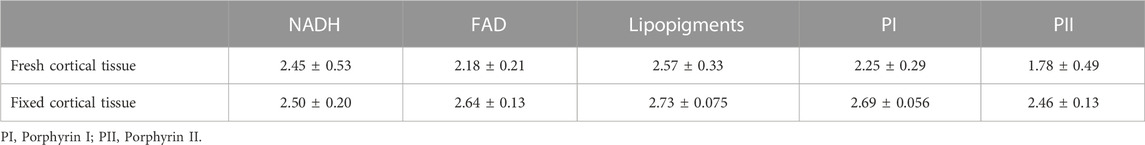
TABLE 5. The amplitude weighted fluorescence lifetime (ns) extracted from fresh and fixed human cortical tissue.
3.5 The effect of pressure applied to the probe on the autofluorescence spectrum
Figure 10A illustrates how applying pressure to the probe when in contact with tissue can readily affect the fluorescence spectrum. Heavy and medium-heavy exerted pressures resulted in higher autofluorescence signals as a result of squeezing out blood from the measured site. After spectral fitting [27], the integrated area under each fluorophore was determined for each pressure condition. The relative standard deviations in the calculated areas for the four pressure conditions are summarized in Table 6. The integrated fluorescence under both porphyrins I and II and NADH are the most sensitive to pressure changes (22%–29%), while the integrated fluorescence under the lipopigments (7.8%) changed the least. Figure 10B is the result of normalizing each fluorescence spectrum to the 520 nm peak. All four fluorescence become nearly identical. This is also true after normalizing to the 440 and 580 nm peaks, which coincide with oxy- and deoxy-haemoglobin’s isosbestic peaks. The difference in the integrated areas under each emission curve after applying the normalization scheme reduces the standard deviations to less than 12% (Table 6).
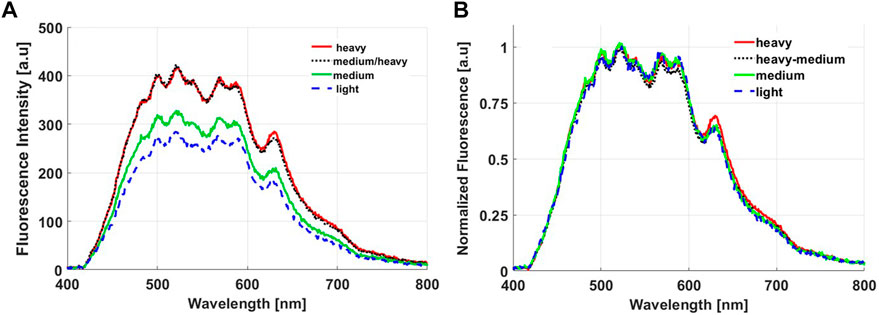
FIGURE 10. Autofluorescence spectra obtained by our probe from (A) Fresh and (B) Fixed mouse tissue with different power of applied pressure from the probe on the sample.
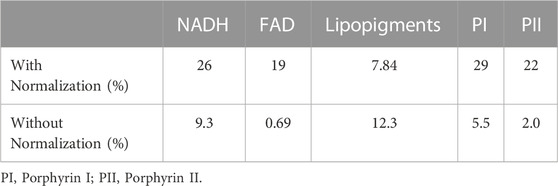
TABLE 6. The relative standard deviation (%) of the integrated area under the Gaussian curve for each fluorophore retrieved at the four pressure condFitions with and without normalizing each spectrum to its intensity at 520 nm.
4 Discussion
You may typeset. The probe that is presented in this work is a multi-fibred optic probe specifically designed to be utilized for brain tissue classification during neurosurgery for a wide range of diagnosis including epilepsy, meningioma, and glioma. Two main biophysical properties are measured that are expected to vary with tissue type and pathology, the fluorescence spectra from five endogenous molecules as well as their fluorescence lifetime [17–19, 21, 22, 27–29, 31, 41, 42]. Since the geometry and physical properties of the collection and illumination fibres directly impacts the extent of tissue being optically sampled and the collection efficiency [43], it is imperative to fully characterize the fibred-optic probe, which is intendent for in vivo diagnosis. This was accomplished by MC simulations (Figures 2, 3) and by experiments with tissue simulating phantoms (Figure 4, 6; Tables 1–3). The modelled behavior of fluorophore absorption and fluorescence emission area at the tissue surface (Figure 3) is similar to the absorption and emission maps obtained for fibres of similar geometry, fibre diameter size, and illumination-collection fibre separation distance [43, 44]. The diameter of the collection fibre in our probe is modestly larger than those typically reported (360 µm vs. 200 µm) [43, 44], which results in higher collection efficiency and mean path lengths, but does not significantly increase the probing depth [43]. The asymmetric intensity profile as a function of probe to sample distance (Figure 4A) was also described in the bifurcated probes designed by Papaioannou et al and by Pfefer et al [43, 44]. The optimal probe to sample distance was found at larger distances for larger source-collection separation distances so that maximum overlap between the illumination and collection cones is achieved. This was found to be 1.5 mm for our probe. The deviations observed between the simulated intensity profile and the measured intensities (Figure 4A) depend on the probe to sample distance. At distances shorter than 1.5 mm, the simulated data are underestimated due to the low probability in fluorescence detection, where only laterally scattered light reaches the detector. At distances beyond 1.5 mm, the overlap between the illumination and collection cones decreases more rapidly than predicted by MC as the model does not account for the direction at which the fibres are beveled. Based on the above observation, one can deduce that the fibres are beveled away from each other so that the intersection between the illumination and detection areas decreases faster than if the fibres were beveled toward each other at the same angle (11°). At a fixed probe to sample distance (1.5 mm), tissue optical properties affect the depth at which fluorescent photons originate from, where the fluorescence signal is more surface weighted for higher μa and μs values as determined here. The higher scattering values used explains the shorter depths than those reported in similar studies [42, 43]. Nevertheless, the 600 µm separation distance between the source and collection fibre ensures relatively homogenous sampling with depth. The range of optical properties selected for MC and tissue phantom measurements aimed at modelling a wide range of optical properties as observed in vivo in brain tissue [4, 29]. The angular orientation of the detection fibre does not affect the sample volume as shown by rotating the emission matrices, therefore adding the emission maps from all five detectors does not affect the optically interrogated volume. This is because the illumination angle is maintained perpendicular to the sample and the separation distance and angle between the source and collection fibres is fixed and therefore the final emission is the summation of the photons collected by the five detectors.
The spatial and temporal impulse response of the probe in a non-turbid medium defines the spatial and temporal resolution. These were found to be 150 µm and 35 ps, respectively. It is important to note that the fluorescence lifetime of the five endogenous molecules of interest have their lifetimes in the nanosecond range and thus the temporal resolution is more than sufficient for in vivo measurements. Additionally, the nanosecond lifetimes ensure that the temporally-resolved fluorescence measurements interrogate the same tissue volumes as the steady-state intensity measurements [43], which is the main confounding factor in imaging devices with multimodal abilities. A recent study showed that reconstructing an optical coherence tomography (OCT) based image from a three dimensional image to a two dimensional “en face” OCT map, enables one to extract structural contrast within the same tissue area interrogated by a scanning fibre-optic probe acquiring the autofluorescence spectrum [45]. The steady-state MC simulations predicted the spatial extent of the incoming beam at the tissue surface to be ∼200 μm, close to the measured spatial impulse response of 150 µm. 200 µm corresponds to the size of the illumination fibre indicating minimal diffusion induced divergence of the excitation light, since the excitation photons are readily absorbed. The MC simulations were limited to modelling one fluorophore that was homogenously distributed throughout a semi-infinite turbid medium with homogenous optical properties at the excitation wavelength. For the fluorescence emission simulations, wavelength-dependent µam, µsm, and the extinction coefficient of FAD were included. A recent tetrahedral mesh-based MC program developed by Lilge et al. can incorporate different optical properties and tissue geometries to model white and grey matter as well as tumor inclusions [46]. Since the purpose of the MC simulations was to calculate the interrogated tissue volume, the optimal probe to sample distance, and the depths of maximum sensitivity, the assumptions in the modified mcml code were sufficient. Detailed validation of the modified code with multi-layered fluorescence inclusion measurements as well as comparison to the conventional MCML code has been studied previously [25, 26].
The minimum detection limit of 4 µM is only a magnitude lower than the [FAD] concentrations expected in vivo [31], however this limit was obtained for an acquisition time of 40 ms (Figure 6). Increasing the acquisition time to 400 ms is possible without causing practical delays or photobleaching. The detection limits at the other emission bands were not characterized here as their concentrations found in brain tissue are not reported in the literature, although the [NADH] is expected to be in the mM range [39]. For ex vivo measurements of biopsied brain tissue, an acquisition time of 500 ms is typically used to ensure high signal to noise ratios in both the spectral and temporal measurements. The accuracy of recovering the fluorescence lifetime of several fluorescent dyes was tested as a function of fluorophore concentration (Table 2) and pH (Table 3). The lifetime values for each dye is consistent with those found in literature for the given concentrations and dilution solutions [47–49]. The reproducibility can be estimated based on the standard deviations obtained after repeating the measurement three times. This varied between 2% and 6%. The dichotomic behaviour of RhdB as a function of concentration has also been observed elsewhere [48, 49]. At RhdB dye concentrations lower than 10−4 M, its fluorescence lifetime was longer (1.98–2.24 ns) that its value at higher dye concentrations (1.56–1.68 ns) due to static quenching [48]. The opposite trend is observed for FAD, where higher FAD concentrations (≥10−4) resulted in longer lifetime values due to the dynamic intramolecular electron transfer between the photoexcited isoalloxazine moiety and the adenine moiety of FAD, which in turn depends on the dielectricity and viscosity of the surrounding environment [40]. The longer lifetime at the high concentration is closer to the lifetime of flavin mononucleotide (467 ns) [50], while lifetime values for FAD for the lower concentrations are not found in literature even though they are closer to the concentrations observed in vivo. Moreover, the probe measurements also recapitulated the independence of the fluorescence lifetimes on pH for fluorescein and RhdB, as also observed in other studies, indicating that these dyes are not sensitive markers of pH [47–49].
In the ex vivo rodent and human study, steady-state and lifetime measurements were conducted on fresh and fixed tissue samples to understand the changes in the biophysical properties that occur due to tissue fixation. This is critical so that optical measurements performed on fixed tissue can at least be correctly extrapolated to what is expected in vivo when needed. Fixed tissue analysis is more practical and is more useful when correlating or comparing to findings from histopathology. An interesting finding here was that keeping the sample “fresh” is not necessary for conventional confocal fluorescence microscopy as the spectral specificity is inherently lost by the limited spectral resolution of the microscope itself. In fact, tissue fixation is preferred as the fluorescence is enhanced (Figures 5D, 6B, 7B), particularly that from NADH and FAD. The relative contribution of porphyrins I and II are significantly reduced. Another explanation of the difference in the spectral shape obtained by our probe and the confocal microscope is that in the latter case, the excited and emitted light is minimally distorted by tissue optical properties as scattered photons are not detected and hence do not modulate the fluorescence spectral shapes. After tissue fixation, the spectral shapes acquired from our probe and microscopy are similar. Since Formalin fixation reduces haemoglobin absorption [51], the fluorescence intensities under the oxy- and deoxy-haemoglobin peaks (440, 555, and 580 nm) are enhanced. These correspond to NADH, FAD and lipopigments. Another result due to haemoglobin changes is that the concentration and distribution of porphyrins are altered [51, 52], hence their relative contributions to the overall spectra are different from those found in fresh samples. Quenching of the fluorescence of porphyrins following Formalin fixation (Figures 6B, 7B) could have also resulted in such changes. Interestingly, although the spectral shapes for each fresh tissue type (brain, liver, and lung) are unique, the lifetime values in the rodent study for each fluorophore is relatively constant as they are independent of tissue optical properties and fluorophore concentration. In all three tissue types, although less for the lung sample, the fluorescence lifetime is systemically longer for each fluorophore upon tissue fixation (Table 4), which was also found recently with FLIM of brain tissue samples [53]. The interaction of each fluorophore with Formalin changes its protein-binding affinity, directly affecting the average lifetime. On the other hand, the amplitude weighted mean lifetimes of all five fluorophores, except porphyrin II, recovered from fresh human cortical tissue did not differ significantly after tissue fixation (p > 0.05) (Table 5). However, when comparing the free and bound lifetime values of FAD and NADH, it was found that the lifetime values of free NADH (τ1) and bound FAD (τ1) were higher upon tissue fixation. Similar findings were reported by Wang et al. [39], when cultured Hela cells were Formalin fixed. The authors also found that changes in the fluorescence lifetime of NADH and FAD depended on the time of measurement post-fixation [39]. Specifically, the lifetime of NADH increased sharply (33%) following fixation and remained constant for 14 days. FAD increased steadily right after tissue fixation, but then jumped after day 11. Lifetime measurements were not conducted after day 14. In the present study, the fixed human brain samples were measured one-month post-fixation, while the animal tissue samples were measured 6 days post-fixation. Therefore, the time of measurement after fixation may explain the differences observed. Nevertheless, the lifetime values obtained ex vivo do mirror the values reported in vivo for FAD and NADH, which varies from 2.3 to 2.9 ns for free FAD and 2–2.3 ns for bound NADH [42]. Additionally the lifetime values reported ex vivo on fresh cortical brain tissue for all five fluorophores are within the ranges reported previously by our group using a dual fibre-based fluorescence setup that was stationed adjacent to the OR [29]. With that setup as well, fixed tissue samples had generally longer lifetime values [53]. These comparisons further demonstrate the accuracy of the lifetime measurements acquired by our probe on the one hand, and the different fluorescence response as a function of tissue type and tissue status on the other.
Finally, the pressure study highlighted the importance of maintaining a relatively constant pressure applied to the probe when in contact to tissue. Although the autofluorescence spectra did not vary significantly between light pressure and medium pressure or between the two heavier ones (Figure 10A), as also seen in other studies [33–36], the pressure threshold to cause a difference in the intensity was not quantified. In any case, when comparing with other reported studies, it is evident that the effect of probe pressure is tissue site and probe specific. The diffuse reflectance acquired in vivo by a single fibre diffuse reflectance spectroscopy, showed that increased pressure reduces µa and increases µ's [33–35]. The reduced absorption is a result of reduced total haemoglobin content, vessel diameter and oxygenation level as pressure expels blood cells within the interrogated area and constrains the supply of incoming oxygen [33]. Another study involved testing the effect pressure applied on a clinical probe in contact with the cervix for cervical cancer screening [36]. The authors concluded that the autofluorescence spectral shapes remained unchanged with applied pressure. To correct for intensities differences, each spectrum was normalized to its peak intensity (∼380 nm). Pressure-induced signal changes did not affect the accuracy in identifying the different pathologies investigated [36]. A similar finding to Nath et al., was demonstrated here (Figures 10A, B). Light and medium contact did not significantly alter the fluorescence signals, however there is a significant difference between strong and light contact, which is systemic across the spectral range of interest. This observation motivated the choice of normalizing each spectrum by the 520 nm peak. This peak is one of haemoglobin’s isobestic wavelengths, where oxy- and deoxy-haemoglobin is equally affected and hence the normalization step accounts for total haemoglobin concentration changes. This decrease as well as an increase in the scattering parameters result in higher fluorescence signals. However, since applying pressure causes more oxygenated blood to become de-oxygenated [33–35], the total absorption coefficient is lower in magnitude at wavelengths beyond 600 nm. This explains the slightly higher porphyrin I fluorescence peak obtained from the heavy pressure measurement despite the normalization scheme (Figure 10B). The slight increase in the standard deviations pertaining to Lipopigments after normalization indicates that the normalization scheme overcorrects the fluorescence intensities since the fluorescence was least altered as lipopigments are not involved in cell respiration or blood flow. One additional important factor affecting probe pressure studies was found to be the duration of measurement, i.e. the duration the probe is in contact with tissue [33]. Minimal effects on the optically-derived physiological parameters, including [NADH], [haemoglobin], and oxygenation saturation levels, are seen for acquisition times shorter than 2 seconds, while significant changes were found for longer contact times [33]. The probe measurements do not take more than 1 s per site. These results show that the probe measurements can be conducted for in situ tissue diagnosis without being concerned about the interfering factor of pressure variation.
5 Conclusion
Overall, this paper aims to characterize a bimodal label-free fibred probe targeted for tissue characterization during brain tumor surgery. The complementary information extracted by spectrally- and temporally-resolved fluorescence has been utilized by other groups [7, 54], but the unique advantage of our custom-made optical probe is its practicality and ability to extract several physiologically relevant quantitative markers in near real-time. As a pilot validation study, our probe is now stationed adjacent to the OR so that the ex vivo measurements closely mimic the in vivo scenario.
Data availability statement
The datasets presented in this article are not readily available because of patient confidentiality as part of these data were acquired from human patient samples following the approval of the GHU Paris Psychiatrie et Neuroscience Hospital—University Paris Descartes Review Board (CPP Ile de France 3, S.C.3227). Requests to access the datasets should be directed to the corresponding author.
Ethics statement
The studies involving human participants were reviewed and approved by the approval of the GHU Paris Psychiatrie et Neuroscience Hospital—University Paris Descartes Review Board (CPP Ile de France 3, S.C.3227). The patients/participants provided their written informed consent to participate in this study. The animal study was reviewed and approved by the CNRS-UMR9012 IJCLab according to the CEE directives for animal experimentation (decree No 2001-131; JO 06/02/01).
Author contributions
MS collected, analysed the data and worked on the writing of the manuscript. HM participate to the manuscript writing. BD directed the clinical study at GHU Paris Psychiatrie et Neuroscience Hospital, his former affiliation, provided samples and participated in the manuscript writing. DAH designed the research project, the protocols for experiments, designed the probe and developed it, supervised the work and participated in the manuscript writing. Equally important, DAH performed measurements. All authors reviewed the manuscript and approved the submitted version.
Funding
This work is financially supported by ITMO Cancer AVIESAN (Alliance Nationale pour les Sciences de la Vie et de la Santé, National Alliance for Life Sciences and Health) within the framework of the Cancer Plan for MEVO and IMOP projects, by CNRS with “Défi instrumental” grant, by ligue nationale contre le cancer (LNCC), by CNRS innovation, by the P2IO LabEx and the Institut National de Physique Nucléaire et de Physique des Particules (IN2P3). Part of this work was done at the PIMPA Platform (The confocal-mutlitphoton fluorescence microscope platform) partly funded by the French program “Investissement d’Avenir” run by the “Agence Nationale pour la Recherche” (grant “Infrastructure d’avenir en Biologie Santé—ANR—11-INBS-0006”).
Conflict of interest
The authors declare that the research was conducted in the absence of any commercial or financial relationships that could be construed as a potential conflict of interest.
Publisher’s note
All claims expressed in this article are solely those of the authors and do not necessarily represent those of their affiliated organizations, or those of the publisher, the editors and the reviewers. Any product that may be evaluated in this article, or claim that may be made by its manufacturer, is not guaranteed or endorsed by the publisher.
References
1. Tuchin VV. Tissue optics and Photonics: Biological tissue structures. J Biomed Photon Eng (2015) 1(1):3–21. doi:10.18287/jbpe-2015-1-1-3
2. Laughney AM, Krishnaswamy V, Rizzo EJ, Schwab MC, Barth RJ, Pogue BW, et al. Scatter spectroscopic imaging distinguishes between breast pathologies in tissues relevant to surgical margin assessment. Clin Cancer Res (2012) 18(22):6315–25. doi:10.1158/1078-0432.ccr-12-0136
3. Kim A, Khurana M, Moriyama Y, Wilson BC. Quantification of in vivo fluorescence decoupled from the effects of tissue optical properties using fiber-optic spectroscopy measurements. J Biomed Opt (2010) 15(6):067006. doi:10.1117/1.3523616
4. Valdes P A, Leblond F L, Jacobs V, Paulsen K D, Roberts D. In vivo fluorescence detection in surgery: A review of principles, methods, and clinical applications. Curr Med Imaging Rev (2012) 8(3):211–32.
5. Jermyn M, Desroches J, Aubertin K, St-Arnaud K, Madore WJ, De Montigny E, et al. A review of Raman spectroscopy advances with an emphasis on clinical translation challenges in oncology. Phys Med Biol (2016) 61(23):R370–400. doi:10.1088/0031-9155/61/23/r370
6. Anand S, Cicchi R, Giordano F, Conti V, Buccoliero AM, Guerrini R, et al. Fiber-probe optical spectroscopy discriminates normal brain from focal cortical dysplasia in pediatric subjects. In: SJ Madsen, and VXD Yang, editors. Proceedings of the SPIE. San Francisco, California, United States (2017). p. 1005005. [cited 2022 Nov 2]. doi:10.1117/12.2250265
7. Butte PV, Mamelak AN, Nuno M, Bannykh SI, Black KL, Marcu L. Fluorescence lifetime spectroscopy for guided therapy of brain tumors. NeuroImage (2011) 54:S125–35. doi:10.1016/j.neuroimage.2010.11.001
8. Saager RB, Rowland RA, Baldado ML, Kennedy GT, Bernal NP, Ponticorvo A, et al. Impact of hemoglobin breakdown products in the spectral analysis of burn wounds using spatial frequency domain spectroscopy. J Biomed Opt (2019) 24(02):1. doi:10.1117/1.jbo.24.2.020501
9. Pomerleau-Dalcourt N, Lilge L. Development and characterization of multi-sensory fluence rate probes. Phys Med Biol (2006) 51(7):1929–40. doi:10.1088/0031-9155/51/7/021
10. Nazeer SS, Saraswathy A, Shenoy SJ, Jayasree RS. Fluorescence spectroscopy as an efficient tool for staging the degree of liver fibrosis: An in vivo comparison with MRI. Scientific Rep (2018) 8(1):10967. doi:10.1038/s41598-018-29370-1
11. Rath T, Tontini G, Vieth M, Nägel A, Neurath M, Neumann H. In vivo real-time assessment of colorectal polyp histology using an optical biopsy forceps system based on laser-induced fluorescence spectroscopy. Endoscopy (2016) 48(06):557–62. doi:10.1055/s-0042-102251
12. Spliethoff JW, Prevoo W, Meier MAJ, de Jong J, Klomp HM, Evers DJ, et al. Real-time in vivo tissue characterization with diffuse reflectance spectroscopy during transthoracic lung biopsy: A clinical feasibility study. Clin Cancer Res (2016) 22(2):357–65. doi:10.1158/1078-0432.ccr-15-0807
13. Marcu L. Fluorescence lifetime techniques in medical applications. Ann Biomed Eng (2012) 40(2):304–31. doi:10.1007/s10439-011-0495-y
14. Butte PV, Fang Q, Jo JA, Yong WH, Pikul BK, Black KL, et al. Intraoperative delineation of primary brain tumors using time-resolved fluorescence spectroscopy. J Biomed Opt (2010) 15(2):027008. doi:10.1117/1.3374049
15. Sharma M, Marple E, Reichenberg J, Tunnell JW. Design and characterization of a novel multimodal fiber-optic probe and spectroscopy system for skin cancer applications. Rev Scientific Instr (2014) 85(8):083101. doi:10.1063/1.4890199
16. Dochow S, Ma D, Latka I, Bocklitz T, Hartl B, Bec J, et al. Combined fiber probe for fluorescence lifetime and Raman spectroscopy. Anal Bioanal Chem (2015) 407(27):8291–301. doi:10.1007/s00216-015-8800-5
17. Fang N, Wu Z, Wang X, Lin Y, Li L, Huang Z, et al. Quantitative assessment of microenvironment characteristics and metabolic activity in glioma via multiphoton microscopy. J Biophotonics (2019) 12:e201900136. doi:10.1002/jbio.201900136
18. Li LZ, Xu HN, Ranji M, Nioka S, Chance B. Mitochondrial redox imaging for cancer diagnostic and therapeutic studies. J Innovative Opt Health Sci (2009) 02(04):325–41. doi:10.1142/s1793545809000735
19. Mehidine H, Chalumeau A, Poulon F, Jamme F, Varlet P, Devaux B, et al. Optical signatures derived from deep UV to NIR excitation discriminates healthy samples from low and high grades glioma. Scientific Rep (2019) 9(1):8786. doi:10.1038/s41598-019-45181-4
20. Mehidine H, Refregiers M, Jamme F, Varlet P, Juchaux M, Devaux B, et al. Molecular changes tracking through multiscale fluorescence microscopy differentiate Meningioma grades and non-tumoral brain tissues. Sci Rep (2021) 11(1):3816. doi:10.1038/s41598-020-78678-4
21. Palmer S, Litvinova K, Dunaev A, Yubo J, McGloin D, Nabi G. Optical redox ratio and endogenous porphyrins in the detection of urinary bladder cancer: A patient biopsy analysis. J Biophotonics (2017) 10(8):1062–73. doi:10.1002/jbio.201600162
22. Skala MC, Riching KM, Gendron-Fitzpatrick A, Eickhoff J, Eliceiri KW, White JG, et al. In vivo multiphoton microscopy of NADH and FAD redox states, fluorescence lifetimes, and cellular morphology in precancerous epithelia. Proc Natl Acad Sci (2007) 104(49):19494–9. doi:10.1073/pnas.0708425104
23. Wang L, Jacques SL, Zheng L. MCML—Monte Carlo modeling of light transport in multi-layered tissues. Comp Methods Programs Biomed (1995) 47(2):131–46. doi:10.1016/0169-2607(95)01640-f
24. Utzinger U, Richards-Kortum RR. Fiber optic probes for biomedical optical spectroscopy. J Biomed Opt (2003) 8(1):121. doi:10.1117/1.1528207
25. Vu Thi MH. Développement d’une sonde per-opératoire basée sur la detection d’autofluorescence pour l’assistance au traitement chirurgical des tumeurs cérébrales (2008). [Internet] [PhD Thesis]. Available from: http://www.theses.fr/2008PA112358.
26. Leh B. Caractérisation par autofluorescence de tissus cérébraux tumoraux: mesures sur fantômes et modèle animal (2011). [Internet] [PhD Thesis]. Available from: http://www.theses.fr/2011PA112166/document.
27. Haidar DA, Leh B, Zanello M, Siebert R. Spectral and lifetime domain measurements of rat brain tumors. Biomed Opt Express (2015) 6(4):1219. doi:10.1364/boe.6.001219
28. Valdés PA, Kim A, Leblond F, Conde OM, Harris BT, Paulsen KD, et al. Combined fluorescence and reflectance spectroscopy for in vivo quantification of cancer biomarkers in low- and high-grade glioma surgery. J Biomed Opt (2011) 16(11):116007. doi:10.1117/1.3646916
29. Zanello M, Poulon F, Pallud J, Varlet P, Hamzeh H, Abi Lahoud G, et al. Multimodal optical analysis discriminates freshly extracted human sample of gliomas, metastases and meningiomas from their appropriate controls. Scientific Rep (2017) 7:41724. doi:10.1038/srep41724
30. Poulon F, Mehidine H, Juchaux M, Varlet P, Devaux B, Pallud J, et al. Optical properties, spectral, and lifetime measurements of central nervous system tumors in humans. Sci Rep (2017) 7(1):13995. doi:10.1038/s41598-017-14381-1
31. Liu Q, Grant G, Li J, Zhang Y, Hu F, Li S, et al. Compact point-detection fluorescence spectroscopy system for quantifying intrinsic fluorescence redox ratio in brain cancer diagnostics. J Biomed Opt (2011) 16(3):037004. doi:10.1117/1.3558840
32. Percie du Sert N, Hurst V, Ahluwalia A, Alam S, Avey MT, Baker M, et al. The ARRIVE guidelines 2.0: Updated guidelines for reporting animal research. PLOS Biol (2020) 18(7):e3000410. doi:10.1371/journal.pbio.3000410
33. Lim L, Nichols B, Rajaram N, Tunnell JW. Probe pressure effects on human skin diffuse reflectance and fluorescence spectroscopy measurements. J Biomed Opt (2011) 16(1):011012. doi:10.1117/1.3525288
34. Delgado Atencio JA, Orozco Guillén EE, Vázquez Y, Montiel S, Cunill Rodríguez M, Castro Ramos J, et al. Influence of probe pressure on human skin diffuse reflectance spectroscopy measurements. Opt Mem Neural Networks (2009) 18(1):6–14. doi:10.3103/s1060992x09010020
35. Hariri Tabrizi S, Shakibaei AA. The effect of probe pressure on in vivo single fiber reflectance spectroscopy. J Lasers Med Sci (2016) 7(4):233–7. doi:10.15171/jlms.2016.41
36. Nath A, Rivoire K, Chang S, Cox D, Atkinson EN, Follen M, et al. Effect of probe pressure on cervical fluorescence spectroscopy measurements. J Biomed Opt (2004) 9(3):523. doi:10.1117/1.1695562
37.,ICNIRP guidelines on limits of exposure to laser radiation of wavelengths between 180 nm and 1,000 μm. Health Phys. 2013;105(3):271–95. doi:10.1097/HP.0b013e3182983fd4
38. Du Le VN, Nie Z, Hayward JE, Farrell TJ, Fang Q. Measurements of extrinsic fluorescence in Intralipid and polystyrene microspheres. Biomed Opt Express (2014) 5(8):2726. doi:10.1364/boe.5.002726
39. Wang X, Xie Y, Huang M, Yao L, Wang Y, Fei Y, et al. Effect of fixation and mounting on fluorescence lifetime of cellular autofluorescence. IEEE J Selected Top Quan Elect (2019) 25(1):1–6. doi:10.1109/jstqe.2018.2889429
40. Nakabayashi T, Islam MS, Ohta N. Fluorescence decay dynamics of flavin adenine dinucleotide in a mixture of alcohol and water in the femtosecond and nanosecond time range. The J Phys Chem B (2010) 114(46):15254–60. doi:10.1021/jp1063066
41. Bachmann L, Zezell DM, Ribeiro Ada C, Gomes L, Ito AS. Fluorescence spectroscopy of biological tissues—a review. Appl Spectrosc Rev (2006) 41(6):575–90. doi:10.1080/05704920600929498
42. Berezin MY, Achilefu S. Fluorescence lifetime measurements and biological imaging. Chem Rev (2010) 110(5):2641–84. doi:10.1021/cr900343z
43. Pfefer TJ, Schomacker KT, Ediger MN, Nishioka NS. Multiple-fiber probe design for fluorescence spectroscopy in tissue. Appl Opt (2002) 41(22):4712. doi:10.1364/ao.41.004712
44. Papaioannou T, Preyer NW, Fang Q, Brightwell A, Carnohan M, Cottone G, et al. Effects of fiber-optic probe design and probe-to-target distance on diffuse reflectance measurements of turbid media: An experimental and computational study at 337 nm. Appl Opt (2004) 43(14):2846. doi:10.1364/ao.43.002846
45. Zhu M, Chang W, Jing L, Fan Y, Liang P, Zhang X, et al. Dual-modality optical diagnosis for precise in vivo identification of tumors in neurosurgery. Theranostics (2019) 9(10):2827–42. doi:10.7150/thno.33823
46. Lilge LD, Cassidy J, Yassine AA, Kingsford W, Xu Y, Wilson BC, et al. Monte Carlo based light propagation models to improve efficacy of biophotonics based therapeutics of hollow organs and solid tumours including photodynamic therapy and photobiomodulation (Conference Presentation). In: J Popp, VV Tuchin, and FS Pavone, editors. Biophotonics: Photonic solutions for better Health care VI [internet]. Strasbourg, France: SPIE (2018). p. 2. [cited 2022 Nov 2]. doi:10.1117/12.2306150
47. Ryder AG, Power S, Glynn TJ, Morrison JJ. Time-domain measurement of fluorescence lifetime variation with pH. In: GH Bearman, DJ Bornhop, RM Levenson, and DJ Bornhop, editors. Biomarkers and biological spectral imaging [Internet]. SPIE (2001). p. 102–9. doi:10.1117/12.432487
48. Kristoffersen AS, Erga SR, Hamre B, Frette Ø. Testing fluorescence lifetime standards using two-photon excitation and time-domain instrumentation: Rhodamine B, coumarin 6 and lucifer yellow. J Fluorescence (2014) 24(4):1015–24. doi:10.1007/s10895-014-1368-1
49. Ibrahim A, Poulon F, Melouki F, Zanello M, Varlet P, Habert R, et al. Spectral and fluorescence lifetime endoscopic system using a double-clad photonic crystal fiber. Opt Lett (2016) 41(22):5214. doi:10.1364/ol.41.005214
50. Grajek H, Gryczynski I, Bojarski P, Gryczynski Z, Bharill S, Kułak L. Flavin mononucleotide fluorescence intensity decay in concentrated aqueous solutions. Chem Phys Lett (2007) 439(1–3):151–6. doi:10.1016/j.cplett.2007.03.042
51. Vladimirov B, Borisova E, Avramov L. Delta-ALA-mediated fluorescence spectroscopy of gastrointestinal tumors: Comparison of in vivo and in vitro results. In: SA Tikhomirov, T Udem, V Yudin, M Pshenichnikov, and OM Sarkisov, editors. Proceedings of SPIE. Minsk, Belarus (2007). p. 67271X. [cited 2022 Nov 2]. doi:10.1117/12.752411
52. Anand S, Cicchi R, Martelli F, Giordano F, Buccoliero AM, Guerrini R, et al. Effects of formalin fixation on tissue optical properties of in-vitro brain samples. In: ED Jansen, editor. Proceedings of SPIE BiOS. San Francisco, California, United States (2015). p. 93210Z. [cited 2022 Nov 2]. doi:10.1117/12.2076961
53. Mehidine H, Sibai M, Poulon F, Pallud J, Varlet P, Zanello M, et al. Multimodal imaging to explore endogenous fluorescence of fresh and fixed human healthy and tumor brain tissues. J Biophotonics (2018) 12:e201800178. doi:10.1002/jbio.201800178
Keywords: autofluorescence (AF), multi-fibre probe, fluorescence lifetime (FL), tissue diagnosis, spectroscopy
Citation: Sibai M, Mehidine H, Devaux B and Abi Haidar D (2023) Characterization of a bimodal multi-fibre optic clinical probe for in situ tissue diagnosis based on spectrally-and temporally-resolved autofluorescence. Front. Phys. 11:1120314. doi: 10.3389/fphy.2023.1120314
Received: 09 December 2022; Accepted: 30 January 2023;
Published: 01 March 2023.
Edited by:
Peng Gao, Xidian University, ChinaReviewed by:
Nirmal Mazumder, Manipal Academy of Higher Education, IndiaV. N. Du Le, The University of Alabama in Huntsville, United States
Copyright © 2023 Sibai, Mehidine, Devaux and Abi Haidar. This is an open-access article distributed under the terms of the Creative Commons Attribution License (CC BY). The use, distribution or reproduction in other forums is permitted, provided the original author(s) and the copyright owner(s) are credited and that the original publication in this journal is cited, in accordance with accepted academic practice. No use, distribution or reproduction is permitted which does not comply with these terms.
*Correspondence: Darine Abi Haidar, ZGFyaW5lLmFiaWhhaWRhckBpamNsYWIuaW4ycDMuZnI=