
95% of researchers rate our articles as excellent or good
Learn more about the work of our research integrity team to safeguard the quality of each article we publish.
Find out more
BRIEF RESEARCH REPORT article
Front. Phys. , 13 April 2023
Sec. Optics and Photonics
Volume 11 - 2023 | https://doi.org/10.3389/fphy.2023.1118885
This article is part of the Research Topic The Photodetector in High Energy Physics and Nuclear Physics View all 4 articles
 Rao Tatavarti1*
 Sridevi Nadimpalli2Gowtham Venkata Kumar Mangina3Naga Kiran Machiraju3Arulmozhivarman Pachiyappan4
 Shridhar Hiremath5
 Venkataseshan Jagannathan5
 Pragasam Viswanathan5
We report the results of the non-invasive photonic system AUM for remote detection and characterization of different pathogenic bacterial strains and mixtures. AUM applies the concepts of elastic light scattering, statistical mechanics, artificial intelligence, and machine learning to identify, classify and quantify various microbes in the scattering volume in real-time and, therefore, can become a potential tool in controlling and managing diseases caused by pathogenic microbes.
Pathogenic bacteria, fungi, viruses, and parasites can travel through various routes (air, water, physical contact, and bodily fluids) and enter their hosts (plants, animals, and humans), causing infectious diseases [1–5]. Airborne microorganisms transmitted through human speech, coughing, sneezing, and exhalation are known to have long residence times in the environment [6–12] and are responsible for the rapid and extensive spread of diseases [13–15]. The increasing incidences of infectious diseases worldwide are a significant cause for concern, pointing out the need for better control and management of diseases. The interplay of pathogenic microbes, their hosts, and the environment, coupled with the complex dynamics of disease emergence, demand rapid, direct detection and identification of airborne microorganisms to prevent transmission and the outbreak of diseases [16]. As a result, various technologies based on nucleic acid, mass spectrometry, cell structure, and optics were reported and are now in use.
Traditional pathogen detection employs morphological and biochemical techniques involving culturing with an enrichment step to isolate the target organisms on an agar plate or to detect pathogens directly from the enriched samples using advanced, sophisticated technologies and molecular techniques [17–25]. In addition, diversified technology combinations in biosensors [18], especially optical biosensors [22], have shown improved capabilities in directly detecting airborne microorganisms. However, the current molecular technologies in use for the identification of components and signal amplification of sensors [17–19], including advanced, sophisticated technologies and techniques (genomic fingerprinting [20, 21], real-time quantitative PCR [24], mass spectrometry [25, 26]), still require on-site sampling and further testing in the laboratory, involves complex operation processes, having long detection times [1–5]. Interestingly, even though the current techniques have high detection efficiency and accuracy, the sampling strategy’s subjectivity and the sampling mechanisms employed are known to have limitations affecting the accuracy of microbe detection [2].
Although on-site air sample detection features a short detection time, flexibility, and convenience, the challenges posed by the effects of in situ environmental parameters, the low concentrations of airborne microbes, and the possibility of occurrence of a broad mix of species at a particular location, lead to practical difficulties. Hence, notwithstanding their limitations and long overturn times, conventional methods and technologies are still widely used for their high specificity and sensitivity in identifying and quantifying pathogens in the air. In addition, traditional culturing is still considered a gold standard for detecting microbes due to its ability to obtain an isolated pure form of the pathogen accurately [27], even though there are difficulties associated with the isolation and maintenance of a novel unidentified or un-culturable number of bacteria and viruses present in the real-world samples.
The growing pathogenic strain variations and antimicrobial resistances demand quick and broad prevention strategies and improved countermeasures to ensure more directed therapeutic interventions through point-of-care testing for the prevention and control of infections [28–30]. Optical technologies have generated significant interest due to their high speed, high throughput, non-destructive nature, and amplification-free measurements that require minimal sample preparation [31].
The optical technologies for the study of microbes can further be categorized based on types of interaction that occur between microbes and light: UV-Visible Spectroscopy, Fluorescence (Bulk Fluorescence Spectroscopy, Fluorescence Imaging), Flow Cytometry, Vibrational Spectroscopy (Raman, Mid-Infrared, Near-Infrared), Scattering (Elastic Scattering, Dynamic Light Scattering, Dynamic Laser Speckle (Bio Speckle), Quantitative Phase Imaging, Differential Dynamic Microscopy, Video Microscopy), and Optical Coherence Tomography.
The principles of Elastic Light Scattering (ELS), which use the characteristics of the spatial distribution of the scattered light with the same wavelength of the illuminating light source, were earlier used to find bioaerosols among complex, diverse atmospheric aerosols with high sensitivity due to its increased signal strength, and the sizeable scattering cross-section, via single-particle or multiple-particle interrogation [32–36], without using specific labelling reagents [32].
All optical technologies either detect a signal for a defined wavelength using a photodiode or other broadband detector or resolve the output as a function of wavelength using a spectral sensor. The collective molecular signature from the sample (cell or a colony) makes up the spectrum, and the level of chemical specificity within a range depends on the spectroscopy type.
Imaging systems, especially time-lapse imaging systems based on CMOS imaging sensors-were used to perform early detection and classification of bacteria. However, limitations in scanning the samples due to the constraints dictated by the field of view of the imaging sensors posed difficulties in probing the volume of samples quickly and effectively. Recent research [37] overcame the limitations by using a Thin Film Transistor (TFT) based imaging sensor to build a real-time Colony Forming Unit (CFU) detection system to count bacterial colonies automatically and rapidly identify their species using deep learning.
Addressing the need for a portable and cost-effective device for long-term monitoring and quantification of various types of pollen which affect human health, Lou et al. [38] presented a label-free sensor that takes holographic images of flowing particulate matter (PM) concentrated by a virtual impactor, which selectively guides particles of a specific size (larger than 6
Optics-based technologies comprise a variety of instrumental configurations by which the signal from bacteria is probed, with or without spatial information, generally from a relatively small sample volume. However, to our knowledge, all the technologies and systems using optics for bacterial identification and characterization involve in-vitro sampling methods, not in situ ones that are desirable. Moreover, the devices are neither portable nor economical for wider deployment for emerging real-world applications. Therefore, a rapid, robust, mobile, low-cost, and in situ device is necessary for bacterial detection, discrimination, and quantification for wider deployment for operational uses in the real world.
Against this backdrop, Tatavarti [39] designed and developed a photonic system AUM (Air Unique-quality Monitor) (Figure 1) capable of detecting, discriminating, and quantifying various air molecules in situ. AUM photonic system comprises a continuous wave laser light source located at the bottom on the system’s front side to illuminate the target volume of air and a position-sensing photodetector positioned at the top on the front side, to detect the backscattered laser light from the target volume. Optical filters in front of the laser source and the photodetector ensure that only the particular wavelength of light from the source passes through and falls back on the photodetector after scattering from aerosols/molecules in the target air volume. AUM system’s backscatter data observations enabled the scatterers' (dust, particulate matter, and different air molecules - which constitute the pollutants) detection, differentiation, and quantification. In the AUM photonic system, the backscattered light from a laser (635
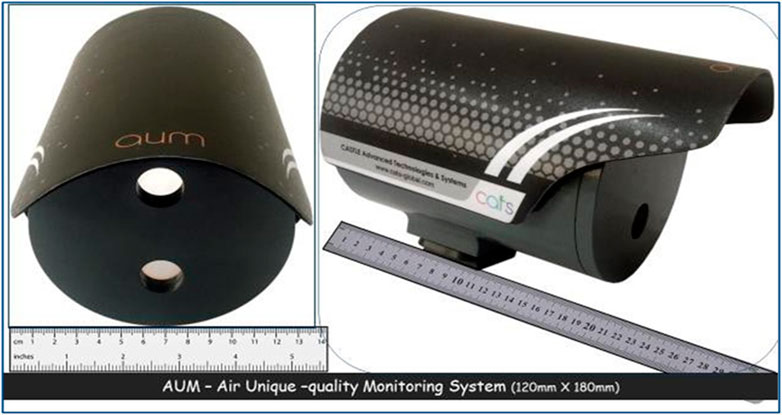
FIGURE 1. AUM photonic system [comprising of a continuous wave laser light source at the bottom on the front side, to illuminate the target volume of air, and, a position sensing photodetector at the top on the front side, to detect the back scattered laser light from the target volume. Optical filters in front of both laser source and the photodetector ensures that only the particular wavelength of light from the source passes through and falls back on the photodetector after scattering from microbes in target volume of air [Picture adopted from Tatavarti, 2021 [38]].
The continuous interrogation of the laser light beam from AUM, with the microbial aerosols in a small air volume, results in optical scattering. The backscattered light characteristics induced by microbial aerosols in the small interrogation volume are captured by the photodetector and monitored by AUM as a function of time. Thus, the backscattered light falling on the PSD carries an imprint of the in situ characteristics of scatterers (bioaerosols) present in the scattering volume.
As ELS can change the spatial distribution and propagation direction of the illuminating light, the information regarding scattering could be monitored and analyzed in real-time analysis for the detection and characterization of aerosol particles (encompassing the range of sizes from 100 nm to 10 mm and concentrations from parts per trillion to parts per million) [39–43], in both point and remote-sensing systems [39, 42]. Furthermore, the principles of ELS suggest that the backscattered light signature patterns carry an imprint of the scatterers' size, concentration, molecular weight, and refractive index per se in multidimensional space. Therefore, the random patterns of points in n-dimensional space, i.e., spatial point processes [44], known to play a unique role in stochastic geometry, can be a valuable model for gaining insights into the phenomena causing them.
The identification of bacteria from optical data measurements from unknown samples generally utilizes multivariate statistical methods (Least Squares, Multiple Regression, Principal Components, Support Vector Machines, Neural Networks, etc.), along with database measurements taken from known samples. Many crucial factors, like the classification level (e.g., genus, species, and strain), the range of bacterial types, and the sample preparation’s influence on variation, affect these databases.
The method most used when seeking a linear model between two variables is the standard Minimum Least-Squared approximation (MLS), also known as linear regression. However, this method has an underlying assumption that the variable chosen as independent is assumed to be noiseless. Furthermore, the underlying belief that the base series is free of noise produces a bias in favour of the base series. Thus, there is a need for an analysis technique that considers the uncertainty in both variables under comparison. One such technique, which involves the Eigen modal decomposition of the covariance matrix, is the Empirical Orthogonal Function analysis (EOF). As conventionally applied to data, empirical orthogonal function (EOF) analysis decomposes spatial and temporally distributed data into modes ranked by their temporal variances. In addition, EOF analysis allows partitioning of large data sets into signal-like and noise-like parts.
EOF analysis is also known as the Principal Component Analysis (PCA) and is quite popular in many fields of study. There are several reasons for this popularity. Probably the most important is that this method often enables a description of the variations of a complex field with a relatively small number of functions and associated time coefficients. This property is fundamental in developing statistical prediction schemes relying on multiple linear regression. The skill and statistical confidence of prediction depend heavily upon a priori methods of reducing the number of available predictors. Secondly, EOF/PCA analysis is popular because the derived empirical functions are often amenable to physical interpretation, which may give substantial insight into complex processes.
PCA accomplishes an orthogonal linear transformation that transforms the data to a new coordinate system such that the most significant variance by some scalar projection of the data comes to lie on the first coordinate (called the first principal component), the second largest variance on the second coordinate, and so on. PCA is a linear dimensionality reduction technique that transforms a set of correlated variables into a smaller number of uncorrelated variables called principal components while retaining as much variation as possible in the original dataset.
Tatavarti and Andrade [45] have demonstrated that the Eigen decomposition technique of Empirical Orthogonal Function (EOF) analysis (or PCA), and a modified Minimum Least Square (MLS) approximation technique is the same. Furthermore, the modified minimum least square approximation technique—involving a revised definition of error, compared to the standard description of the error—is independent of bias on any variable in the analysis, suggesting that PCA is effective on linear data. Of course, one can still do a PCA computation on non-linear data. Still, the results will be meaningless beyond decomposing to the dominant linear modes and providing a global linear representation of the spread of the data.
The principles of ELS suggest that the backscattered light signature patterns carry an imprint of the scatterers' size, concentration, molecular weight, and refractive index per se in multidimensional space [32, 33, 39, 41–43]. Therefore, the random patterns of points in n-dimensional space, i.e., spatial point processes [44], which are known to play a unique role in stochastic geometry, can be a valuable model for gaining insights into the phenomena causing them.
A random medium’s scattering characteristics depend on the medium’s (air, pollutants, and microbes) composition (the geometry, morphology, number, and spatial distribution of its scatterers and their refractive indices). The systems governed by non-linear interactions are ubiquitous in nature and biology. For example, anisotropy can significantly optimize the optical scattering efficiency of a volume of air laden with diverse pollutants and microbes of varying concentrations [42].
The elastic scattering of light by air laden with diverse pollutants and microbes is a function of their size, shape, molecular structure, refractive index, and concentrations of various microbes in the measurement volume and the distance of scatterers from the detector. The interactions of the scattered radiation due to all these parameters are non-linear and can only be considered linear at best under overly simplistic optimal conditions [42]. Therefore, it becomes more prudent to consider the higher-order statistical moments of scatter data to explore the relationships between optical scattering parameters and the scatterers.
Tatavarti [39] demonstrated the real-world application and use of the AUM technology to detect, discriminate and quantify the various pollutants in the air when AUM was collocated with EPA-approved state-of-the-art air quality monitoring stations (comprising multiple sensors for monitoring different parameters) in India at various geographical locations during varying environmental conditions over a long period. The outputs from the collocated AUM and the EPA-approved stations yielded comparable results indicating the effectiveness and utility of real-world applications of AUM in detecting, discriminating, and quantifying the various pollutants in the air.
Recent statistical and machine-learning methods for detecting interactions among features include decision trees and their ensembles: CART [46], Random Forests (RFs) [47], Node Harvest [48], Forest Garrote [49], and Rulefit3 [50], as well as methods more specific to gene-gene interactions with categorical features, such as logic regression [51], multifactor dimensionality reduction [52], and Bayesian epistasis mapping [53]. However, except for RFs, the above tree-based procedures grow shallow trees to prevent overfitting, excluding the possibility of detecting high-order interactions without affecting predictive accuracy [54]. RFs are an attractive alternative, looking at high-order interactions to obtain state-of-the-art prediction accuracy, even though interpreting interactions in the resulting tree ensemble remains challenging.
The AUM photonic system monitors backscattering characteristics in real-time. It determines the attributes of in situ microbes, utilizing a unique algorithm that combines concepts of stochastic geometry with those of artificial intelligence and machine learning. An extended backscatter data matrix is constructed to represent various statistical features of backscattered light data from the observations of the AUM photonic system. From an initial data matrix of M observations of three parameters [i.e., data matrix of size (M × 3)] of the backscattered light Intensity and positional information at desired sampling; N observations of backscattered light data of seven statistical parameters (four statistical moments, and the three statistical features—minimum, maximum and range), over a chosen averaging interval, are computed to form an extended, scattered data matrix of size (N × 35), containing multidimensional information. Data analytical tools and a robust machine learning algorithm (Random Forests algorithm) [47, 54, 55] enabled the extraction of information from large and high-dimensional datasets, thereby identifying structures and enabling detection and discrimination of the various microbial characteristics present in the volume of interrogation of light and matter, which were responsible for the scattering process.
We employed an innovative experimental configuration (Figure 2), where AUM was positioned in an anaerobic chamber to make optical backscattering observations from a small interrogation volume, into which microbial aerosols were introduced continuously as a function of time. To deliver microbial aerosols into the interrogation volume, we used a piston compressor nebulizer which converts the liquid in the machine’s carousel (PBS solution laden with microbes) into a fine mist due to controlled pressurized air. Ensuring that the liquid sample is homogeneously mixed and that the nebulization rate is constant, we determined the change in concentration of bioaerosols injected into the interrogation volume as a function of time.
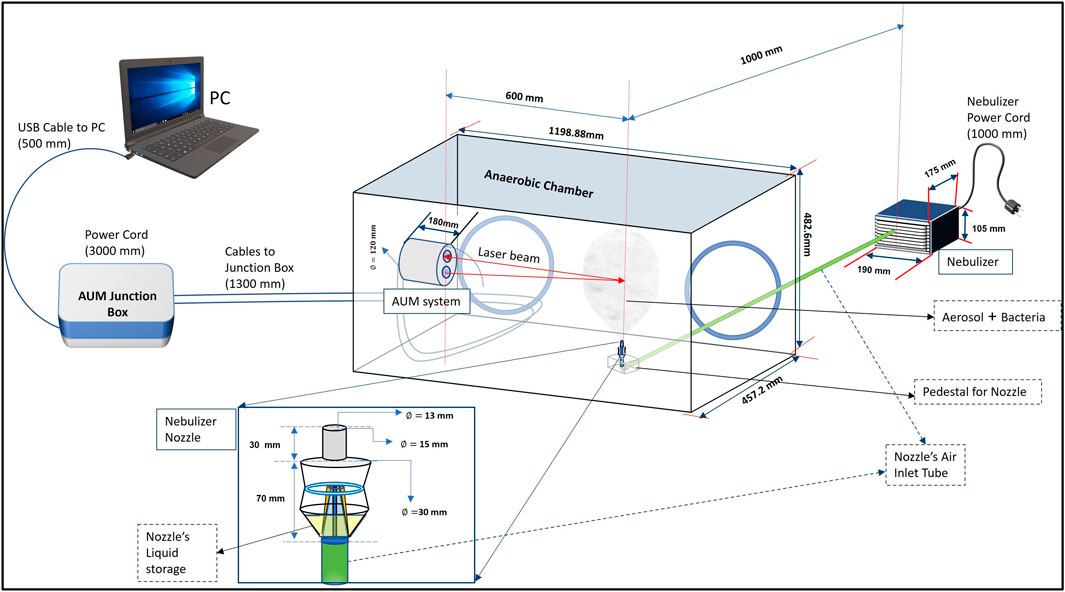
FIGURE 2. Schematic of the experimental configuration for detection of microbes in air—AUM system trials in an anaerobic chamber.
The microbes for this study comprised nine bacterial strains and two mixtures of five bacterial species combinations. Table 1 summarizes the pathogenic bacteria, pre-injection concentrations, and data acquisition details. Table 2 highlights the characteristics of pathogenic bacteria considered for this study. The selected strains and mixtures are known to cause various infections and are resistant to antimicrobial drugs. The samples of pathogenic bacteria were cultured by adopting the gold standard protocols and procedures of cell culture. The selected pathogenic strains were brought to 37°C after retrieving from -80°C and placing them in sterile autoclaved distilled water. Luria-Bertani (LB), a widely used bacterial culture medium for various facultative organisms, was used for this study. LB broth medium was prepared and autoclaved at 121°C for 15
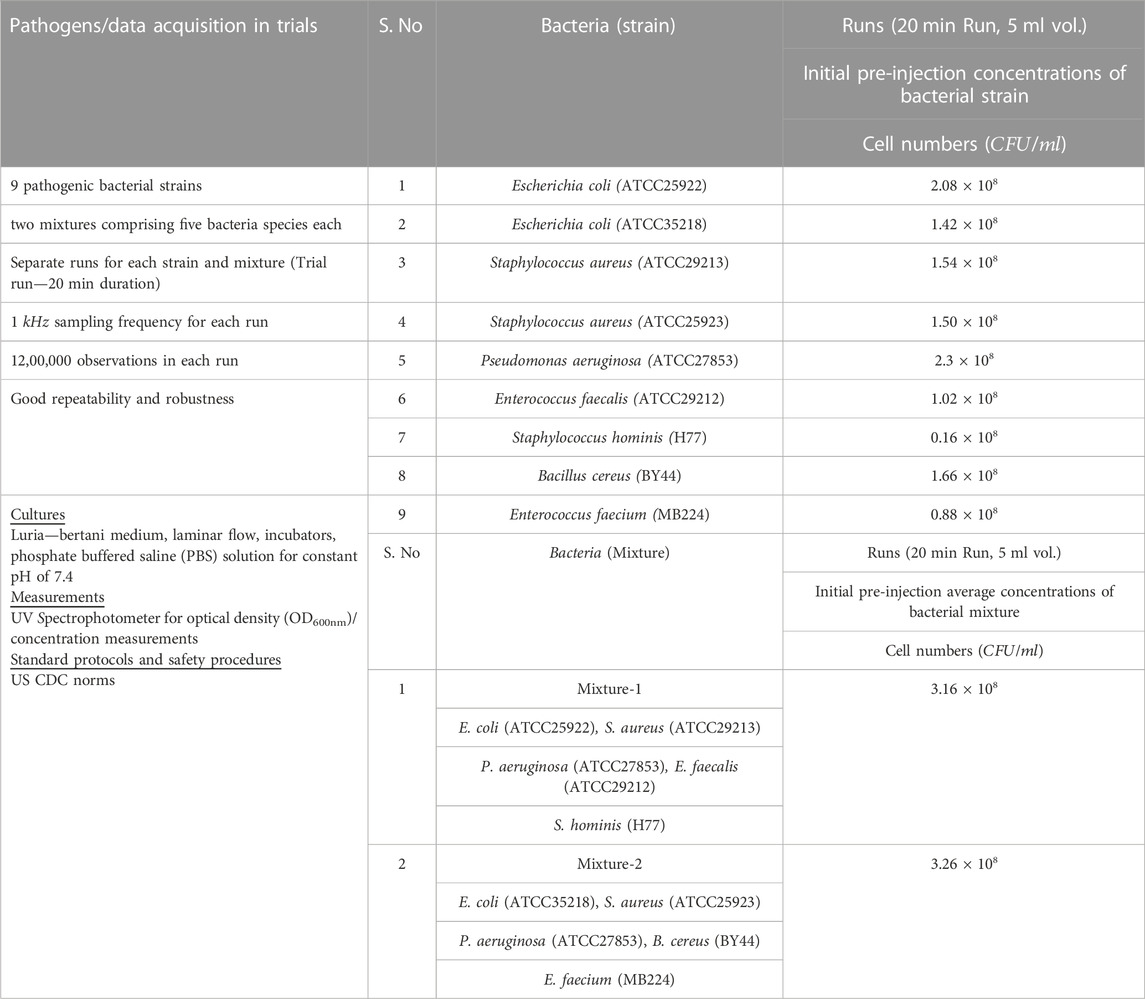
TABLE 1. Photonic system AUM trials with injection details of the samples investigated (bacterial strains and mixtures of bacteria) and their pre-injection concentrations before injection. Cell culture particulars, protocols, and procedures adopted for their classifications using gold standards along with durations of each run are highlighted. For trials with Individual microbe strains as well as with mixtures, concentrations introduced into the anaerobic chamber increased with time during each run. During the various Runs with different bacterial strains, the minimum concentrations of bacterial strains injected, were <10 CFU, while the maximum concentrations ranged from 1.6 × 10⁷ CFU to 2.3 × 10⁸CFU. During the trial runs with mixtures of five bacterial species, the minimum concentrations of bacterial species injected were <10 CFU, while the maximum concentrations ranged from 0.1 × 10⁸ CFU to 3.2 × 10⁸ CFU in the mixtures.
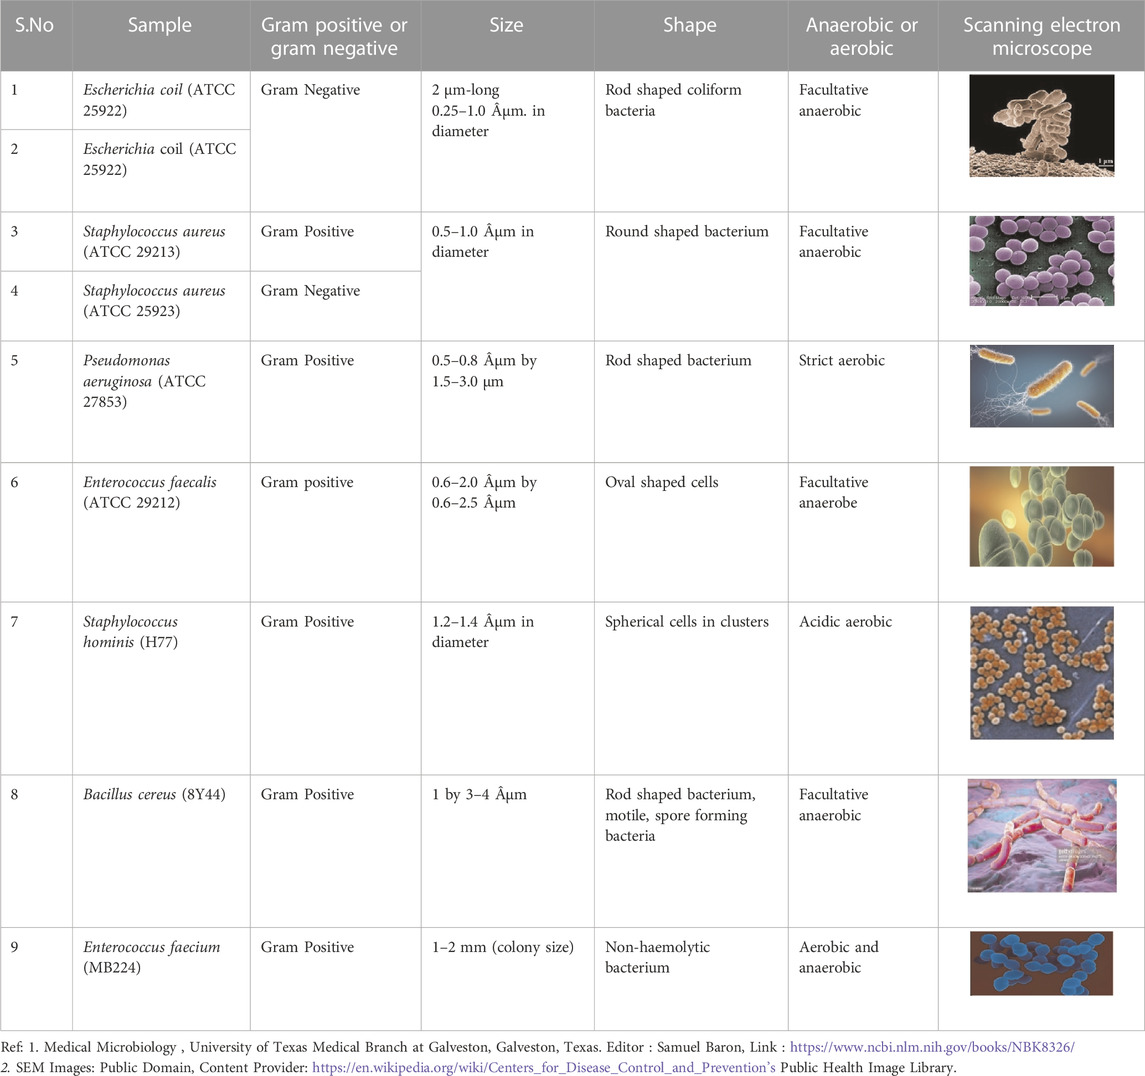
TABLE 2. The physical and biological characteristics of microbes studied along with their SEM pictures.
Tests were conducted by continuously injecting different microbial samples (nine different bacterial strains and two different mixtures of five bacterial species) through the nebulizer for each trial run. During that time, the AUM photonic system recorded the optical backscattered data at a sampling frequency of 1
Figure 3 shows the 3D (three-dimensional) scatter plots of backscattered light detected by the photodetector of the AUM photonic system in ambient conditions and when aerosols laden with PBS solution and nine different bacterial samples were injected into the interrogation volume of light scattering. The 3-D plots reflect the
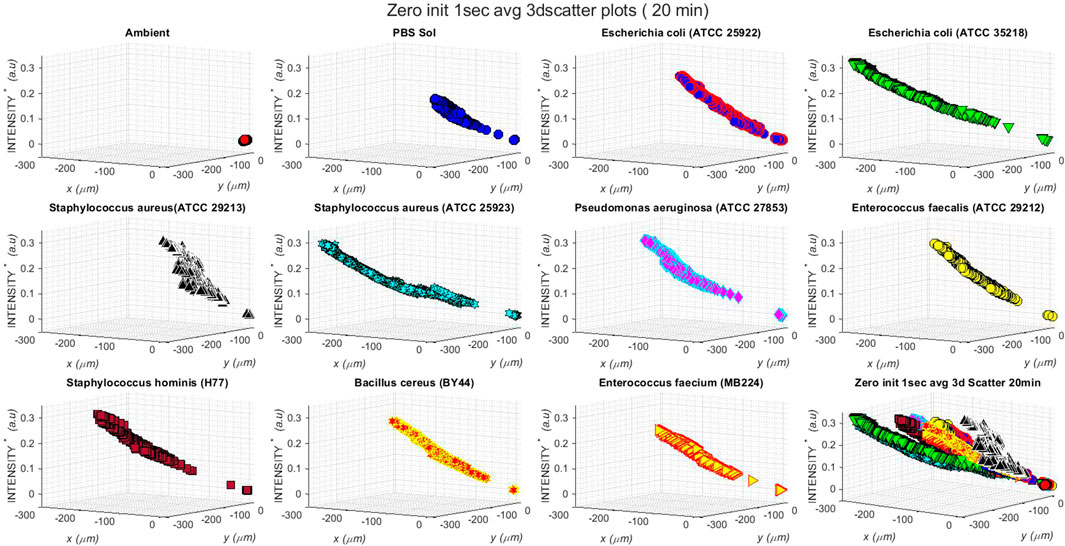
FIGURE 3. Three-dimensional scatter plots of backscattered light detected by the photodetector of AUM photonic system when aerosols laden with PBS solution and different bacterial samples were injected into the interrogation volume of light scattering. The plots show relative changes in x, y positions (in
The 3D backscattered data plots of Figure 3 demonstrate the effects of 1) ambient conditions in the chamber, i.e., ambient air only, when no aerosols were injected (top left subplot); 2) the injection of the aerosolized PBS solution into the anaerobic chamber, with concentration increasing with time (subplot on the top row, second from left); and, 3) the injection of aerosolized pathogenic bacterial strains (nine different strains) into the anaerobic observation chamber of increasing concentration with time (see the nine subplots starting from the top row, third from left to right, to the bottom row third from left).
The static position of the scatter at the origin of the three axes (top left subplot, Figure 3); indicates that there is no influence of ambient air conditions, and there is no optical scattering as there are no aerosols introduced into the measurement volume. With increasing time and therefore increased concentrations of the injected PBS and the nine different bioaerosols in the observation chamber, the data scatter moved diagonally from the bottom right towards the top left direction in each subplot of Figure 3. The 3D backscattered data plot (subplot on the top row, second from left, Figure 3) due to increasing concentrations of PBS solution and the nine bioaerosols (the nine subplots starting from the top row, third from left to right, to the bottom row third from left, Figure 3) in the chamber shows the backscattered light intensity increases with time as the concentrations of scatterers increase in the measurement volume, suggesting a direct linear relationship between the concentration of scatterers and the backscattered light intensity.
The effects of the start and stop of bioaerosol injection in each plot are evident as the initial gap in scatter near the origin of axes and the varying extents of scatter in the negative
To further investigate the role of the characteristics of the scatterers, we normalized the relative scattered light intensity values by the pre-injection concentration values of the respective aerosols injected into the observation chamber and plotted in Figure 4. The multiplication factor of 10–8 in the normalized intensity values is not shown on the vertical axes to avoid clutter in the plot. Again, the first values of the 1-s averaged data were deducted from all the consecutive values of
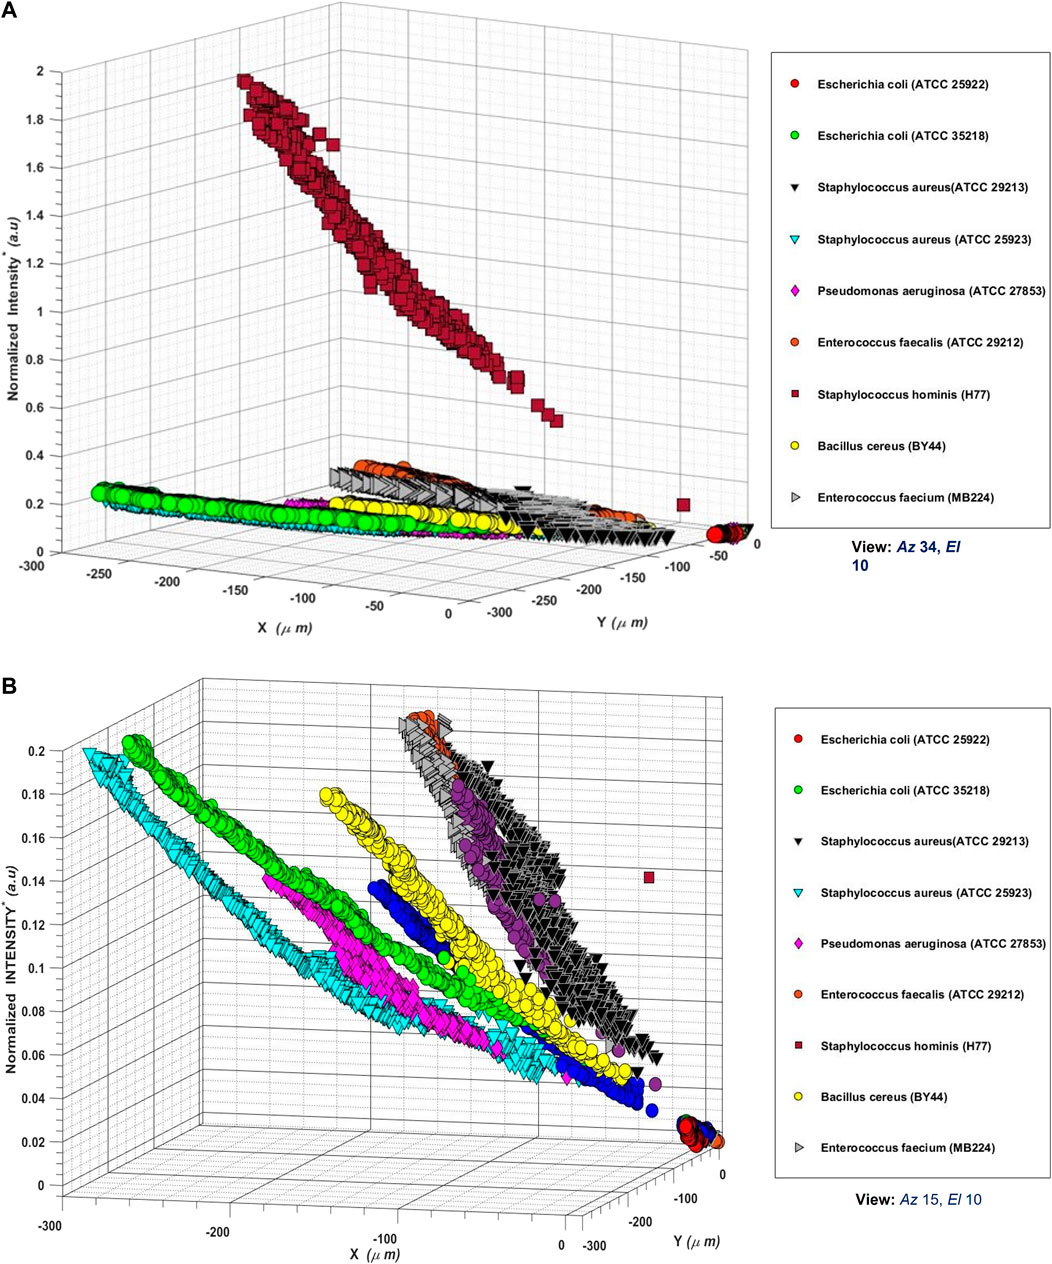
FIGURE 4. (A) Three-dimensional scatter plots of backscattered light detected by the photodetector of AUM photonic system when aerosols laden with different bacterial samples were injected into the interrogation volume of light scattering. The plots show x, y positions (in
Several insights become apparent in Figure 4: 1) the light scattering effects due to different aerosols in the interrogation volume are both detectable and resolvable, underlying the role of size, shape, and structure of the aerosols in the scattering process, 2) not only the different bacterial species but also the different strains of the same species, are detectable and resolvable, underlying the role of the structure and composition of the aerosols, 3) the effect of aerosol size is apparent on the observed scattered intensities, with increased aerosol size resulting in increased scattered light intensity, 4) the effect of aerosol concentration is apparent on the observed scattered intensities, with increased aerosol concentration resulting in increased scattered light intensity, 5) the location of observed light scatter position
The superimposed 3D backscattered data plots, therefore, indicate that backscattered data (from PBS and microbe-laden aerosols having distinct characteristics of size, shape, and structure, with varying concentrations) occupy a unique Euclidian space dictated by the features of the scatterers in the interrogation volume of air; suggesting that backscattered light data analyses can reveal microbe characteristics. Figures 4A, B thus showcase the results of the scatterers' features (size, shape, structure) on the observed backscattered data.
Effects of increasing time and, therefore, increasing concentrations of the microbe-laden aerosols can be seen as the scatter go diagonally from the bottom right (origin of axes) towards the top left direction in each subplot. The artifacts of the start of injection of the bioaerosol sample, and the stop of injection of the bioaerosol samples of varying initial concentrations for each sample run, are reflected as different start and stop positions of scattering in all the 3 days scatter plots. We notice that for each sample run, the 3D scatter begins at the origin of the axes (when there is no injection of bioaerosols). With the inception of bioaerosol injection at a particular concentration, the location of the 3D scatters shifts from the origin of axes towards the negative
In short, Figures 4A, B show that the backscattered beam positions projected on a 2D planar area of (300 × 300 µm) on the photodetector, caused by the scatterers (different strains of bacteria, with concentrations ranging from 10–109 CFU) and the relative normalized scattered light intensity changes due to increasing concentrations of scatterers occupying a range of (0–2
The superposed 3D backscattered plot from all bacterial strains (Figure 4) shows a bouquet of scatter points resolvable in time and space, indicating that the backscattered data about each of the microbe strains/species (having varying sizes, shapes, and concentrations) does indeed occupy a unique n-dimensional Euclidian space, and therefore, using appropriate algorithms can reveal information about the microbe characteristics in real-time.
Table 3 highlights the bacterial species, their initial concentrations, slopes, and normalized (per unit concentrations) slopes of linear fit equations. Figure 4 with Table 3 demonstrates that there is a direct linear relationship between microbe concentration and the backscattered light intensity (with
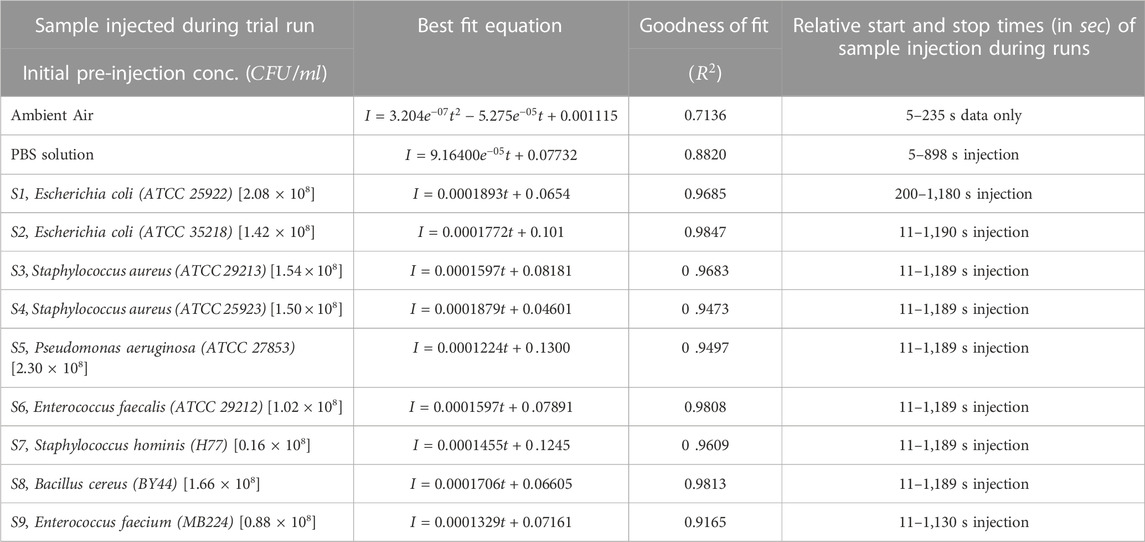
TABLE 3. Best fit equations of the zero-initialized intensity (backscattered) observations of different samples (ambient, PBS solution, nine bacterial strains) with time (i.e., with varying concentrations). The pre-injection concentrations of species and their respective volumes are shown. Data pertain to the trials of 20 min duration runs. The start and stop of injection times (in seconds) of bioaerosol samples during different runs are indicated in the last column.
Figure 5 shows the plots of the pre-injection concentrations of different bacterial strains investigated and the normalized linear slopes (per unit pre-injection concentrations) of the best-fit equations from the observed backscattered intensity data for different bacterial strains during the 20
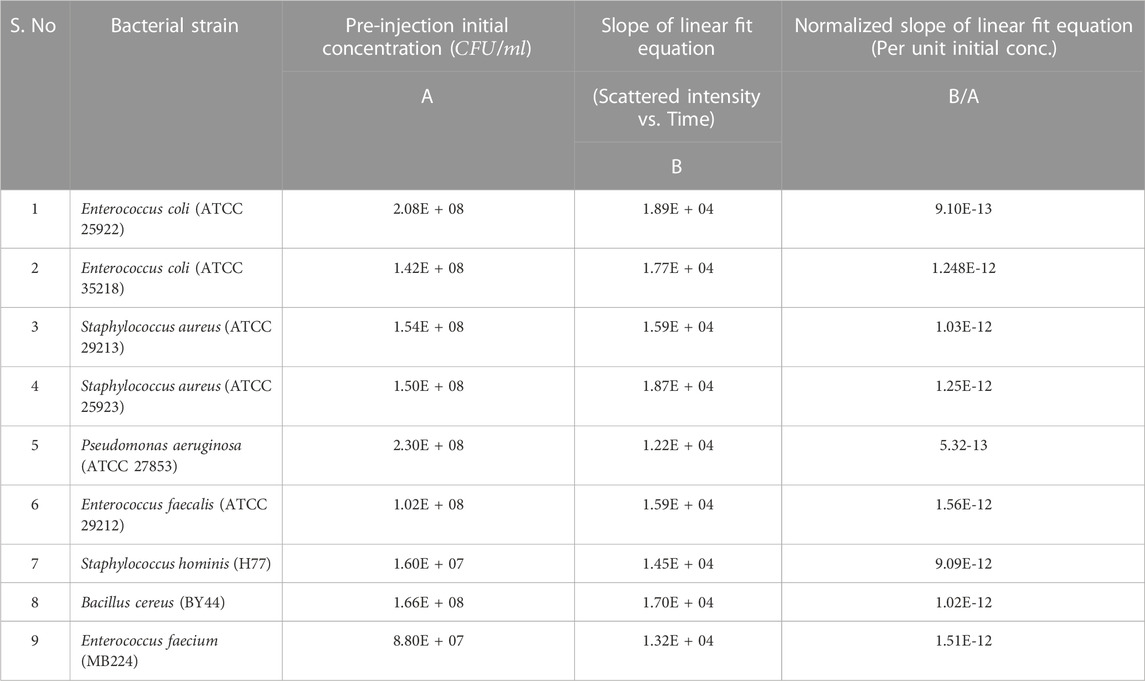
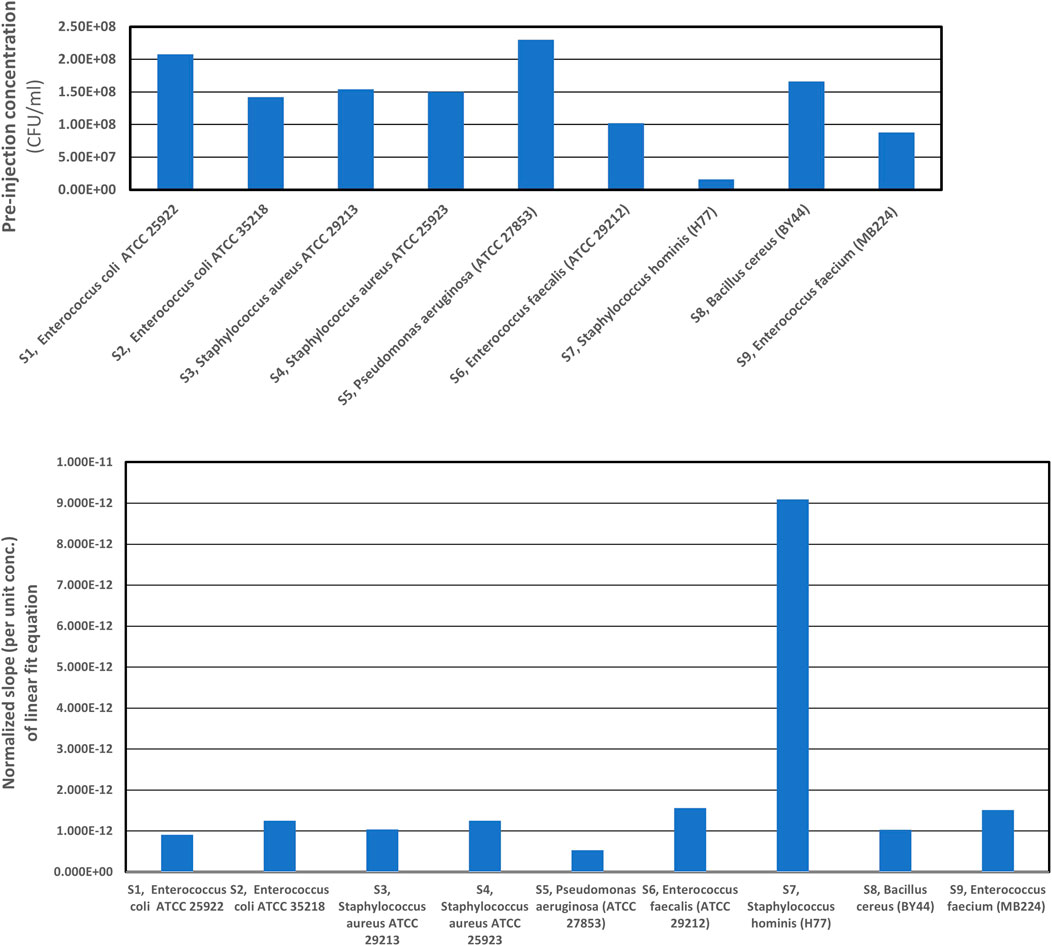
FIGURE 5. Normalized (per unit concentrations) linear slopes of the best fit equations, from the back scattered intensity data for individual bacteria strains computed for 20 min trial runs. We observe that the normalized slopes per unit concentrations are different, for different strains having varied physical characteristics and concentrations. Therefore, one can infer that the relationship between best fit equation’s normalized slope of backscattered light intensity data (see Table 4), the physical characteristics of different bacterial strains (scatterers) as well as the concentration of scatterers in the scattering volume of interrogation is imprinted in the optical back scatter information.
Figure 5 also showcases the special relationship between the normalized slopes of best-fit linear equations of scattered intensity and the concentrations of the scatterers (i.e., as a function of time). Looking at the composite scattered plot of 3-D scattering characteristics of all the individual bacterial strains, we summarize that the aerosols' size, shape, and concentration govern the location of the scattered light beam and its intensity. The plots, therefore, indicate the robust relationship between the best-fit equation’s normalized slope of backscattered light intensity data, physical characteristics, and the concentration of scatterers in the scattering volume of interrogation, further validating the principle that backscattered data is uniquely representative of the physical characteristics and concentration of the scatterers present in the interrogation volume. Thus, AUM’s utility for determining the microbe characteristics (the individual microbial strains/species) in real-time with high sensitivity and specificity is justified.
Table 4 shows the trial details highlighting the two mixtures of bacteria, their compositions, and concentrations for each of the two runs of 20
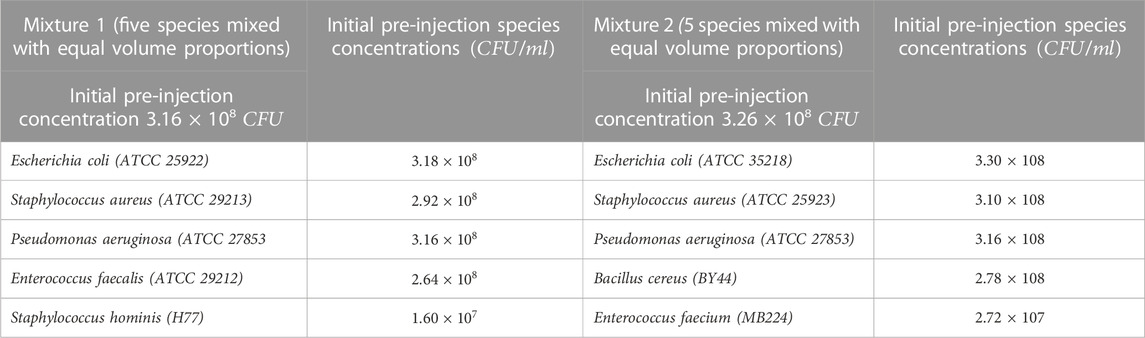
TABLE 4. Trial details highlighting the two mixtures of bacteria, their composition, pre-injection concentrations, for each of the two trial runs of 20
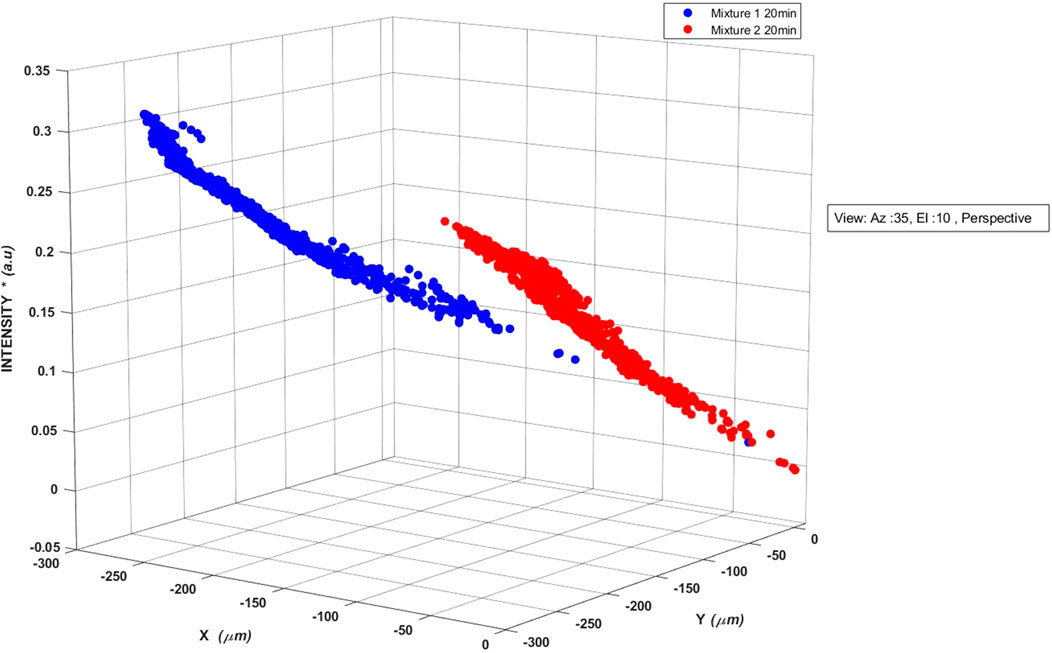
FIGURE 6. Three-dimensional scatter plots of backscattered light detected by the photodetector of AUM photonic system when aerosols laden with different bacterial mixtures were injected into the interrogation volume of light scattering. The multiplication factor of 10–7 in the normalized intensity values is not shown. The superposed 3D backscattered data indicate that backscattered data pertaining to the two different microbial mixtures of species still occupy unique Euclidian space but raises questions regarding resolvability into their constituent individual microbial species. Therefore, the need for appropriate models for resolving the mixture scatter into different individual species present in the mixture.
Nevertheless, the resolvability of the mix into various microbial species warrants additional signal processing. Figure 6 indicates that when a combination of microbes is present, the mixture characteristics can mask the individual species information and validates the necessity for applying the machine learning algorithm on the extended scattering matrix data for extracting microbe information with high sensitivity and specificity. Thus, appropriate signal processing models are needed to resolve the mixture details into the contributions of different species.
The AUM system trials demonstrated that although the backscattered light signature patterns carried an imprint of the scatterers' size, concentration, molecular weight, and refractive index per se in multidimensional space (Figures 3–6), there is a need to apply appropriate signal processing techniques on the observed data to gain additional insights on the scatterers per se. Therefore, we chose Random Forrest machine learning algorithms to tap the information in the non-linear structure of scatter in multidimensional space [45, 46].
By initially training a subset of the optical backscattered data sets with corresponding subsets of microbe data of known features, we created machine learning algorithms for estimating microbe characteristics. Each subset comprised 40% of the total data sets of 12,00,000 data points (i.e., 4,80,000). We have used 80% of the chosen subset of observations for training (3,84,000 data points) and tested the data on the remaining 20% of the subset observations (96,000 data points). The models thus trained and tested not only yielded high predictive performance (correlation coefficients >0.95) but also revealed the feature importance based on Gini impurity values, indicating how much each feature contributed to class prediction, allowing us to iterate on our selection of the features and validate the choice of the statistical features chosen in our Random Forest algorithm [45, 46, 52–54]. Finally, we deployed the trained and tested models (which demonstrated high predictive performance with correlation coefficients >0.95) for further testing and evaluation. Such models were applied to the total (100%) trial run data (12,00,000 data points) to derive microbe characteristics, as shown in Figures 7–10. We hypothesize that such frozen models, for individual species or mixtures of species, can be applied in real-time on any optical backscattered data obtained from the AUM system to determine the relevant microbe characteristics in real-time in the air.
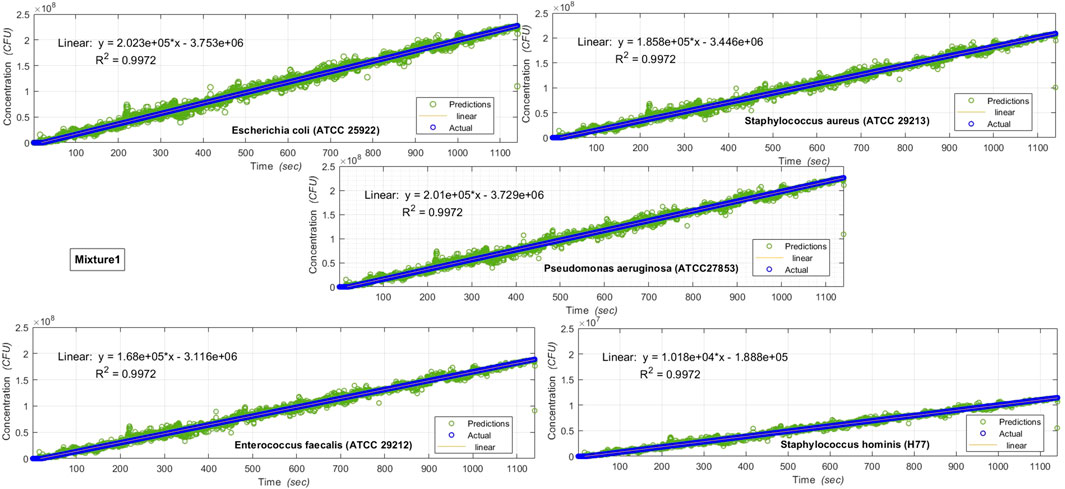
FIGURE 7. Results of various microbe characteristics determined by applying the Multi Variate Random Forest algorithm, on AUM’s backscatter observations during 20
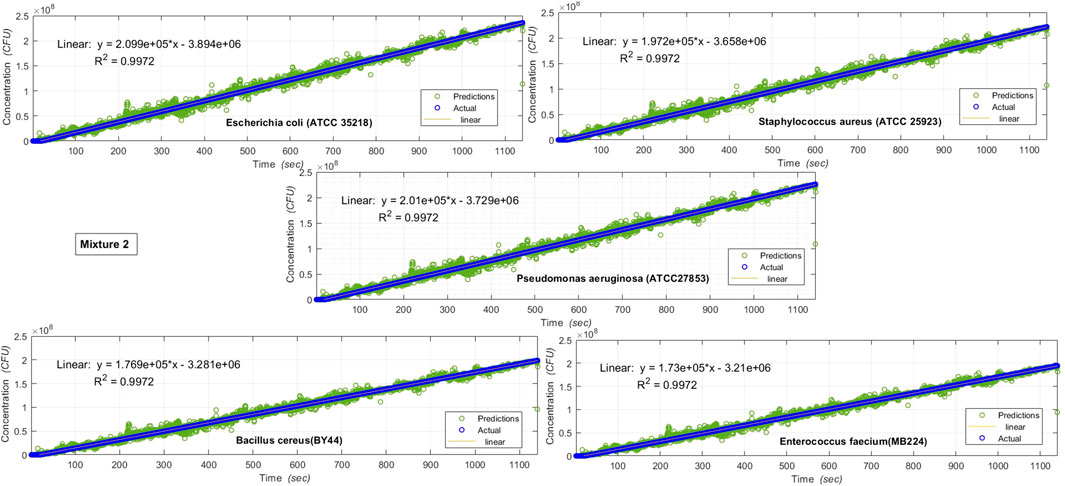
FIGURE 8. Results of various microbe characteristics determined by applying the Multi Variate Random Forest algorithm, on AUM’s backscatter observations during 20
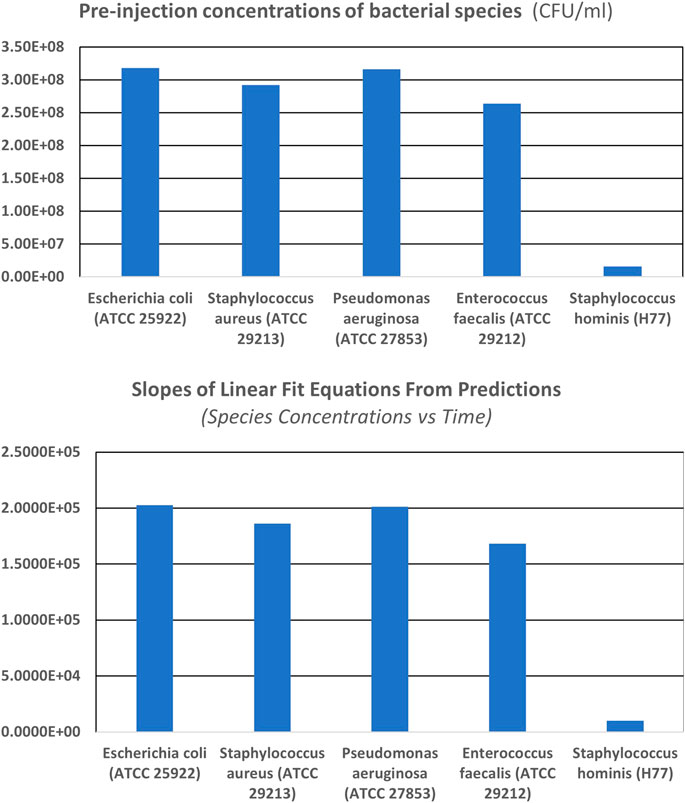
FIGURE 9. Pre-injection concentration (
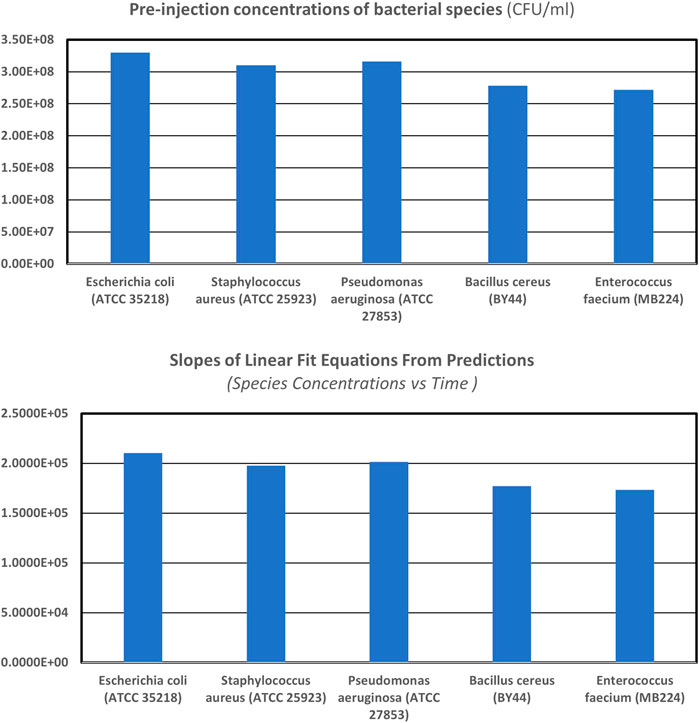
FIGURE 10. Pre-injection concentration (
On applying the machine learning algorithms on the backscattered optical data obtained from AUM, the individual microbe species characteristics (in the mixtures investigated) can be determined, as shown in Figures 7, 8.
Figures 7, 8 show the results of various individual microbe characteristics determined by applying the machine learning (multivariate Random Forest) algorithm [54] on AUM’s backscatter observations during the 20
Figures 9, 10 show that the AUM system’s results for different species, as well as other strains of the same species, are accurate for a wide range of concentrations (
Table 5 details the two mixtures of bacteria, their composition, and pre-injection concentrations for each of the runs, along with the slopes of the linear fit equations from predicted results of concentrations of individual species as a function of time and the normalized slopes (per unit initial concentrations) of linear fit equations. The slopes of linear fit equations are consistent with the pre-injection initial concentrations of individual species of the mixture of scatterers present in the scattering volume of interrogation.

TABLE 5. Trial details highlighting the two mixtures of bacteria, their composition, pre-injection concentrations, for each of the runs along with the slopes of the linear fit equations from predicted results of concentrations of individual species as a function of time, and the normalized slopes (per unit initial concentrations) of linear fit equations. The slopes of linear fit equations are consistent with the pre-injection initial concentrations of individual species of the mixture of scatterers present in the scattering volume of interrogation. The normalized slopes of individual species in the mixtures are identical, showing the dependence only on the average concentration of the mixture in each run.
Figures 9, 10 show the pre-injection concentration (
The experiments conducted in an anaerobic chamber, covering a range of microbial species with varying concentrations, demonstrated AUM’s capabilities to detect, discriminate, and quantify the individual microbes and their mixtures in the air in real-time from a remote location. We showed that the results from gold standard culturing methods and conventional sampling strategies, when compared with those obtained by AUM, yielded
Since air is a central reservoir for microorganisms in controlled environments such as operating theatres, regular microbial monitoring by AUM helps measure air quality and identify critical situations. The rapidly emerging novel airborne viral diseases, with their evolving variants and expedited global spread due to faster modes of transportation for hosts, necessitate a sensitive and specific rapid screening technology, like the AUM photonic system. Therefore, the deployment of AUM for the detection of microbes in the air, with its capability of good resolvability with high specificity and sensitivity, across various ports of entry can be effective and imperative in not only controlling and managing diseases but also in opening new pathways in understanding the complex disease dynamics.
The raw data supporting the conclusion of this article will be made available by the authors, without undue reservation.
RT conceived the research idea and applications after designing and developing AUM. RT, with inputs from SN, AP, and PV designed and conducted the experiments, developed the algorithms and the model for characterization. SH and VJ prepared the microbe samples and characterized them before experimentation with AUM. GM, NK, SN, and PV, helped in data acquisition and analysis. The manuscript was prepared by RT, reviewed, and revised by SN, AP, and PV. All authors have approved the submission of the final version of the manuscript.
The authors acknowledge CATS Eco-Systems Pvt., Ltd., Nashik, India, for providing material support, VIT University for facilities provided at the Centre for Microbial Research during the trials, and GVP-SIRC for research facilities offered, for this study.
GKM and NKM (i.e., 3rd and 4th Authors) were provided fellowships during the tenure of this work, by CATS Eco Systems Pvt Ltd, Nashik, India. CATS Eco Systems Pvt Ltd also facilitated microbial samples for the study. Author SN was employed by the company CASTLE Advanced Technologies and Systems.
The remaining authors declare that the research was conducted in the absence of any commercial or financial relationships that could be construed as a potential conflict of interest.
All claims expressed in this article are solely those of the authors and do not necessarily represent those of their affiliated organizations, or those of the publisher, the editors and the reviewers. Any product that may be evaluated in this article, or claim that may be made by its manufacturer, is not guaranteed or endorsed by the publisher.
1. Ibacache-Quiroga C, Romo N, Díaz-Viciedo R, Alejandro Dinamarca M. Detection and control of indoor airborne pathogenic bacteria by biosensors based on quorum sensing chemical language: Bio-tools, connectivity apps and intelligent buildings. In: Biosensing technologies for the detection of pathogens - a prospective way for rapid analysis (2017). p. 73–88. Chapter 6. doi:10.5772/intechopen.72390
2. Ma J, Du M, Wang C, Xie X, Wang H, Zhang Q. Advances in airborne microorganisms detection using biosensors: A critical review. Front Environ Sci Eng (2021) 15(3):47. doi:10.1007/s11783-021-1420-8
3. Chen Y, Wang Z, Liu Y, Wang X, Li Y, Ma P, et al. Recent advances in rapid pathogen detection method based on biosensors. Eur J Clin Microbiol Infect Dis (2018) 37:1021–37. doi:10.1007/s10096-018-3230-x
4. Lazcka O, Javier Del Campo F, Munoz FX. Pathogen detection: A perspective of traditional methods and biosensors. Biosens Bioelectron (2007) 22:1205–17. doi:10.1016/j.bios.2006.06.036
5. Va'radi L, Jia L, Luo DEH, Perry JD, Anderson RJ, Orengae S, et al. Methods for the detection and identification of pathogenic bacteria: Past, present, and future. Chem Soc Rev (2017) 46:4818–32. doi:10.1039/c6cs00693k
6. Després VR, Huffman JA, Burrows SM, Hoose C, Safatov AS, Buryak G, et al. Primary biological aerosol particles in the atmosphere: A review. Tellus B: Chem Phys Meteorology (2012) 64(1):15598. doi:10.3402/tellusb.v64i0.15598
7. Doremalen N, Bushmaker T, Morris DH, Holbrook MG, Gamble A, Williamson BN, et al. Aerosol, and surface stability of SARS-CoV-2 as compared with SARS-CoV-1. New Engl J Med (2020) 382(16):1564–7. doi:10.1056/nejmc2004973
8. Hoehl S, Rabenau H, Berger A, Kortenbusch M, Cinatl J, Bojkova D, et al. Evidence of SARS-CoV-2 infection in returning travelers from Wuhan, China. New Engl J Med (2020) 382(13):1278–80. doi:10.1056/nejmc2001899
9. Meselson M. Droplets and aerosols in the transmission of SARS-CoV-2. New Engl J Med (2020) 382(21):2063. doi:10.1056/nejmc2009324
10. Anfinrud P, Stadnytskyi V, ChristinaBax PAB. Visualizing speech-generated oral fluid droplets with laser light scattering. New Engl J Med (2020) 382(21):2061–3. doi:10.1056/nejmc2007800
11. Setti L, Passarini F, de Gennaro G, Barbieri P, Perrone MG, Borelli M, et al. SARS-Cov2RNA found on particulate matter of Bergamo in Northern Italy: First evidence. Environ Res (2020) 188:109754. doi:10.1016/j.envres.2020.109754
12. Razzini K, Castrica M, Menchetti L, Maggi L, Negroni L, Orfeo NV, et al. SARSCoV-2 RNA detection in the air and on surfaces in the COVID-19 ward of a hospital in Milan, Italy. Sci Total Environ (2020) 742:140540. doi:10.1016/j.scitotenv.2020.140540
13. Zheng Y, Chen H, Yao M, Li X. Bacterial pathogens were detected from human exhaled breath using a novel protocol. J Aerosol Sci (2018) 117:224–34. doi:10.1016/j.jaerosci.2017.12.009
14. Peláez EC, Estevez MC, Mongui A, Menéndez MC, Toro C, HerreraSandoval OL, et al. Detection, and quantification of HspX antigen in sputum samples using plasmonic biosensing: Toward a real point-of-care (POC) for tuberculosis diagnosis. ACS Infect Dis (2020) 6(5):1110–20. doi:10.1021/acsinfecdis.9b00502
15. Morens DM, Folkers GK, Fauci AS. The challenge of emerging and re-emerging infectious diseases. Nature (2004) 430:242–9. doi:10.1038/nature02759
16. Engering A, Hogerwerf L, Jan S. Pathogen–host–environment interplay and disease emergence. Emerging Microbes & Infections (2013) 2(1):1–7. doi:10.1038/emi.2013.5
17. Shen Z, Wang J, Qiu Z, Jin M, Wang X, Chen Z, et al. Detection of Escherichia coli O157:H7 with piezoelectric immune sensor based on enhancement with immuno-nanoparticles. Acta Microbiologica Sinica (2009) 49(6):820–5.
18. Mavrikou S, Moschopoulou G, Tsekouras V, Kintzios S. Development of a portable, ultra-rapid and ultra-sensitive cell-based biosensor for the direct detection of the SARS-CoV-2 S1 spike protein antigen. Sensors (2020) 20(11):3121. doi:10.3390/s20113121
19. Xu Y, Xie X, Duan Y, Wang L, Cheng Z, Cheng J. A review of impedance measurements of whole cells. Biosens Bioelectron (2016) 77:824–36. doi:10.1016/j.bios.2015.10.027
20. Freije CA, Myhrvold C, Boehm CK, Lin AE, Welch NL, Carter A, et al. Programmable inhibition, and detection of RNA viruses using Cas13. Mol Cel (2019) 76(5):826–37.e11. doi:10.1016/j.molcel.2019.09.013
21. Wang Y, Wang C, Song L. Distribution of antibiotic resistance genes and bacteria from six atmospheric environments: Exposure risk to human. Sci Total Environ (2019) 694:133750. doi:10.1016/j.scitotenv.2019.133750
22. Damborský P, Svitel J, Katrlık J. Optical biosensors. Essays Biochem (2016) 60:91–100. doi:10.1042/ebc20150010
23. Boxrud D. Advances in subtyping methods of foodborne disease pathogens. Curr Opin Biotechnol (2010) 21:137–41. doi:10.1016/j.copbio.2010.02.011
24. Espy MJ, Uhl JR, Sloan LM, Buckwalter SP, Jones MF, Vetter EA, et al. Real-time PCR in clinical microbiology: Applications for routine laboratory testing. Clin Microbiol Rev (2006) 19(3):165–256. doi:10.1128/cmr.19.1.165-256.2006
25. Sauer S, Kliem M. Mass spectrometry tools for the classification and identification of bacteria. Nat Rev Microbiol (2010) 8:74–82. doi:10.1038/nrmicro2243
26. Sandrin TR, Goldstein JE, Schumaker S. MALDI tof ms profiling of bacteria at the strain level: A review. Mass Spectrom Rev (2013) 32:188–217. doi:10.1002/mas.21359
27. Rajapaksha P, Elbourne A, Gangadoo S, Brown R, Cozzolino D, Chapman J. A review of methods for the detection of pathogenic microorganisms. Analyst (2019) 144:396–411. doi:10.1039/c8an01488d
28. Davies SC, 2011. London (2013).Infections and the rise of antimicrobial resistanceAnnu Rep Chief Med Officer
29. Bassetti M, Merelli M, Temperoni C, Astilean A. New antibiotics for bad bugs: Where are we? Ann. Clin Microbiol Antimicrob (2013) 12:22. doi:10.1186/1476-0711-12-22
30. Alarcón-Angeles G, Arturo G, Álvarez-Romero G, Rosati G, Parolo C, Merkoçi A. Point-of-Care sensors in clinical environments: Potential and challenges. In: Reference module in biomedical sciences (2022).
31. Mc Goverin C, Steed C, Essan A, Robertson J, Swift S, Vanholsbheeck F. Optical Methods for bacterial detection and characterization. APL Photon (2021) 6:080903. doi:10.1063/5.0057787
32. Wyatt PJ. Differential light scattering: A physical method for identifying living bacterial cells. Appl Opt (1968) 7(10):1879–96. doi:10.1364/ao.7.001879, No.
33. Kerker M. Light scattering instrumentation for aerosol studies: An historical overview. Aerosol Sci Tech (1997) 27(4):522–40. doi:10.1080/02786829708965492
34. Holler S, Pan YL, Chang RK, Bottiger JR, Hill SC, Hillis DB. Two-dimensional angular optical scattering for the characterization of airborne microparticles. Opt Lett (1998) 23(18):1489–91. doi:10.1364/ol.23.001489
35. Yong-Le Pan KBA, Chang RK, Hart M, Eversole JD, Eversole JD. Characterizing and monitoring respiratory aerosols by light scattering. Opt Lett (2003) 28:589–91. doi:10.1364/ol.28.000589
36. Robinson JP, Rajwa BP, Bae E, Patsekin V, Roumani AM, Bhunia AK, et al. Using scattering to identify bacterial pathogens. Washington DC: OPN Optics & Photonics News (2011). 21–7.
37. Li Y, Liu T, Wang H, O’Riordan K, Bai B, Haga Y, et al. Hatice Ceylan Koydemir Deep learning-enabled detection and classification of bacterial colonies using a thin-film transistor (TFT) image sensor, ACS Photon (2022) 9, 2455–66. doi:10.1021/acsphotonics.2c00572
38. Luo Y, Zhang Y, Liu T, Yu A, Wu Y, Ozcan A. Virtual impactor-based label-free pollen detection using holography and deep learning, ACS Sensors (2022) 7 (12), 3885–94. doi:10.1021/acssensors.2c01890
39. Rao T. Ambient air quality monitoring: Impetus, complexities, challenges and solutions. Glob J Sci Frontier Res (2021) 21(4):41–58. doi:10.34257/gjsfrhvol21is4pg41
40. Bae E, Bhunia AK. Label-free light-scattering sensors for high throughput screening of microbes in food. High throughput screening for food safety assessment. Biosensor technologies, hyperspectral imaging and practical applications. Sawston, Cambridge: Woodhead Publishing Series in Food Science, Technology and Nutrition (2015). 149–63.
41. Pan Y, Kevin A, Arnold J, Cheng S, Kalume A, Piedra CW, et al. (2022). Review of elastic light scattering from single aerosol particles and application in bioaerosol detection. J Quantitative Spectrosc Radiative Transfer, 279, 108067–23. doi:10.1016/j.jqsrt.2022.108067
42. James Davis E, Schweiger G. Elastic light scattering. In: The airborne microparticle: Its Physics, chemistry, optics, and transport phenomena. Berlin: Springer (2002).
43. Ogendal LH. Light scattering demystified: Theory and practice. Copenhagen: University of Copenhagen (2017). 125.
44. Baddeley A, Bárány I, Schneider R. Spatial point processes and their applications. In Stochastic geometry: Lectures given at the CIME summer school held in martina franca Italy, september (2007) 13–18, 1–75.
45. Tatavarti R, Andrade Y. The eigenvalue problem as a form of minimum least-squared approximation. Ocean Engng (1992) 19(6):511–26. doi:10.1016/0029-8018(92)90021-u, No
46. Breiman L, Friedman J, Stone CJ, Olshen RA. Classification and regression trees. Belmont, CA: CRC Press (1984).
50. Friedman JH, Popescu BE. Predictive learning via rule ensembles. Ann Appl Stat (2008) 2:916–54. doi:10.1214/07-aoas148
51. Ruczinski CKI, LeBlanc ML, Hsu L. Sequence analysis using logic regression. Genet Epidemiol (2001) 21:S626–31. doi:10.1002/gepi.2001.21.s1.s626
52. Ritchie MD, Hahn LW, Roodi N, Bailey LR, Dupont WD, Parl FF, et al. Multifactor-dimensionality reduction reveals high-order interactions among estrogen-metabolism genes in sporadic breast cancer. Am J Hum Genet (2001) 69:138–47. doi:10.1086/321276
53. Zhang Y, Liu JS. Bayesian inference of epistatic interactions in case-control studies. Nat Genet (2007) 39:1167–73. doi:10.1038/ng2110
54. Hoffmann J, Bar-Sinai Y, Lee LM, Andrejevic J, Mishra S, Rubinstein SM, et al. Machine learning in a data-limited regime: Augmenting experiments with synthetic data uncovers order in crumpled sheets. Sci Adv (2019) 5:eaau6792. doi:10.1126/sciadv.aau6792
Keywords: photonic system, real-time, detection, discrimination, quantification, microbes in air
Citation: Tatavarti R, Nadimpalli S, Mangina GVK, Kiran Machiraju N, Pachiyappan A, Hiremath S, Jagannathan V and Viswanathan P (2023) Photonic system for real-time detection, discrimination, and quantification of microbes in air. Front. Phys. 11:1118885. doi: 10.3389/fphy.2023.1118885
Received: 10 December 2022; Accepted: 20 March 2023;
Published: 13 April 2023.
Edited by:
Rajib Biswas, Tezpur University, IndiaReviewed by:
Antonio Sasso, University of Naples Federico II, ItalyCopyright © 2023 Tatavarti, Nadimpalli, Mangina, Kiran Machiraju, Pachiyappan, Hiremath, Jagannathan and Viswanathan. This is an open-access article distributed under the terms of the Creative Commons Attribution License (CC BY). The use, distribution or reproduction in other forums is permitted, provided the original author(s) and the copyright owner(s) are credited and that the original publication in this journal is cited, in accordance with accepted academic practice. No use, distribution or reproduction is permitted which does not comply with these terms.
*Correspondence: Rao Tatavarti, cnRhdGF2YXJ0aUBnbWFpbC5jb20=
Disclaimer: All claims expressed in this article are solely those of the authors and do not necessarily represent those of their affiliated organizations, or those of the publisher, the editors and the reviewers. Any product that may be evaluated in this article or claim that may be made by its manufacturer is not guaranteed or endorsed by the publisher.
Research integrity at Frontiers
Learn more about the work of our research integrity team to safeguard the quality of each article we publish.