
95% of researchers rate our articles as excellent or good
Learn more about the work of our research integrity team to safeguard the quality of each article we publish.
Find out more
BRIEF RESEARCH REPORT article
Front. Phys. , 07 February 2023
Sec. Medical Physics and Imaging
Volume 11 - 2023 | https://doi.org/10.3389/fphy.2023.1077696
This article is part of the Research Topic Advances in Quantitative Ultrasound Imaging: Functional Imaging and Tissue Characterization View all 6 articles
 Mototaka Arakawa1,2*
 Kyohei Higashiyama1
 Shohei Mori2Satoshi Yashiro3
 Yasushi Ishigaki3Hiroshi Kanai1,2
In this study, the attenuation coefficient of blood was measured in vivo in the frequency range of 10–45 MHz. A procedure to correct the distribution of sound pressure in the measurements was discussed. Further, in vivo measurements were applied on the dorsal hand vein of four healthy subjects at rest and during avascularization. As a preliminary result, less variation of the measured attenuation coefficients was achieved by the proposed method. The comparable results of the inclination of the attenuation coefficients were obtained at rest and during avascularization. Furthermore, the attenuation coefficients during avascularization were markedly higher than those at rest, reflecting the degree of red blood cell aggregation promoted by avascularization. This method may aid in the non-invasive evaluation of blood properties reflecting the degree of red blood cell aggregation.
Cardiovascular diseases (CVD) are one of the leading causes of death worldwide, and atherosclerosis is the primary factor for CVD development [1] and is closely related to the physical and chemical properties of blood [2]. Therefore, evaluating blood properties is crucial for early diagnosis of arteriosclerosis.
The elevation of lipid concentration not only increases the viscosity in blood but also promotes the progression of atheroma formation [3]. Notably, blood viscosity values are highly correlated with blood pressure and are higher in patients with hypertension [4] as well as dyslipidemia and diabetes. By focusing on the propagation of ultrasonic waves in viscoelastic media, the higher the viscosity, the greater the attenuation coefficient [5]. Therefore, in vivo non-invasive measurements of the attenuation coefficient of blood are expected to be effective for screening atherosclerosis.
The attenuation coefficient of human blood has been measured by several researchers [6–18]. However, most of these coefficient values were obtained from sampled blood [6–12, 15, 16, 18]. Moreover, the attenuation coefficients were measured below 10 MHz [6–11, 15], and the measurements were not conducted around the human body temperature [10, 11, 15], or the measurement temperature was not provided [6, 8, 12, 16]. Secomski et al. measured the attenuation coefficient of blood in vivo [13, 14, 17]. They measured the depth dependence of the power of a Doppler signal backscattered in a blood vessel. However, as the objective of their study was to determine the level of hematocrit, the measurement results at 16 and 20 MHz [13] or only 20 MHz [14, 17] were used considering the sensitivity of their experimental system to the hematocrit level of blood. Therefore, the frequency dependence of the attenuation coefficient of blood in vivo was not discussed.
We have been studying methods for evaluating the size of red blood cell (RBC) aggregates by analyzing the scattering power spectrum obtained via ultrasonic backscattering measurements of RBCs [19–24]. Notably, the backscattering power obtained from a single sphere significantly depends on the frequency for each aggregate size [25], and the larger the diameter of a sphere, the smaller the slope of the frequency dependence of the power spectrum. The size of RBC aggregates is estimated by fitting the slope of the measured power spectrum to that of a single scattering sphere’s theoretically obtained scattering characteristics. To extract the scattering property from RBC aggregates, the power spectrum obtained from the vascular lumen is normalized by that obtained from the posterior wall of a blood vessel [20–23] or compared with the reference scattering spectrum [24]. To estimate the size of RBC aggregates with greater accuracy, the attenuation coefficients of the skin and blood must be measured, and the attenuation property differences between the two power spectra must be corrected [22–24]. To measure the attenuation coefficient, power spectra at only two different depths were used. Then, there was a problem that the variation of the measured attenuation coefficients was large.
In the present study, first, a procedure to correct the distribution of sound pressure in the measurements was discussed. Furthermore, as a preliminary study, we non-invasively measured the attenuation coefficient of blood in a dorsal hand vein in the frequency range of 10–45 MHz at rest and during avascularization for four subjects to show the possibility for an evaluation method of the blood property. A procedure to robustly measure the attenuation coefficient of blood was experimentally discussed.
The experimental setup for measuring the attenuation coefficient using a high-frequency ultrasonic probe is depicted in Figure 1. The method in the present study is based on the spectral log difference method [26, 27]. However, it is difficult to prepare a reference phantom with a known attenuation coefficient in the frequency range in the present study. Therefore, the sound pressure property difference between different depths was corrected by measuring reflection spectra from the flat plate in water [24]. Ultrasonic waves transmitted from the ultrasound probe propagated through water in the membrane and skin and then irradiated the vascular lumen. Waves scattered from the RBCs in the vascular lumen were received using the same ultrasonic probe. The power spectrum
where
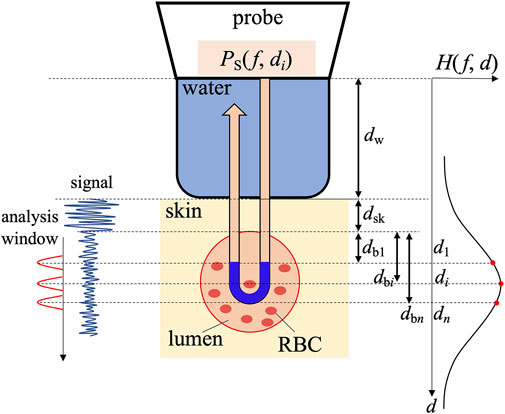
FIGURE 1. Experimental arrangement for the measurement of the attenuation coefficient of blood.
In our experiment, we set two points along an ultrasonic beam at depths
As illustrated in Figure 1, because the acoustic path is approximately divided into a path in water with a propagation length
where
Let us assume that the attenuation property
By applying Eq. 4 to Eq. 3, the following equation can be derived:
where
where
Thus, to determine
As well as Eq. 1, the power spectrum
where
where
where
By substituting Eqs 9, 10 into Eq. 7, we can obtain the attenuation coefficient
where
This denotes the power spectrum whose sound property
Therefore, the procedure for estimating the attenuation coefficient
The robustness of the attenuation coefficient
A high-frequency ultrasound system (Tomey UD-8000) was used for subsequent in vivo experiments. The sampling frequency was 240 MHz. A mechanical scanning linear probe comprising a concave transducer with an operating central frequency of 30 MHz (frequency range: 19–40 MHz) was connected to the ultrasound system. The focal length of the probe
Prior to the in vivo measurement, the sound pressure
As a preliminary study, in vivo measurements were applied on the dorsal hand vein of four healthy subjects A, B, C, and D for 20 s. The diameters of the dorsal hand vein (approximately 2–3 mm) were much larger than the wavelength (51 μm at 30 MHz). These measurements were approved by the Ethics Committee of the Graduate School of Engineering, Tohoku University, and all the participants agreed to participate in the present study. RF signals scattered from the lumen were obtained using ultrasonic short-axis measurements [29]. The focal depth
Data for five frames were acquired every 10 s for control from 0 s to 60 s, avascularization was applied immediately after the measurement at 60 s, and data for 13 frames were acquired for 70–190 s every 10 s. RF data along 15 beams passing through the center of the vascular lumen were used in each frame. The power spectrum was obtained by windowing the RF signals using a Hanning window with a length of 0.15 μs at each depth
Figures 2A, B depict ultrasonic short-axis B-mode images of the vascular lumen in the dorsal hand vein at rest and during avascularization for subject A, respectively. The lumen brightness in Figure 2B appears higher than that in Figure 2A owing to the increased scattering power caused by RBC aggregation. As illustrated in each B-mode image, the central depths
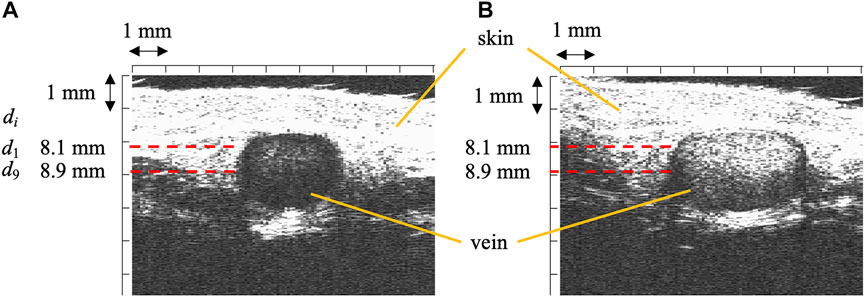
FIGURE 2. B-mode images of the dorsal hand vein (A) at rest and (B) during avascularization.
Figures 3A, B present the corrected power spectra
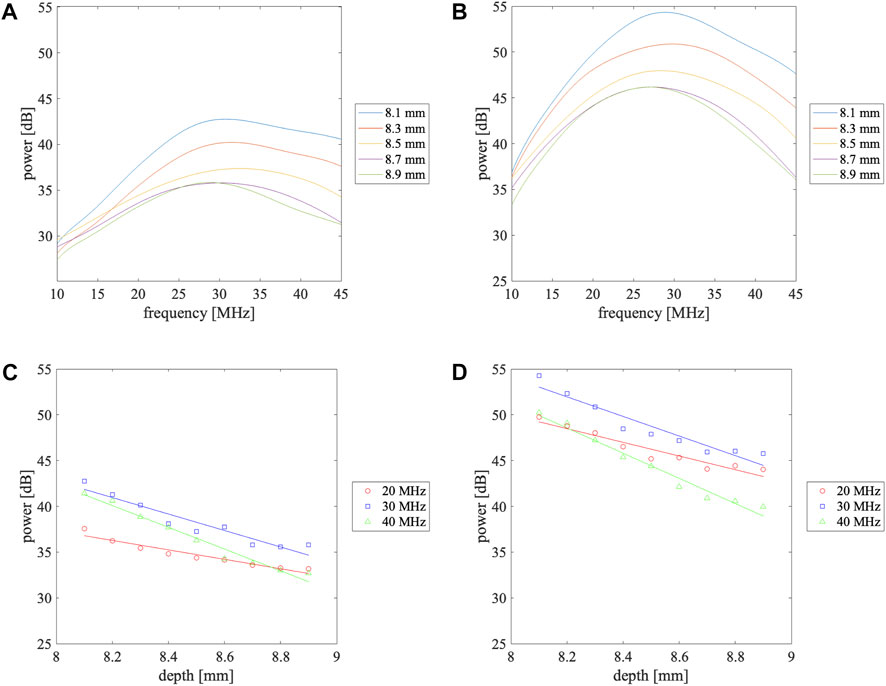
FIGURE 3. Power spectra measured at different depths in the vascular lumen (A) at rest and (B) during avascularization and depth dependence of the power received from the vascular lumen at 20, 30, and 40 MHz (C) at rest and (D) during avascularization. The solid lines in (C) and (D) are the linearly approximated line.
Using Eq. 11, the attenuation coefficient
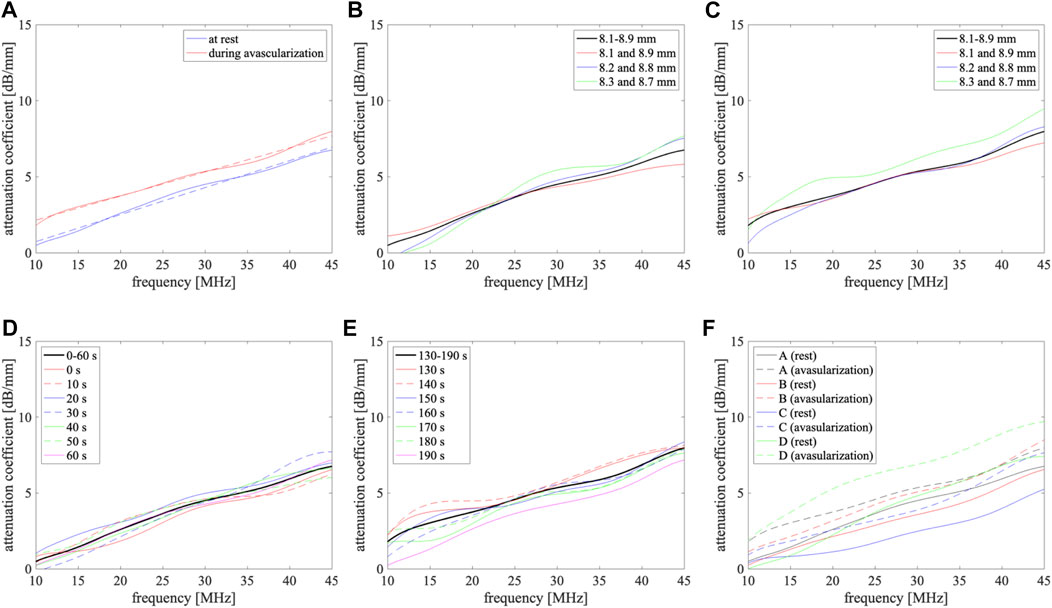
FIGURE 4. Attenuation coefficients of blood at rest and during avascularization. (A) Subject A, solid lines: measured results using power spectra from 8.1 mm to 8.9 mm at 0.1 mm intervals, dashed lines: linearly approximated lines; (B,C) at rest and during avascularization for subject A, respectively, black line: obtained using power spectra from 8.1 mm to 8.9 mm at 0.1 mm intervals, red, blue, and green lines: obtained from power spectra at two depths {8.1 mm and 8.9 mm}, {8.2 mm and 8.8 mm}, and {8.3 mm and 8.7 mm}, respectively; (D,E) at rest and during avascularization for subject A, respectively, black line: obtained using seven frames, the other lines: obtained from power spectra with each frame from 0 to 60 s and from 130 to 190 s; (F) subjects A (black), B (red), C (blue), and D (green), solid lines: at rest, dashed lines: during avascularization.
As shown in Figures 4B, C, the improvement of the robustness of the measured attenuation coefficients was confirmed by setting plural analysis depths. In this study, the analysis points were set from 8.1 to 8.9 mm at 0.1-mm intervals. It is difficult to expand the analysis region because of the signal-to-noise ratio of the received signals and the size of the blood vessel. To increase the analysis points, it is necessary to shorten the interval. In contrast, measured attenuation coefficients differed at each frame from Figures 4D, E. Therefore, the discussion of the relationship between measurement accuracy and the number of analysis points is necessary for our future work.
The attenuation coefficients for four subjects A-D were 2.5–4.8 dB/mm at rest and 3.9–5.3 dB/mm during avascularization at 30 MHz. The attenuation coefficients in blood strongly depend on the hematocrit level [17]. Therefore, the attenuation coefficient differences among subjects could be caused by the differences in blood properties. The relationship between the attenuation coefficients and blood properties will be investigated in the future.
The average attenuation coefficients at rest,
There is blood flow in vivo. Laminar flow is assumed in the dorsal hand vein. Then, the blood velocities are the highest in the center of the blood vessel and the lowest near the anterior and posterior walls in the depth direction. The lowest velocity might cause red blood cell aggregation as well as during avascularization because of the low shear rate. In the present study, the focal point of the probe (
In contrast,
To correct the ratio of the sound pressure properties, a flat plate was used as a reflector. The analysis was based on the plane wave model. In contrast, a mechanical scanning linear probe comprising a concave transducer was used. Therefore, aberration could also affect the result. The effect will be discussed in the future by a simulation experiment or an experimental investigation using a reference phantom whose attenuation coefficient is measured by the pulse transmission method.
In this study, the attenuation coefficient of blood was measured in vivo at 10–45 MHz at rest and during avascularization. For this, the differences in sound pressure properties among several measurement points were measured using a flat plate placed in water in advance, and the values were used for correction. In vivo measurements were applied in the dorsal hand vein of four healthy subjects. As a preliminary result, less variation of the measured attenuation coefficients was achieved by the proposed method. The comparable results of the inclination of the attenuation coefficients were obtained at rest and during avascularization. Furthermore, the attenuation coefficient during avascularization
Hereafter, we aim to improve our evaluation of sound properties, including the effect of different media, and we aim to include other subjects, such as arteriosclerosis patients, to demonstrate the usefulness of the non-invasive method for evaluating blood properties.
The original contributions presented in the study are included in the article/supplementary material, further inquiries can be directed to the corresponding author.
The studies involving human participants were reviewed and approved by Ethics committee concerning medical research involving humans Graduate School of Engineering, Tohoku University. The patients/participants provided their written informed consent to participate in this study.
Study design, data processing, interpretation of data, and manuscript writing, MA; experimental work and data processing, KH; study support and interpretation of data, SM; study support, SY; study support and manuscript review, YI; study design, interpretation of data, and manuscript review, HK. All Authors have read the manuscript and agreed to the published version of the manuscript.
This work was partially supported by JSPS KAKENHI 21H03835.
The authors declare that the research was conducted in the absence of any commercial or financial relationships that could be construed as a potential conflict of interest.
All claims expressed in this article are solely those of the authors and do not necessarily represent those of their affiliated organizations, or those of the publisher, the editors and the reviewers. Any product that may be evaluated in this article, or claim that may be made by its manufacturer, is not guaranteed or endorsed by the publisher.
1. Ross R. Atherosclerosis – An inflammatory disease. N Engl J Med (1999) 340:115–26. Available at: https://www.nejm.org/doi/full/10.1056/NEJM199901143400207 (Accessed January 31, 2023).
2. Fossum E, Høieggen A, Moan A, Nordby G, Velund TL, Kjeldsen SE. Whole blood viscosity, blood pressure and cardiovascular risk factors in healthy blood donors. Blood Press (1997) 6:161–5. doi:10.3109/08037059709061932
3. Rasyid A, Harris S, Kurniawan M, Mesiano T, Hidayat R. Fibrinogen and LDL influence on blood viscosity and outcome of acute ischemic stroke patients in Indonesia. Ann Neurosci (2019) 26:30–4. doi:10.1177/0972753119900630
4. Letcher RL, Chien S, Pickering TG, Sealey JE, Laragh JH. Direct relationship between blood pressure and blood viscosity in normal and hypertensive subjects: Role of fibrinogen and concentration. Am J Med (1981) 70:1195–202. doi:10.1016/0002-9343(81)90827-5
6. Carstensen EL, Li K, Schwan HP. Determination of the acoustic properties of blood and its components. J Acoust Soc Am (1953) 25:286–9. doi:10.1121/1.1907033
7. Carstensen EL, Schwan HP. Acoustic properties of hemoglobin solutions. J Acoust Soc Am (1959) 31:305–11. doi:10.1121/1.1907716
8. Woodcock JP. Ultrasonic absorption – a new technique. Ultrasonics (1970) 8:213–5. doi:10.1016/0041-624X(70)91036-X
9. Kikuchi Y, Okuyama D, Kasai C, Yoshida Y. Measurements on the sound velocity and the absorption of human blood in 1-10 MHz frequency range (In Japanese). Rec Semin Tohoku Univ (1972) 41:152–9.
10. Shung KK, Reid JM. The acoustical properties of deoxygenated sickle cell blood and hemoglobin S solution. Ann Biomed Eng (1977) 5:150–6. doi:10.1007/BF02364015
11. Narayana PA, Ophir J, Maklad NF. The attenuation of ultrasound in biological fluids. J Acoust Soc Am (1984) 76:1–4. doi:10.1121/1.391097
12. Lockwood GR, Ryan LK, Hunt JW, Foster FS. Measurement of the ultrasonic properties of vascular tissues and blood from 35–65 MHz. Ultrasound Med Biol (1991) 17:653–66. doi:10.1016/0301-5629(91)90096-F
13. Secomski W, Nowicki A, Tortoli P. Estimation of hematocrit by means of attenuation measurement of ultrasonic wave in human blood. Proc IEEE Ultrason Symp (2001) 1277–80. doi:10.1109/ULTSYM.2001.991953
14. Secomski W, Nowicki A, Guidi F, Tortoli P, Lewin PA. Noninvasive in vivo measurements of hematocrit. J Ultrasound Med (2003) 22:375–84. doi:10.7863/jum.2003.22.4.375
15. Stride E, Saffari N. Theoretical and experimental investigation of the behaviour of ultrasound contrast agent particles in whole blood. Ultrasound Med Biol (2004) 30:1495–509. doi:10.1016/j.ultrasmedbio.2004.09.003
16. Dukhin AS, Goetz PJ, van de Ven TGM. Ultrasonic characterization of proteins and blood cells. Colloids Surf B Biointerfaces (2006) 53:121–6. doi:10.1016/j.colsurfb.2006.08.011
17. Secomski W, Nowicki A, Tortoli P, Olszewski R. Multigate Doppler measurements of ultrasonic attenuation and blood hematocrit in human arteries. Ultrasound Med Biol (2009) 35:230–6. doi:10.1016/j.ultrasmedbio.2008.08.009
18. Treeby BE, Zhang EZ, Thomas AS, Cox BT. Measurement of the ultrasound attenuation and dispersion in whole human blood and its components from 0-70 MHz. Ultrasound Med Biol (2011) 37:289–300. doi:10.1016/j.ultrasmedbio.2010.10.020
19. Saitoh N, Hasegawa H, Kanai H. Estimation of scatterer diameter using ultrasonic backscattering property for assessment of red blood cell aggregation. Jpn J Appl Phys (2009) 48:07GJ08. doi:10.1143/JJAP.48.07GJ08
20. Fukushima T, Hasegawa H, Kanai H. Estimation of scatterer diameter by normalized power spectrum of high-frequency ultrasonic RF echo for assessment of red blood cell aggregation. Jpn J Appl Phys (2011) 50:07HF02. doi:10.1143/JJAP.50.07HF02
21. Kurokawa Y, Taki H, Yashiro S, Nagasawa K, Ishigaki Y, Kanai H. Estimation of size of red blood cell aggregates using backscattering property of high frequency ultrasound: In vivo evaluation. Jpn J Appl Phys (2016) 55:07KF12. doi:10.7567/JJAP.55.07KF12
22. Arakawa M, Nagasawa K, Fukase A, Higashiyama K, Mori S, Yashiro S, et al. Basic study for size estimation of red blood cell aggregates by analyzing ultrasonic backscattering properties considering ultrasonic propagation attenuation. Proc IEEE Ultrason Symp (2020) 1–4. doi:10.1109/IUS46767.2020.9251333
23. Nagasawa K, Fukase A, Mori S, Arakawa M, Yashiro S, Ishigaki Y, et al. Evaluation method of the degree of red blood cell aggregation considering ultrasonic propagation attenuation by analyzing ultrasonic backscattering properties. J Med Ultrason (2021) 48:3–12. doi:10.1007/s10396-020-01065-z
24. Higashiyama K, Mori S, Arakawa M, Yashiro S, Ishigaki Y, Kanai H. Estimation of aggregate size of red blood cell by introducing reference power spectrum measured for hemispherical ultrafine wire. Jpn J Appl Phys (2022) 61:SG1046. doi:10.35848/1347-4065/ac4683
26. Kuc R, Schwartz M. Estimating the acoustic attenuation coefficient slope for liver from reflected ultrasound signals. IEEE Trans Son Ultrason (1979) 26:353–61. doi:10.1109/T-SU.1979.31116
27. Labyed Y, Bigelow TA. A theoretical comparison of attenuation measurement techniques from backscattered ultrasound echoes. J Acoust Soc Am (2011) 129:2316–24. doi:10.1121/1.3559677
28. Hashimoto Y, Akashi N, Kushibiki J. Measurements of ultrasonic attenuation coefficients of water in VHF/UHF range (In Japanese). Tech Rep IEICE (1997) 97:37–42.
29. Fukase A, Higashiyama K, Mori S, Arakawa M, Yashiro S, Ishigaki Y, et al. Stabilization of red blood cell aggregation evaluation using short-axis view of vein of ultrasound. Jpn J Appl Phys (2021) 60:SDDE08. doi:10.35848/1347-4065/abf3d5
Keywords: attenuation coefficient, blood, in vivo, red blood cell, avascularization
Citation: Arakawa M, Higashiyama K, Mori S, Yashiro S, Ishigaki Y and Kanai H (2023) In vivo measurement of attenuation coefficient of blood in a dorsal hand vein in a frequency range of 10–45 MHz: A preliminary study. Front. Phys. 11:1077696. doi: 10.3389/fphy.2023.1077696
Received: 23 October 2022; Accepted: 25 January 2023;
Published: 07 February 2023.
Edited by:
Tadashi Yamaguchi, Chiba University, JapanReviewed by:
Masaaki Omura, University of Toyama, JapanCopyright © 2023 Arakawa, Higashiyama, Mori, Yashiro, Ishigaki and Kanai. This is an open-access article distributed under the terms of the Creative Commons Attribution License (CC BY). The use, distribution or reproduction in other forums is permitted, provided the original author(s) and the copyright owner(s) are credited and that the original publication in this journal is cited, in accordance with accepted academic practice. No use, distribution or reproduction is permitted which does not comply with these terms.
*Correspondence: Mototaka Arakawa, YXJha2F3YUB0b2hva3UuYWMuanA=
Disclaimer: All claims expressed in this article are solely those of the authors and do not necessarily represent those of their affiliated organizations, or those of the publisher, the editors and the reviewers. Any product that may be evaluated in this article or claim that may be made by its manufacturer is not guaranteed or endorsed by the publisher.
Research integrity at Frontiers
Learn more about the work of our research integrity team to safeguard the quality of each article we publish.