- 1Aerospace Information Research Institute, Chinese Academy of Sciences, Beijing, China
- 2School of Optics and Photonics, Beijing Institute of Technology, Beijing, China
- 3Key Laboratory of Information Photonics Technology, Ministry of Industry and Information Technology of the People’s Republic of China, Beijing, China
- 4Key Laboratory of Photoelectronic Imaging Technology and System, Ministry of Education of the People’s Republic of China, Beijing, China
- 5School of Electronics and Information, Northwestern Polytechnical University, Xi’an, China
Although free-space optical communication (FSOC) is a promising means of high data rate satellite-to-ground communication, beam distortion caused by atmospheric optical turbulence remains a major challenge for its engineering applications. Accurate prediction of atmospheric optical turbulence to optimize communication plans and equipment parameters, such as adaptive optics (AO), is an effective means to address this problem. In this research, a hybrid multi-step prediction model for atmospheric optical turbulence, EMD-Seq2Seq-LSTM, is proposed by combining empirical mode decomposition (EMD), sequence-to-sequence (Seq2Seq), and long short-term memory (LSTM) network. First, using empirical mode decomposition to decompose the non-linear and non-stationary atmospheric optical turbulence dataset into a set of stationary components for which internal feature information can be easily extracted significantly reduces the training difficulty and improves the forecast accuracy of the model. Second, sequence-to-sequence is combined with LSTM networks to build a prediction model that can eliminate time delay and make full use of long-term information and then use the model to predict each component separately. Finally, the prediction results of each component are combined to obtain the final atmospheric turbulence forecasting results. To validate the performance of the proposed method, three comparative models, including WRF, LSTM, and sequence-to-sequence-LSTM, are demonstrated in this study. The forecasting results reveal that the proposed model outperforms all other models both qualitatively and quantitatively and thus can be a powerful method for atmospheric optical turbulence forecasting.
1 Introduction
The free-space optical communication (FSOC) has attracted increasing attention because of the ever-growing demand for high-data-rate data transmission [1, 2]. Compared to traditional microwave communication, FSOC offers high communication rate, small size, low power consumption, and strong confidentiality, which can largely satisfy current applications, especially satellite-to-ground communications [3–6].
However, optical propagation is significantly impacted by atmospheric optical turbulence. Optics passing through non-negligible distances in the Earth’s atmosphere are affected by atmospheric optical turbulence, which results in beam diffusion at high spatial frequencies, beam wanderings at low spatial frequencies, and intensity variations (scintillation) [7–11].
The integrated strength of atmospheric optical turbulence along the line of sight is usually defined as Fried parameter (
At present, research on atmospheric optical turbulence forecasting has become increasingly extensive and in-depth. The forecasting methods can be divided into two categories: physical methods and machine learning methods.
The physical model is based on the Monin–Obukhov similarity (MOS) theory to establish the relationship between meteorological parameters and atmospheric optical turbulence and then uses meteorological forecast parameters to forecast atmospheric optical turbulence. In addition, meteorological forecast parameters can be produced by a numerical weather prediction (NWP) model.
Numerous studies have been conducted based on the physical model over different application areas and environment: an atmospheric non-hydrostatic model Meso-Nh conceived to provide 3D maps of the classic meteorological parameters and reconstructed atmospheric optical turbulence profiles [16–20]; an improved outer-scale model based on measurement had been used to calculate atmospheric optical turbulence in Lhasa and achieved high agreement between the model and the actual measurement results [21]; atmospheric optical turbulence near the surface of the ocean was calculated using the bulk model and meteorological parameters predicted by the WRF model [22]; the diurnal behavior of atmospheric optical turbulence was simulated during summer over the entire Antarctic Plateau using the Polar WRF model coupled with the MOS theory [22, 23]. To solve the problem of limited prediction accuracy of physical models in complex terrain areas, a method referred as site learning has been proposed that uses local measurements to improve predictive turbulence models and better consider site-specific local characteristics [24, 25].
Despite the widespread application of physical models over the past decades and the impressive achievements gained, physical models often failed to provide reliable atmospheric optical turbulence predictions, in part because they are constrained by the forecast accuracy of meteorological data and in part because the relationship between meteorological data, such as the vertical distribution of atmospheric temperature, water vapor, and wind fields, and the atmospheric optical turbulence varies over spatial and temporal scales.
With the development of artificial intelligence techniques, machine learning models have become important in the forecasting of atmospheric optical turbulence. Complex and deep network design brings about powerful non-linear and complex mapping capabilities which give machine learning methods better performance. Machine learning methods can be further divided into two types: regression models, which rely on a large number of historical data for constructing input (meteorological parameters)/output (atmospheric optical turbulence) mapping functions, and autoregressive models, which are time-series models that are trained to obtain the variables’ change patterns over time.
A regression model is trained on time-correlated weather and atmospheric optical turbulence measurements and then applied to weather forecasts from NWP data sources to yield an atmospheric optical turbulence forecast. Cherubini et al. [26] presented a classification (logistic regression) algorithm and regressor algorithm to translate the MKWC experience into a forecast of the nightly average atmospheric optical turbulence. Bolbasova et al. [27] proposed the application of a neural network, one of the earliest deep-learning techniques, to predict the surface-layer refractive-index structure constant. In [28], a backpropagation neural network optimized using a genetic algorithm (GA–BP) is used to estimate atmospheric turbulence profiles in marine environments. Although machine learning methods can accurately construct non-linear and highly complex mapping relationships between meteorological parameters and atmospheric optical turbulence, their prediction accuracy is still limited by the accuracy of meteorological data forecasts.
Autoregressive models are more suited for short-term forecasts of atmospheric optical turbulence based on past observations. Typical autoregressive models include the autoregressive integrated moving average (ARIMA) approach and the filter method. The ARIMA model is trained on a huge quantity of historical data to simulate the temporal dependency of atmospheric optical turbulence, and then the historical data are used to predict short-term atmospheric optical turbulence [29]. The filter method takes into account, simultaneously, the forecast obtained with non-hydrostatical mesoscale atmospheric models and the real-time measurements to help in removing potential biases and trends which have an impact on short-term atmospheric optical turbulence forecasting [30, 31]. Autoregressive models are revealed to be extremely efficient in improving the forecast accuracy on short time scales and usually have a simple model structure, quick calculation speed, and good interpretation capability. However, autoregressive methods suffer from lagging effects, and the accuracy of the prediction decreases as time increases. In addition, the autoregressive method is poor at capturing non-linear behaviors in the time series, so it cannot adapt to changing atmospheric turbulence and cannot accurately predict sudden changes.
In this paper, a complex deep learning network, LSTM-based Sequence-to-Sequence (Seq2Seq), combined with data preprocess techniques such as empirical mode decomposition (EMD) was proposed as a solution to the forecasting problem of atmospheric optical turbulence. We used EMD to decompose the observed atmospheric optical turbulence datasets into several subsequences, and then Seq2Seq with an attention model which had a hybrid LSTM structure was built for each subsequence to forecast atmospheric optical turbulence.
2 Materials and methods
2.1 Empirical mode decomposition
Atmospheric optical turbulence is non-linear and non-stationary, and decomposition is a prominent technique for dealing with such datasets. Traditional decomposition techniques, such as the Fourier transform, lose much information when decomposing non-linear and non-stationary datasets, resulting in distortion of the analysis results [32]. Huang et al. [33] proposed a strong adaptive and fully data-driven time-series decomposition technique, EMD, whose main idea is to use Hilbert–Huang transform (HHT) to decompose the non-linear and non-stationary datasets until the final datasets are stationary.
EMD decomposed the datasets into a certain number of intrinsic mode functions (IMFs), which reduces the complexity of original datasets and makes each component interpreted clearly. Two conditions need to be satisfied for each IMF: 1) the number of extreme values (the sum of the maximum and minimum values) and the number of zero-crossings across the data series must be equal or deviate by no more than 1; 2) at any position, the average of the local maximum envelope and the local minimum envelope equals 0.
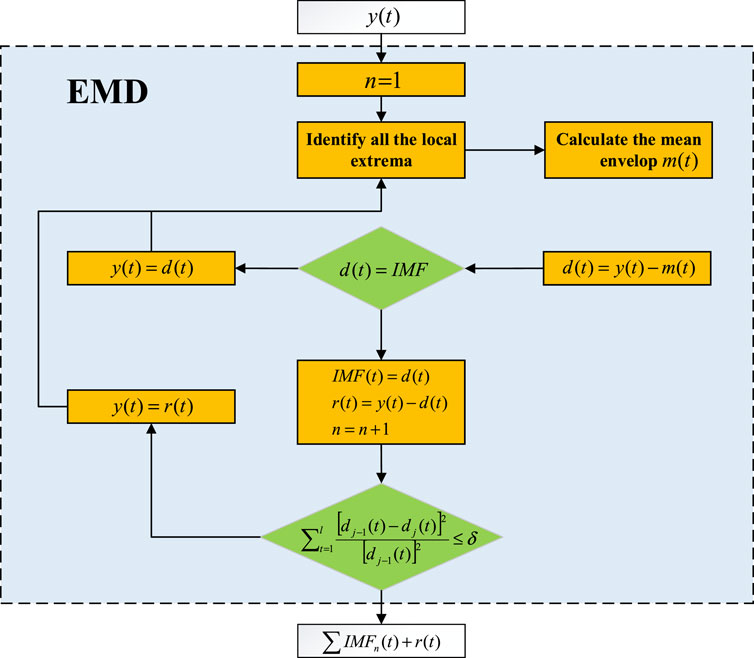
Based on the aforementioned constraints on IMFs, we can then decompose the dataset according to the process shown in Figure 1, and the decomposed datasets are shown in Eq. 1 as
where
2.2 LSTM-based sequence-to-sequence
Long short-term memory (LSTM) is a special type of recurrent neural network (RNN) that can solve the problem of gradient disappearance or gradient explosion and thus has the ability to learn long-term information [34–37]. The basic structure of the LSTM cell contains three parts: forget gate, input gate, and output gate. Each LSTM cell updates six parameters per iteration, and the detailed algorithms are shown as follows:
where
LSTM can address the challenge of long-term dependence, but there is a lag effect in the prediction results, especially when making multi-step predictions, and in addition the accuracy of LSTM model predictions decreases over time. Cho et al. [38] proposed a conditional autoregressive model called encoder–decoder or sequence-to-sequence that can effectively solve these problems.
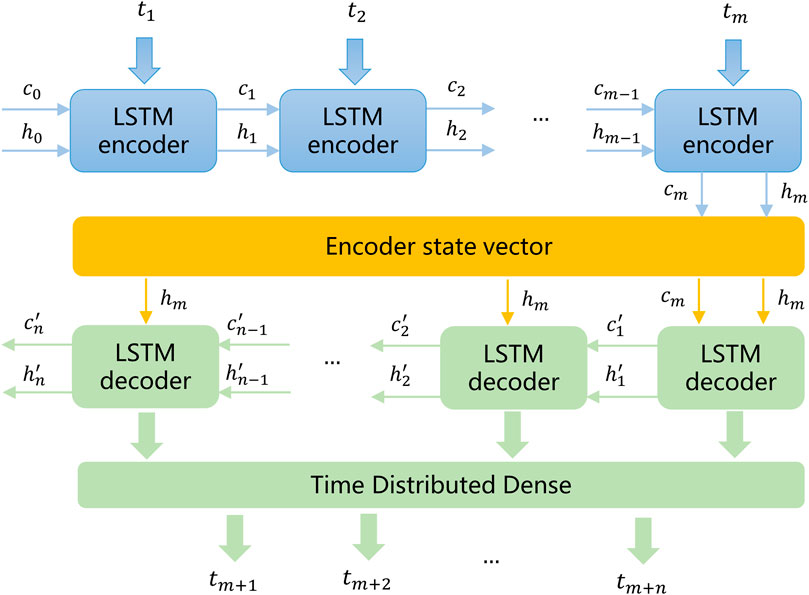
The LSTM-based sequence-to-sequence (Seq2Seq-LSTM) model learns multi-step time-series simultaneously and is able to process a sequence from one domain to another, thus outlining sequences from different time series with different cluster lengths to each other [39–43]. Figure 2 shows a Seq2Seq-LSTM model structure where an input sequence with m steps can be encoded, and the encoded output is stored in a cell called a state vector, which is then used as an input to a decoder LSTM and time-distributed dense layer, resulting in a final output of n-step predictions.
2.3 The proposed method EMD-Seq2Seq-LSTM
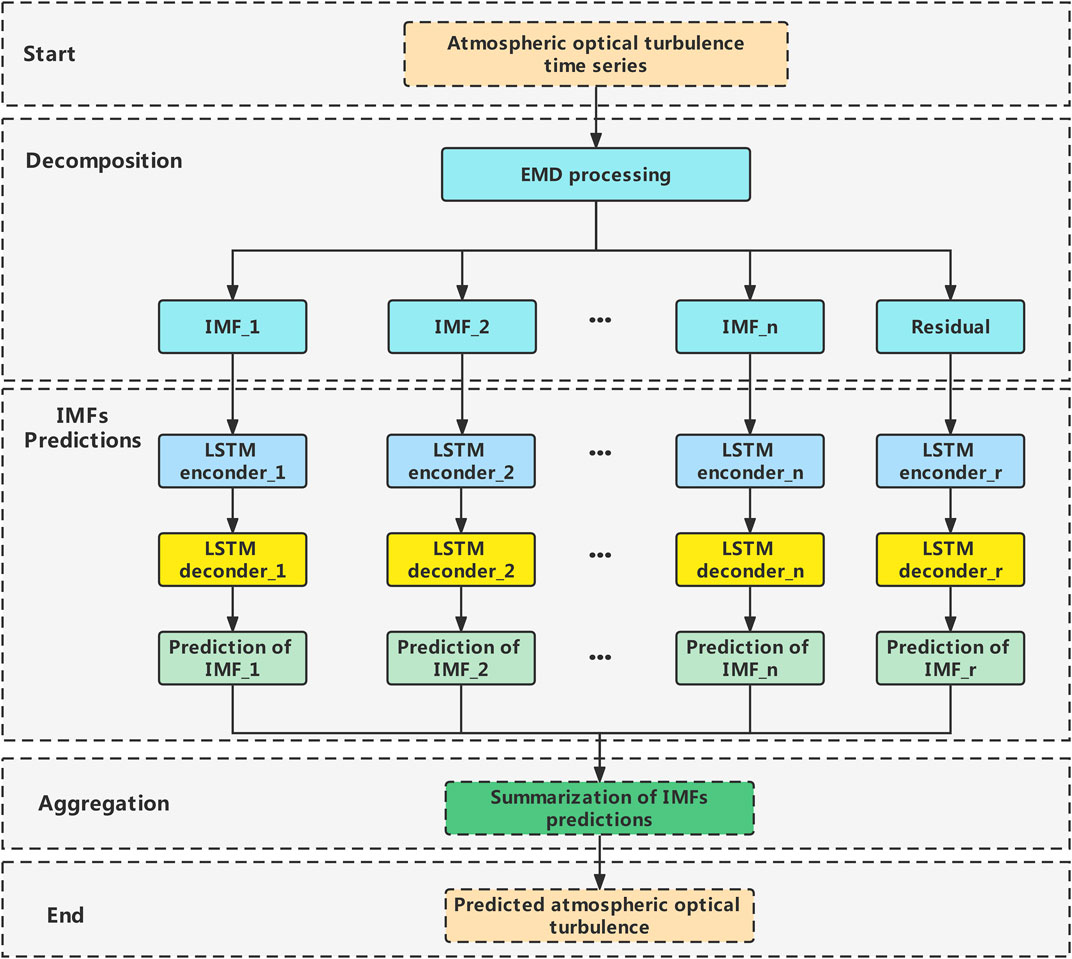
After discussing each key constituent separately, the detailed description of the proposed model EMD-Seq2Seq-LSTM can be concluded as follows and is shown in Figure 3.
Step 1: Collect the original atmospheric optical turbulence dataset
Step 2: Decompose the obtained atmospheric optical turbulence dataset into several groups of stationary IMFs and residuals based on the EMD algorithm. In general, no more than five IMFs are decomposed by EMD since too many components may be over-decomposed, reducing the accuracy and adding unnecessary computing complexity.
Step 3: Plot the partial autocorrelation coefficient figure (PACF) of each component and select the best predict target for the Seq2Seq-LSTM model.
Predicted targets for the LSTM model.
Step 4: Predict each component using the Seq2Seq-LSTM model.
Step 4.1: Each component was normalized to the same scale ranging from −1 to 1.
Step 4.2: Each component was split into three parts; the first 80% is used for the training and validation sets and the last 20% for the test set.
Step 4.3: As each component has different data features such as time-correlation, hyperparameter adjustments are made individually for each component. The most important hyperparameter is the length of the input sequence, followed by learning rate and dropout probability.
Step 4.4: Prediction of each component using the best hyperparameter obtained in the previous step.
Step 5: Reconstruct the predictions given in step 4.
Step 6: Output the final forecasting results and perform error analysis.
3 Case study
3.1 Study area and data description
Available data for the case study are the historical dataset of atmospheric optical turbulence from China Remote Sensing Satellite Ground Station (RSGS, 40°27′N, 116°51′ 213 E) in Beijing, China. The dataset is a 10-min collection of atmospheric optical turbulence intensity data from the differential image motion monitor (DIMM) deployed at the RSGS.
The dataset must be preprocessed to eliminate the noise before it is utilized as input for model training and testing since the data measured by DIMM include substantial high-frequency noise [44–46]. The dataset is separated into three subsets: the training set (60%) for training, the development set (20%) for searching optimal structures, and the test set (20%) for validating the hybrid model EMD-Seq2Seq-LSTM.
3.2 Performance evaluation benchmarks
To evaluate the performance of the proposed EMD-Seq2Seq-LSTM model, the following three models are used as benchmark models: WRF model, LSTM model, and Seq2Seq-LSTM model. The WRF model is based on a physical model that calculates atmospheric optical turbulence from vertical multi-layer meteorological data. The LSTM model is the most traditional autoregressive atmospheric optical turbulence forecasting model. The Seq2Seq-LSTM model is an autoregressive atmospheric optical turbulence forecasting model based on sequence-to-sequence technology.
3.3 Performance metrics
The performance of the proposed model is evaluated with a mean absolute error (MAE), mean absolute percentage error (MAPE), root mean square error (RMSE), and coefficient of determination (
where
Among these metrics, MAE, MAPE, and RMSE are fairly standard evaluation metrics in time-series forecasting, they are used to assess the accuracy of the forecasting result, and
3.4 Model optimization
In order to achieve higher prediction accuracy and more rigorous comparative analysis results, the proposed EMD-Seq2Seq-LSTM method and the hyperparameters of the baseline models (LSTM model and Seq2Seq-LSTM model) need to be tuned. In this study, a grid search is used to explore each possible combination of a predefined list of hyperparameter values, and the optimal combination is determined by the cross-validation score.
Although the grid search allows for optimal combinations of hyperparameters, it is very computationally intensive. Therefore, the most sensitive hyperparameters are manually adjusted to predefine the search range before the grid search to reduce the computational overhead.
The most important hyperparameters—length of input sequence, learning rate, batch size and epoch number, dropout rate, and hidden layer size—were manually fine-tuned and evaluated with five datasets to determine the optimal hyperparameter search range. As shown in Figure 5, the MAPE values for the proposed model with different hyperparameters were presented as boxplots.
It was discovered that the most important hyperparameter is the length of the input sequence, followed by the learning rate, batch size and epochs, optimization, and hidden layer size. As shown in Figure 4, the MAPE values for the proposed model with different hyperparameters were presented as boxplots, and the search range for each hyperparameter can be determined based on the results in the boxplots.
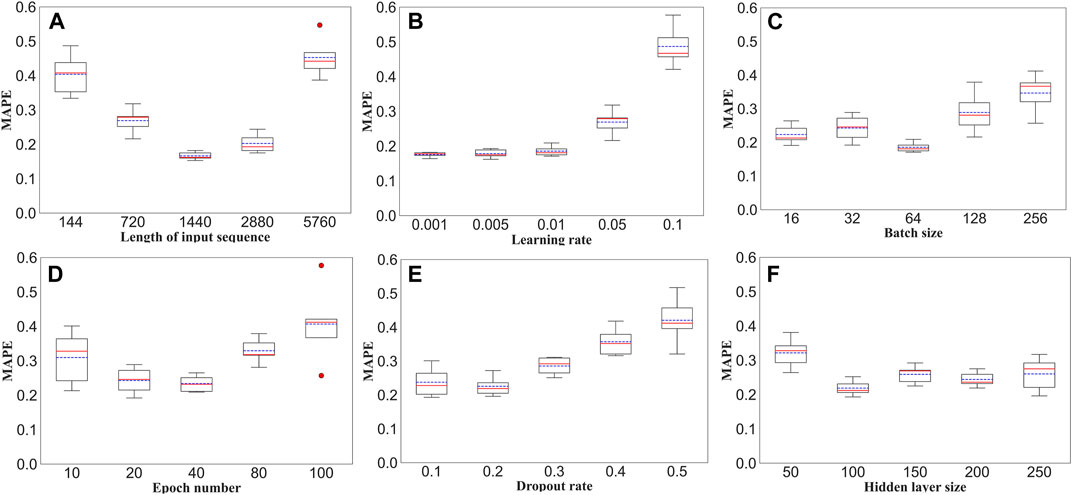
FIGURE 4. Boxplots of different hyperparameters. MAPE with different (A) length of input sequence, (B) learning rate, (C) batch size, (D) epoch number, (E) dropout rate, and (F) hidden layer size.
Table 1 shows the optimal hyperparameter values of the proposed model, together with their corresponding search range.
4 Results and analysis
The atmospheric optical turbulence forecast framework was completed in Python 3.7.13. The experimental computer system is Ubuntu 64 bits, and the GPU is NVIDIA GeForce RTX 3090, 64 GB of memory, TensorFlow-GPU version is 2.9.1, and Keras version is 2.9.0. Multiple GPUs are used for model training, so the training takes only about 285 s and prediction takes only 32 s.
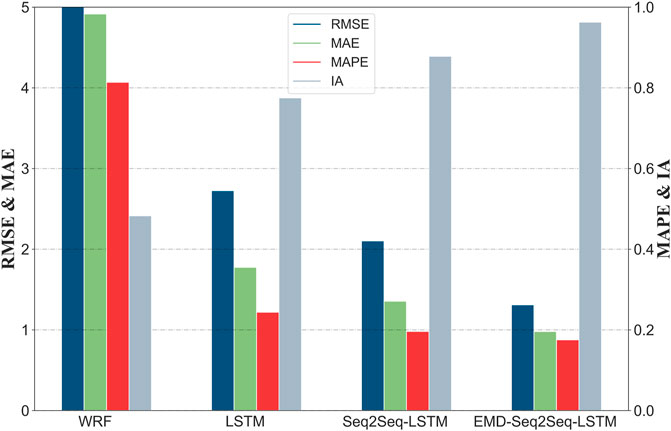
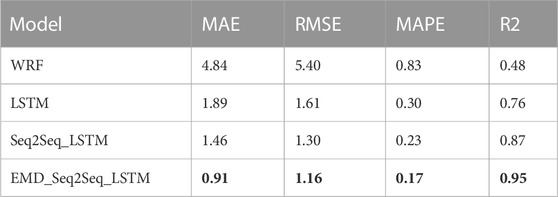
The results of the multistep ahead atmospheric optical turbulence forecasting for the proposed and compared methods are illustrated in Figures 5–8. Figure 5 shows the line plots of the observed and predicted data. Figure 6 displays the histogram of the true and predicted values for different models. Figure 7 presents the prediction errors for various models. Figure 8 shows a comparison of the performance metrics of different prediction models. The detailed comparison results are shown in Table 1, with the best values in terms of MAE, RMSE, MAPE, and

FIGURE 5. Forecasting results of the proposed method and the contrast method. Observed atmospheric optical turbulence (blue) and forecasting results of WRF (green), LSTM (yellow), Seq2Seq-LSTM (gray), and proposed method EMD-Seq2Seq-LSTM (red).
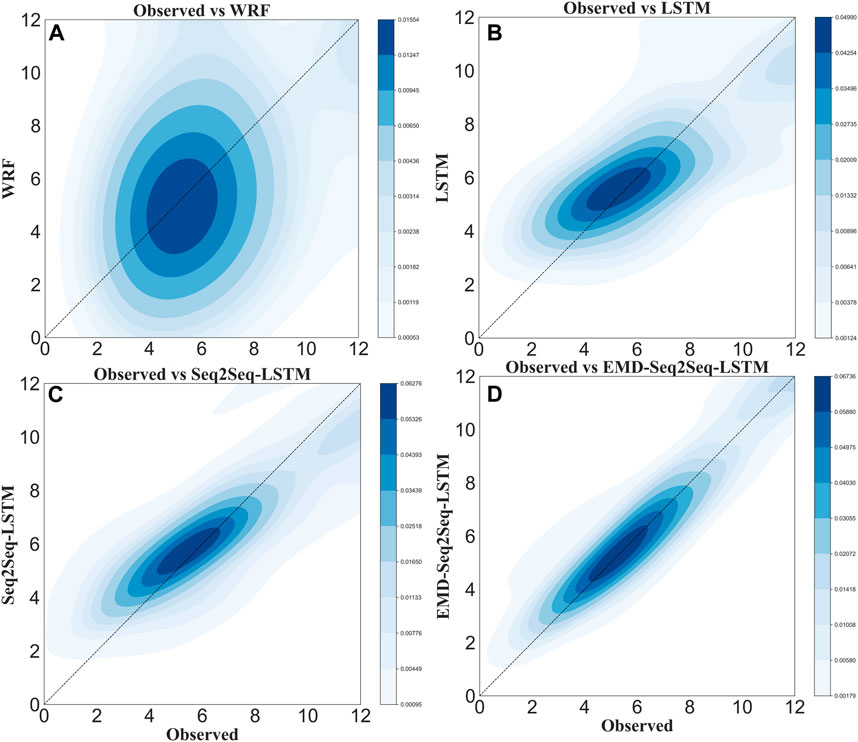
FIGURE 6. 2D histograms of observed atmospheric optical turbulence versus forecasting results of the proposed method and the contrast method; WRF (A), LSTM (B), Seq2Seq-LSTM (C), and EMD-Seq2Seq-LSTM (D).
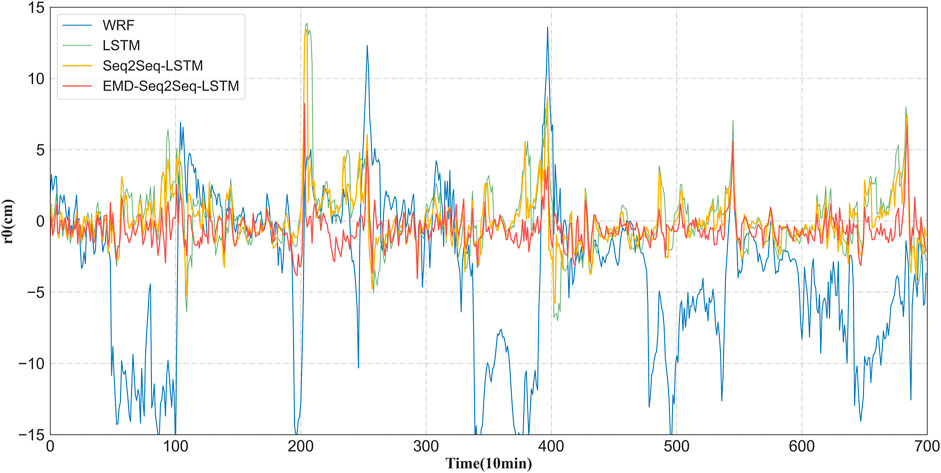
FIGURE 7. Prediction error of the proposed method and the contrast methods; WRF (blue), LSTM (green), Seq2Seq-LSTM (yellow), and proposed method EMD-Seq2Seq-LSTM (red).
For the line plot in Figure 5, it can be found that the proposed model fits the best, followed by LSTM and Seq2Seq-LSTM, and WRF has the worst fit. In addition, compared with observational data, the prediction of LSTM has a large lag, and the prediction effect of Seq2Seq-LSTM is poor when the intensity of atmospheric optical turbulence changes drastically.
For the 2D histogram in Figure 6, it is obvious that the proposed method distribution is the most uniform and closest to the regression line, Seq2Seq-LSTM, LSTM, and WRF, with increasing absolute bias and dispersions.
For the line plot of prediction errors in Figure 7, the prediction errors of the proposed method are much smaller and very smooth with no large deviations, while the prediction errors of the comparison models, especially the WRF model, vary dramatically, with a wide range of fluctuations and significantly lower prediction accuracy than that of the proposed model.
For the quantitative analysis of the forecasting results shown in Figure 8; Table 2, the evaluation criteria MAE, RMSE, MAPE, and
For a more thorough analysis of the experimental results, a detailed comparison can be summarized as follows.
1) Machine learning approaches (LSTM, Seq2Seq-LSTM, and EMD-Seq2Seq-LSTM) show much higher prediction accuracy than physical models (WRF). The MAE, RMSE, MAPE, and
2) Compared with the LSTM model, the lag effect and prediction accuracy of the Seq2Seq-LSTM model were substantially improved, with MAE, RMSE, MAPE, and
3) The EMD-Seq2Seq-LSTM model further improves the time delay problem, and, in addition, the proposed model provides a significant prediction promotion compared to non-decomposition-based LSTM model and Seq2Seq-LSTM model, especially when the fluctuations in atmospheric optical turbulence are large. MAE, RMSE, MAPE, and
5 Conclusion
Atmospheric optical turbulence has a considerable effect on beam transmission. Thus, accurate forecasting of atmospheric optical turbulence is essential for optimizing the satellite-to-ground communication schedule and determining the appropriate operating parameters for adaptive optics. In this paper, a novel multistep atmospheric optical turbulence forecasting model is proposed by combining the EMD, Seq2Seq, and LSTM network. Here, the EMD method is used as a powerful data preprocessing technique to decompose the non-linear and non-stationary atmospheric optical turbulence dataset into a set of stationary components that makes the extraction of internal feature information easier. Seq2Seq is used in conjunction with the LSTM network to build a predictive model for each component with greater lagging problem handling capability and easier access to long-term historical information. The individual forecasts for each subseries are aggregated to form a final forecast.
To investigate the performance of the proposed model, testing experiments are carried out on three different contrast models, namely, WRF, LSTM, and Seq2Seq-LSTM. The qualitative and quantitative results demonstrated that the proposed EMD-Seq2Seq-LSTM model is apparently superior in comparison to other models in all evaluation criteria. The main novelty of the proposed model includes the following: 1) EMD was used to decompose the trend, period, and variation terms according to the characteristics of atmospheric optical turbulence, making it simple to train the model separately for data characteristics of different terms, thereby significantly reducing the training difficulty of the model and enhancing the model’s forecast accuracy; 2) a new deep learning network, Seq2Seq combined with LSTM, is applied to atmospheric optical turbulence forecasting to eliminate time delays and fully utilized the depth information of atmospheric optical turbulence; and 3) the model proposed in this paper has a relatively low computational complexity and is a useful tool for forecasting highly non-stationary and non-linear atmospheric optical turbulence in practical forecasting applications.
Data availability statement
The raw data supporting the conclusion of this article will be made available by the authors, without undue reservation.
Author contributions
All authors listed have made a substantial, direct, and intellectual contribution to the work and approved it for publication.
Conflict of interest
The authors declare that the research was conducted in the absence of any commercial or financial relationships that could be construed as a potential conflict of interest.
Publisher’s note
All claims expressed in this article are solely those of the authors and do not necessarily represent those of their affiliated organizations, or those of the publisher, the editors, and the reviewers. Any product that may be evaluated in this article, or claim that may be made by its manufacturer, is not guaranteed or endorsed by the publisher.
References
1. Sadiku MNO, Musa SM, Nelatury SR. Free space optical communications: An overview. Eur Sci J ESJ (2016) 12:55. doi:10.19044/esj.2016.v12n9p55
2. Smutny B, Kaempfner H, Muehlnikel G, Sterr U, Wandernoth B, Heine F, et al. 5.6 Gbps optical intersatellite communication link. Editor. H Hemmati (San Jose, CA), 719906. doi:10.1117/12.812209
3. Zhu Z, Janasik M, Fyffe A, Hay D, Zhou Y, Kantor B, et al. Compensation-free high-dimensional free-space optical communication using turbulence-resilient vector beams. Nat Commun (2021) 12:1666. doi:10.1038/s41467-021-21793-1
4. Jahid A, Alsharif MH, Hall TJ. A contemporary survey on free space optical communication: Potentials, technical challenges, recent advances and research direction. J Netw Comput Appl (2022) 200:103311. doi:10.1016/j.jnca.2021.103311
5. Kang HJ, Yang J, Chun BJ, Jang H, Kim BS, Kim Y-J, et al. Free-space transfer of comb-rooted optical frequencies over an 18 km open-air link. Nat Commun (2019) 10:4438. doi:10.1038/s41467-019-12443-8
6. Wang J, Yang J-Y, Fazal IM, Ahmed N, Yan Y, Huang H, et al. Terabit free-space data transmission employing orbital angular momentum multiplexing. Nat Photon (2012) 6:488–96. doi:10.1038/nphoton.2012.138
7. Strasburg J, Harper W. Impact of atmospheric turbulence on beam propagation. Proc SPIE - Int Soc Opt Eng (2004). doi:10.1117/12.541666
8. Tyson RK. Chapter 2 - sources of aberrations. In: RK Tyson, editor. Principles of adaptive optics. Academic Press. p. 25–52. doi:10.1016/B978-0-12-705900-6.50006-9
9. Kwiecień J. The effects of atmospheric turbulence on laser beam propagation in a closed space—an analytic and experimental approach. Opt Commun (2019) 433:200–8. doi:10.1016/j.optcom.2018.09.022
10. Clifford SF. The classical theory of wave propagation in a turbulent medium. In: JW Strohbehn, editor. Laser beam propagation in the atmosphere. Berlin, Heidelberg: Springer Berlin Heidelberg. p. 9–43. doi:10.1007/3540088121_16
11. Ricklin JC, Hammel SM, Eaton FD, Lachinova SL. Atmospheric channel effects on free-space laser communication. J Opt Fiber Commun Rep (2006) 3:111–58. doi:10.1007/s10297-005-0056-y
12. Sergeyev A, Roggemann M. Monitoring the statistics of turbulence: Fried parameter estimation from the wavefront sensor measurements. Appl Opt (2011) 50:3519–28. doi:10.1364/AO.50.003519
13. Zhan H, Wijerathna E, Voelz D. Wave optics simulation studies of the fried parameter for weak to strong atmospheric turbulent fluctuations (2019). doi:10.1364/PCAOP.2019.PM1C.3
14. Wang Y, Xu H, Li D, Wang R, Jin C, Yin X, et al. Performance analysis of an adaptive optics system for free-space optics communication through atmospheric turbulence. Sci Rep (2018) 8:1124. doi:10.1038/s41598-018-19559-9
15. Yang L, Yao K, Wang J, Cao J, Lin X, Liu X, et al. Performance analysis of 349-element adaptive optics unit for a coherent free space optical communication system. Sci Rep (2019) 9:13150. doi:10.1038/s41598-019-48338-3
16. Masciadri E, Vernin J, Bougeault P. 3D mapping of optical turbulence using an atmospheric numerical model: I. A useful tool for the ground-based astronomy. Astron Astrophys Suppl Ser (1999) 137:185–202. doi:10.1051/aas:1999474
17. Masciadri E, Vernin J, Bougeault P. 3D numerical simulations of optical turbulence at the Roque de Los Muchachos Observatory using the atmospherical model Meso-Nh. Httpdxdoiorg1010510004- (2001) 636120000050:699–708. doi:10.1051/0004-6361:20000050
18. Masciadri E, Lascaux F, Fini L. Mose: Operational forecast of the optical turbulence and atmospheric parameters at European southern observatory ground-based sites - I. Overview and vertical stratification of atmospheric parameters at 0-20 km. Mon Not R Astron Soc (2013) 436:1968. doi:10.1093/mnras/stt1708
19. Masciadri E, Jabouille P. Improvements in the optical turbulence parameterization for 3D simulations in a region around a telescope (2001). p. 376. Httpdxdoiorg1010510004-636120010999. doi:10.1051/0004-6361:20010999
20. Bendersky S, Lilos E, Kopeika N, Blaunstein N. Modeling and measurements of near-ground atmospheric optical turbulence according to weather for Middle East environments. Proc SPIE - Int Soc Opt Eng (2004) 5612. doi:10.1117/12.578192
21. Han Y, Wu X, Luo T, Qing C, Yang Q, Jin X, et al. New $\text{C}_{n}^{2}$ statistical model based on first radiosonde turbulence observation over Lhasa. J Opt Soc Am A (2020) 37:995. doi:10.1364/JOSAA.387211
22. Qing C, Wu X, Li X, Zhu W, Qiao C, Rao R, et al. Use of weather research and forecasting model outputs to obtain near-surface refractive index structure constant over the ocean. Opt Express (2016) 24:13303. doi:10.1364/OE.24.013303
23. Yang Q, Wu X, Han Y, Qing C. Estimation of behavior of optical turbulence during summer in the surface layer above the Antarctic Plateau using the Polar WRF model. Appl Opt (2021) 60:4084. doi:10.1364/AO.419473
24. Giordano C, Rafalimanana A, Ziad A, Aristidi E, Chabé J, Fanteï-Caujole Y, et al. Contribution of statistical site learning to improve optical turbulence forecasting. Mon Not R Astron Soc (2021) 504:1927–38. doi:10.1093/mnras/staa3709
25. Giordano C, Vernin J, Vázquez Ramió H, Muñoz-Tuñón C, Varela AM, Trinquet H. Atmospheric and seeing forecast: WRF model validation with in situ measurements at ORM★. Mon Not R Astron Soc (2013) 430:3102–11. doi:10.1093/mnras/stt117
26. Cherubini T, Lyman R, Businger S. Forecasting seeing for the Maunakea observatories with machine learning. Mon Not R Astron Soc (2021) 509:232–45. doi:10.1093/mnras/stab2916
27. Bolbasova LA, Andrakhanov AA, Shikhovtsev AY. The application of machine learning to predictions of optical turbulence in the surface layer at Baikal Astrophysical Observatory. Mon Not R Astron Soc (2021) 504:6008–17. doi:10.1093/mnras/stab953
28. Bi C, Qing C, Wu P, Jin X, Liu Q, Qian X, et al. Optical turbulence profile in marine environment with artificial neural network model. Remote Sens (2022) 14:2267. doi:10.3390/rs14092267
29. Li Y, Li L, Guo Y, Zhang H, Fu S, Gao C, et al. Atmospheric turbulence forecasting using two-stage variational mode decomposition and autoregression towards free-space optical data-transmission link. Front Phys (2022) 10:10. doi:10.3389/fphy.2022.970025
30. Turchi A, Masciadri E, Martelloni G. Evaluation of filtering techniques to increase the reliability of meteo forecasts for ground-based telescopes (2018). doi:10.1117/12.2312480
31. Masciadri E, Martelloni G, Turchi A. Filtering techniques to enhance optical turbulence forecast performances at short time-scales. Mon Not R Astron Soc (2020) 492:140–52. doi:10.1093/mnras/stz3342
32. Wu Z, Huang N. Ensemble empirical mode decomposition: A noise-assisted data analysis method. Adv Adapt Data Anal (2009) 1:1–41. doi:10.1142/S1793536909000047
33. Huang N, Shen Z, Long S, Wu MLC, Shih H, Zheng Q, et al. The empirical mode decomposition and the Hilbert spectrum for nonlinear and non-stationary time series analysis. Proc R Soc Lond Ser Math Phys Eng Sci (1998) 454:903–95. doi:10.1098/rspa.1998.0193
34. Bengio Y, Simard P, Frasconi P. Learning long-term dependencies with gradient descent is difficult. IEEE Trans Neural Netw Publ IEEE Neural Netw Counc (1994) 5:157–66. doi:10.1109/72.279181
35. Mandic D, Chambers J. Recurrent neural networks for prediction: Learning Algorithms,Architectures and stability (2001). doi:10.1002/047084535X
36. He F, Zhou J, zhong-kai F, Guangbiao L, Yuqi Y. A hybrid short-term load forecasting model based on variational mode decomposition and long short-term memory networks considering relevant factors with Bayesian optimization algorithm. Appl Energ (2019) 237:103–16. doi:10.1016/j.apenergy.2019.01.055
37. Shi X, Chen Z, Wang H, Yeung D-Y, Wong W, Woo W. Convolutional LSTM network: A machine learning approach for precipitation nowcasting. Neural Inf Process Syst (2015).
38. Cho K, van Merriënboer B, Gulcehre C, Bahdanau D, Bougares F, Schwenk H, Bengio Y. Learning phrase representations using RNN encoder–decoder for statistical machine translation. In: Proceedings of the 2014 conference on empirical methods in natural language processing (EMNLP). Doha, Qatar: Association for Computational Linguistics. p. 1724–34. doi:10.3115/v1/D14-1179
39. Wang X, Cai Z, Luo Y, Wen Z, Ying S. Long time series deep forecasting with multiscale feature extraction and Seq2seq attention mechanism. Neural Process Lett (2022) 54:3443–66. doi:10.1007/s11063-022-10774-0
40. Gong G, An X, Mahato N, Sun S, Chen S, Wen Y. Research on short-term load prediction based on Seq2seq model. Energies (2019) 12:3199. doi:10.3390/en12163199
41. Masood Z, Gantassi R, Ardiansyah A, Choi Y. A multi-step time-series clustering-based Seq2Seq LSTM learning for a single household electricity load forecasting. Energies (2022) 15:2623. doi:10.3390/en15072623
42. Zhang Y, Li Y, Zhang G. Short-term wind power forecasting approach based on Seq2Seq model using NWP data. Energy (2020) 213:118371. doi:10.1016/j.energy.2020.118371
43. Xiang Z, Yan J, Demir I. A rainfall-runoff model with LSTM-based sequence-to-sequence learning. Water Resour Res (2020) 56:56. doi:10.1029/2019WR025326
44. Tokovinin A, Kornilov V. Accurate seeing measurements with MASS and DIMM. Mon Not R Astron Soc (2007) 381:1179–89. doi:10.1111/j.1365-2966.2007.12307.x
45. He Y, Sheng Z, Zhu Y, He M. Adaptive variational mode decomposition method for eliminating instrument noise in turbulence detection. J Atmos Ocean Technol (2020) 38:31–46. doi:10.1175/JTECH-D-20-0004.1
Keywords: atmospheric optical turbulence forecasting, free-space optical communication, empirical mode decomposition, LSTM, sequence-to-sequence learning
Citation: Li Y, Zhang H, Li L, Shi L, Huang Y and Fu S (2023) Multistep ahead atmospheric optical turbulence forecasting for free-space optical communication using empirical mode decomposition and LSTM-based sequence-to-sequence learning. Front. Phys. 11:1070762. doi: 10.3389/fphy.2023.1070762
Received: 15 October 2022; Accepted: 02 January 2023;
Published: 19 January 2023.
Edited by:
Muhsin Caner Gokce, TED University, TürkiyeReviewed by:
Qi Chang, National University of Defense Technology, ChinaJaydip Sen, Praxis Business School, India
Copyright © 2023 Li, Zhang, Li, Shi, Huang and Fu. This is an open-access article distributed under the terms of the Creative Commons Attribution License (CC BY). The use, distribution or reproduction in other forums is permitted, provided the original author(s) and the copyright owner(s) are credited and that the original publication in this journal is cited, in accordance with accepted academic practice. No use, distribution or reproduction is permitted which does not comply with these terms.
*Correspondence: Yalin Li, bGl5YWxpbkBhaXJjYXMuYWMuY24=; Lu Shi, c2hpbHVAYWlyY2FzLmFjLmNu
 Yalin Li
 Hongqun Zhang1
 Lu Shi
 Shiyao Fu