- 1Center for Precision Engineering, School of Mechatronics Engineering, Harbin Institute of Technology, Harbin, China
- 2Chongqing Research Institute of Harbin Institute of Technology, Chongqing, China
In high-power laser systems, fused silica aerosols produced by laser-induced damage to optical components impede further improvement in operation efficiency. To mitigate aerosol threats, low-speed gas knives are an attractive online option. Herein, we investigate the protective mechanism of a low-speed gas knife (<20 m/s) against aerosol invasion on the optical component. First, aerosol particles invaded the surface experimentally in two ways and were detected both in the core and non-core regions, depending on the coverage area of the protection flow. Particle sedimentation percentages can directly reflect the protection capability of the gas knife flow. Since a “midstream defect” is readily apparent, a CFD model was developed to explain the phenomenon from the perspective of velocity distribution. Additionally, the Euler-Lagrange method was used to track airflow particle motions and reappear the protective process. The numerical and experimental results on protection efficiency are closely correlated. The numerical calculation indicates that the “midstream defect” manifested in the core region is possibly attributed to the turbulent dispersion and anisotropic near-wall effects of particles of various diameters, while in the non-core region, the mechanism differs. This work provides a framework for airflow clean designs inside high-power laser systems.
1 Introduction
Inertial confinement fusion (ICF) ignited by a high-power laser system, such as the NIF [1], LMJ [2], or SG series [3, 4], is an efficient way to achieve clean and controllable energy. A key constraint on ignition threshold is the degradation of cleanliness levels inside laser systems [5]. Many factors are declining the cleanliness levels. For example, evaporation of residual detergent/water attached to cleaned components [6]; indoor contamination from human activity or ground source dust during device maintenance [7]; and unpredictable aerosol invasions resulting from laser-induced breakdowns [8]. Due to random generation time and barely detectable nature, laser-induced aerosols, especially those from transparent optics, such as fused silica, have been considered a primary cause of the degradation of cleanliness levels.
Alleviating laser-induced aerosol threats is ultra-urgent. Currently, research has mainly focused on two aspects. The first is to improve the resistance threshold of optical components against laser-induced damages with enhanced manufacturing and processing, such as laser conditioning [9], surface coating [10], surface-defects repairing [11], thermal annealing [12], etc. These operations effectively limit the amount of generated aerosol particles, improving the cleanliness level in a short period. However, the microdefects under the subsurface (like pits, scratches, and cracks [13]) constantly exist and may become a damage precursor if they absorb abundant laser energy. Eventually, laser-induced breakdowns continue to occur, followed by a sequence of material ejections [14], and the cleanliness level degrades.
The second is to maintain a high cleanliness level. This can be directly achieved by embedding particle sensors around optical components to monitor indoor cleanliness [15]. When aerosol particles accumulate beyond the standard, the components will be disassembled, cleaned, and reassembled. As a result, they can constantly operate in a clean condition. However, the cleaning method involved is offline, such as ultrasonic vibrations with deionized water [16], high-pressure detergent spraying [17], wet wiping [18], etc. Since this is time-consuming, labor-intensive, and provides delayed feedback on surrounding cleanliness, it is generally regarded as the final step in maintaining the high cleanliness level. Another way is to conduct online protection based on the kinetics of laser-induced aerosols [19]. For example, installing debris shields after optical components to isolate high-speed intrusions [20, 21]. Robust protection should include “prevention,” which avoids particle-surface contact, and “sweep,” which removes particles after colliding with the optical components. In addition, online protection requires continuous impetus from extra fields/media that affect native components less. Electrostatic fields [22] are therefore considered the least impactful method of controlling aerosols. Nevertheless, aerosols attached to dust collectors are difficult to move along with the background flow, posing a secondary pollution risk. Additionally, cleaning dust collectors still requires offline labor. An alternative would be to use gas knives [23, 24] with airflow tails connected to the flow tunnel. In this case, invasive aerosols will depart with the background flow smoothly.
Recent studies of the gas knife protection primarily focus on the high sweep efficiency in high power laser system. According to online research by Niu et al. [25], gas knives achieve an optimal sweep efficiency of 94.3% when the input pressure increases to 0.55 MPa, and the sweep efficiency for particles with a diameter of 50–100 μm is higher than for those of 30–50 μm. In addition, Li et al. [26] design a “+” type device with gas knives and vacuum cleaners to remove stainless steel particles with a diameter of 25–100 μm. Also, the results indicate a substantial improvement in sweep efficiency for particles with a diameter of 50–100 μm. These high sweep efficiencies are attributed to the high-speed airflow at the gas knife outlet, especially for large particles with a diameter of tens of microns. But for fine aerosols (several microns), the improvement is limited [27]. On the other hand, high-speed velocity may cause other problems. One is the redeposition of large particles following multiple gas knife pulses [15]. Moreover, fine aerosols are easy to move with the residual flow and scatter in space, deteriorating environmental cleanliness [28]. Additionally, high-speed airflow can modify the local thickness of a coating membrane if it blows in a specific direction, resulting in a reduction in optical performance [29].
Reducing the velocity at the gas knife outlet seems a solution especially in complicated facilities such as final optics assembly. Hu et al. [30] found that the maximum speed at the gas knife outlet should not exceed 40 m/s when the gas knife serves as “prevention.” Meanwhile, a multi-flow system coupled with low-speed gas knives [31] successfully prevented longitudinal particle invasion by forming a relaxed “air curtain” in front of the optics surface at an outlet speed of 20 m/s without declining cleanliness. These works combined with clean designs indicate a promising application with the low-speed gas knife. However, the basic flow field distributed above the surface of the large aperture optical component has rarely been discussed with explicit CFD models. In addition, recent works on the variation of the flow field along the width direction were usually performed qualitatively in terms of the changes of contour shapes without specifying the velocity value, thus lacking a comparation with laminar background flow (typically around 0.5 m/s). Furthermore, the online installation of gas knives makes it impossible for the flow field covering the entire optics surface. There must therefore be a protective difference between the core (covered by the mainstream flow) and non-core regions. The mechanism behind these differences, such as whether they are related to the outlet speed of the gas knife, or originated from the self-defects of the low-speed flow field has rarely been studied in recent works. Although the coupling effect between the gas knife flow and aerosols has been studied in recent works, the underlying mechanism has rarely been discussed. For instance, the protective mechanism of the low-speed airflow toward aerosol invasions is customarily concentrated on the “prevention” (because the gas knife flow in space is fully developed), and the “sweep” that related to the near-wall effects is ignored. In fact, the near-wall turbulence has different effects on particles with various diameters (especially for fine aerosols which accounts for the majority in laser-induced breakdown events [32]), while the mechanism is not fully understood. For example, a turbulent kinetic energy may develop anisotropically near the optics surface, resulting in changes in the motion behavior of aerosols with different diameters.
Based on these issues, this work investigates the mechanisms governing the protection capabilities of a low-speed gas knife against aerosol particles first, a three-dimensional protection flow field was established using the SST model, and the velocity distribution characteristics were analyzed, where the gas knife outlet velocity was 5, 10, and 20 m/s, respectively. Next, particle (<10 μm) invasion experiments were conducted, where particles were released overall or upstream, with detection areas covering the core and non-core regions. The protection capability at different gas knife outlet velocities, as well as the protection capability upstream, midstream, and downstream at the fixed gas knife outlet velocity, are determined accordingly. Additionally, numerical calculations based on Euler-Lagrange tracking are used to explain some mechanisms during protection process such as “midstream defects,” and “near wall effects” caused by the turbulent dispersion.
2 Experimental arrangement
2.1 Establishment of the protection flow field
A schematic illustration of a protection flow field generated by a gas knife (with an outlet gap of 0.05 mm, 25 mm vertically from the bottom), mounted in the middle on an optical surface (360 mm × 360 mm, 5 mm thick), is shown in Figure 1A. The height of the calculation domain (Y-direction, vertical) is 60 mm. Due to the symmetry in width (Z-direction, spanwise), the domain is divided in half, as shown in Figure 1B. Additionally, the spanwise distance between the lateral edge of the gas knife and the optics is 36 mm, dividing the optics surface into core and non-core regions. Moreover, three detective locations named upstream, midstream and downstream are classified based on their streamwise distance of 40, 160, and 300 mm, respectively.
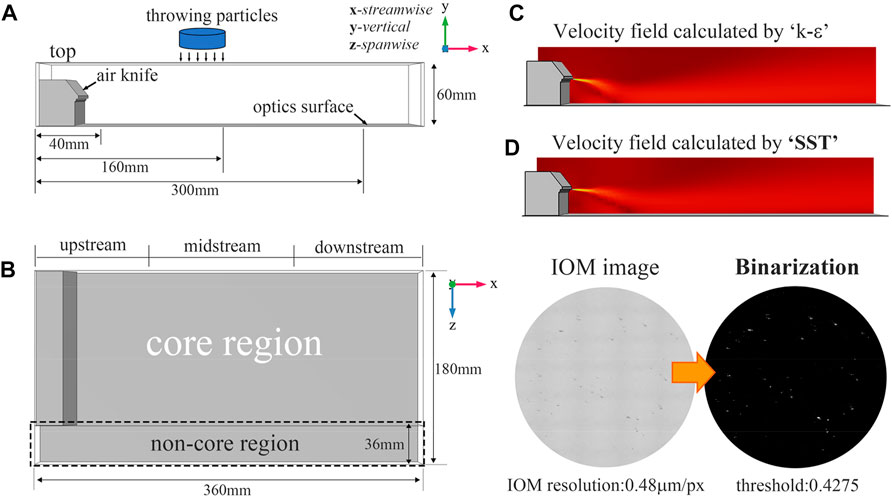
FIGURE 1. Establishment of the protection flow and arrangement on particle throwing. (A) front view projected in the xy plane, (B) top view projected in the xz plane, (C) and (D) are the velocity distribution calculated by “k-ε” and SST turbulence model, respectively.
The optics surface and gas knife profiles are set to no-slip wall boundaries, while others are set to pressure outlet boundaries, except for the gas knife outlet (velocity boundary) and the half-split surface (symmetry boundary). An SST (Shear Stress Transport) turbulence model, which combines the advantages of the k-ɛ model in the freestream and the k-ω model near the walls, is applied because: 1) gas knife spraying is a jet involving strong pressure gradients and streamline curvatures, which can be accurately resolved by the k-ω model; 2) the combination of the low Reynolds number k-ɛ model and the wall functions improves the resolution to the near-wall flow and enhances the computational speed. Figures 1C, D compares the velocity field distributions of the standard k-ɛ and SST models, where the SST turbulence model manifests a stronger jet. Additionally, the speed comparison (in the core region) between different turbulence models and experimental data (average of three tests, obtained by an air velocity meter, Model 9,565 series, VELOLICALC Corporation) is displayed below in Table 1. Obviously, the SST model is a better choice.
2.2 Numerical calculation on isolating aerosols
We seek to investigate the airflow protection against fused silica aerosol particles with a diameter of <10 μm, because these particles have potentials to travel longer distances [32]. Since the particle diameter is much smaller than the calculation domain, and there is little output after laser-induced breakdown event [33], particle motions (trajectories) within the protection flow can be calculated using the Euler-Lagrange method, where the spherical particles are the dilute phase. The drag originated from the protection flow is considered along with particle gravity. A single particle follows the Newton’s second law of motion:
where, t is the time, ρg is the particle density, dp is the particle diameter, s is the particle translational distance, FD is the drag determined by the Reynolds number, and Fg is the particle gravity. The initial timestep of particle motion should be around the response time τp,
where μ is the dynamic viscosity of the protection flow, and modified slightly depending on the initial velocity. In this work, 1.5τp is adopted, and the following timestep remains the same (no growth rate). The homogenous turbulent dispersion from the protection flow governed by the Langevin equation [34],
is considered during particle motions, where ui (unit: s) is the velocity component in the ith direction, τi (unit: s) is the Lagrange integral time scale, σi (unit: m/s) is the fluctuating root mean square of the velocity perturbation, and ξi are the uncorrelated Gaussian random numbers with zero mean and variance dt. Since kinetic turbulent energy k (unit: m2/s2) of the protection flow is severely damped near the optics surface, leading to gradient variations nearby, the turbulence becomes non-homogenous and the particle motion will be altered. The normalized Langevin equations (considering isotropic near-wall effects) in the X, Y, and Z-directions are as follows [34]:
where Stk (dimensionless) is the particle Stokes number. The σi and τi are the functions of y+ whose specified values can be found in [36]. Note that the anisotropic near-wall effects on particles are available when the dimensionless wall distance y+ <100,
where Δy (unit: m) is the wall distance, ν (unit: m2/s) is the fluid kinematic viscosity, τw (unit: N/m2) is the wall shear stress, and ρ (unit: kg/m3) is the density of the protection flow.
2.3 Surface protection experiment
We conducted the experiments in a cleanroom with a level 100 (the number of particles with a diameter larger than 0.1 μm cannot exceed 100 [5]). An industrial-grade super gas knife (110,012 series, 1.7 Mpa maximum input pressure, EXAIR Corporation) supported by an external gas system filled with nitrogen, was utilized to produce the protection flow field. Three independent velocities, 5, 10, 20 m/s, monitored at the gas knife outlet were adopted. Particles (produced by SHYYHJ Corporation, 5 μm in diameter, released through sieves with ∼8–10 μm pores) of equal mass were released at the top the flow field (60 mm in vertical) after forming a stable air film (monitored by an air velocity meter with a <10% velocity fluctuation). Particles invade the optics surface in two ways, namely overall invasion (full-area) and upstream invasion (the most vulnerable position against particle invasion). For overall invasion, as referred to Figures 1A, B, particles were released at the center of the flow field (Z = 0 mm, Y = 60 mm in the core region; Z = 162 mm, Y = 60 mm in the non-core region) from upstream, midstream and downstream, respectively, and collected accordingly at the bottom. The statistical data on each collector (round glass plates with a diameter of 10 mm) reflects the overall protection capabilities. For upstream invasion, particles were only released upstream with continuous sampling from upstream to downstream at the bottom. In this way, the statistical data can reflect the protection capabilities along the airflows. After absorbing particles for 10 min, all collectors were scanned through an inverted optical microscope equipped with a 5X lens (Nikon ECLIPSE MA 200, the field of view of a single image is about 2.49 mm × 1.79 mm, 0.48 μm/px maximum resolution) with a multi-image stitching technique. The stitched images were then postprocessed by binarization with a threshold of 0.4275, as shown at the right bottom of Figure 1. The sedimentation percentage was calculated by dividing the area of white pixels by the total area of pixels. Each test was repeated three times.
3 Results and discussion
The velocity distribution of the flow field formed by a gas knife is shown in Figure 2A. Obviously, there is an air film along the X-direction with a narrowing downward trend. Shortly near the gas knife outlet, an abrupt drop in velocity is observed. After the drop, however, the velocity varies less on the order of several meters per second. As plotted in Figure 2B, the maximum speed in the entire region along the X-direction ranges approximately from 1.5 to 5 m/s when the velocity at the gas knife outlet is preset at 5, 10, and 20 m/s, respectively. With these characteristics, the gas knife generally serves as a “low-speed” airflow protection for the optics surface. In addition, there is a distinct variation in velocity along the Z-direction. For instance, as the outlet velocity is fixed at 10 m/s, with Z = 0 m (middle of the gas knife), as displayed in Figure 2C, the mainstream flow is clearly visible, while the streamlines are mainly straight. As Z-distance increases (still within the core region), the mainstream shrinks and the streamlines become curved in the middle, as shown in Figure 2D. Meanwhile, the underlying vortex around the gas knife outlet develops. The streamlines become straight again with a developed vortex locating at the bottom when Z exceeds 0.144 m (within the non-core region, as shown in Figure 2E), and the average speed in this region is below 0.5 m/s.
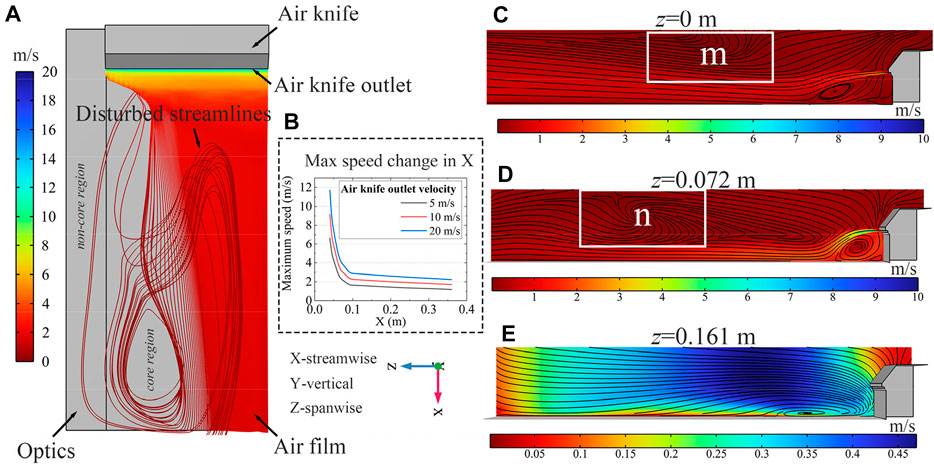
FIGURE 2. Velocity distribution of the protection flow field. (A) is the overall distribution (top view) with streamlines, (B) is the max velocity change along the X-direction, (C–E) are the distributions in different transections with streamlines, z varies from 0, 0.072, and 0.161 m, respectively.
It appears from the characteristics of the gas knife flow field that the effective protection region covered by the air film with a speed less than 5 m/s (minimum at 1.5 m/s in the core region) almost occupies the entire optics surface. The protection offered by this type of air flow is superior, in terms of maximum velocity, to the uniform laminar circulation whose average speed is usually below 0.5 m/s [31, 35]. However, there are disturbing vortices throughout the entire area, both in the core and in the non-core regions. An example would be around the gas knife outlet and in the middle in the X-direction. Furthermore, the field distribution is not uniform. Thus, there must be some defects during the protection process.
To display the ‘defect’ directly, the overall invasion experiment is conducted and results are shown in Figure 3. Figure 3A shows a monotonic decrease in particle sedimentation percentage in the core region when the velocity of the gas knife outlet is 10 and 5 m/s, respectively. In contrast, the percentage constantly increases when the gas knife outlet velocity is 20 m/s. The percentage at the same position from upstream to downstream decreases as the velocity of the gas knife outlet increases. The variation of sedimentation percentages in the non-core region is shown in Figure 3B, demonstrating that the midstream percentage is greater than that upstream and downstream. The midstream percentage obtained with a gas knife outlet velocity of 10 m/s is lower than that at 20 m/s. Likewise, the percentage at the same position from upstream to downstream decreases when the velocity of the gas knife outlet increases.
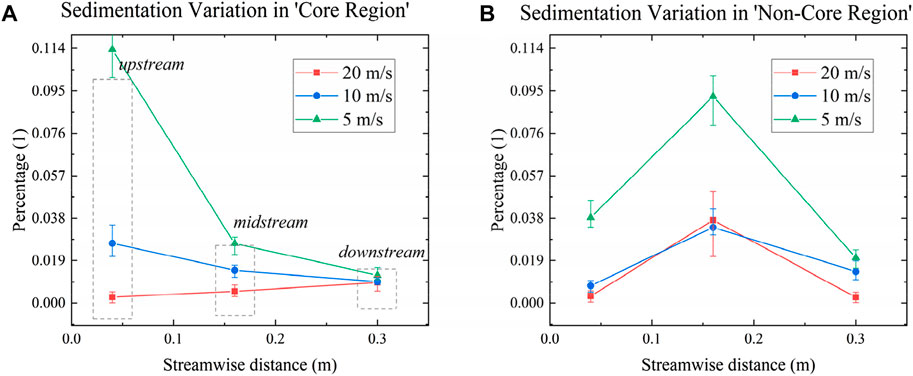
FIGURE 3. Sedimentation percentage from the overall invasion in the core region (A), and non-core region (B).
The overall invasion results may suggest some protection capabilities of the gas knife that: 1) with an increase in gas knife outlet velocity, the capability in the core region enhances; 2) other than 20 m/s, the capability in the core region increases along streamwise direction when the gas knife outlet velocity is fixed, which is opposite to the maximum speed data presented in Figure 2B; 3) the protection capability weakens in the middle of the non-core region regardless of the velocity at the gas knife outlet.
Furthermore, experimental results from the upstream invasion are shown in Figure 4 below. Figure 4A reflects that the sedimentation percentage in the core region is similar to the overall invasion, i.e., with the exception of 20 m/s, increasing gas knife outlet velocity decreases the percentage at the same locations, and maintaining gas knife outlet velocity decreases the percentage from upstream to downstream. Moreover, the midstream percentage is higher than upstream and downstream when the gas knife outlet velocity reaches 20 m/s. Additionally, in the non-core region, the percentage upstream is inversely proportional to the gas knife outlet velocity, whereas it becomes complex in midstream and downstream. As with the core region, the midstream percentage still outweighs the upstream and downstream percentages at 20 m/s gas knife outlet velocity.
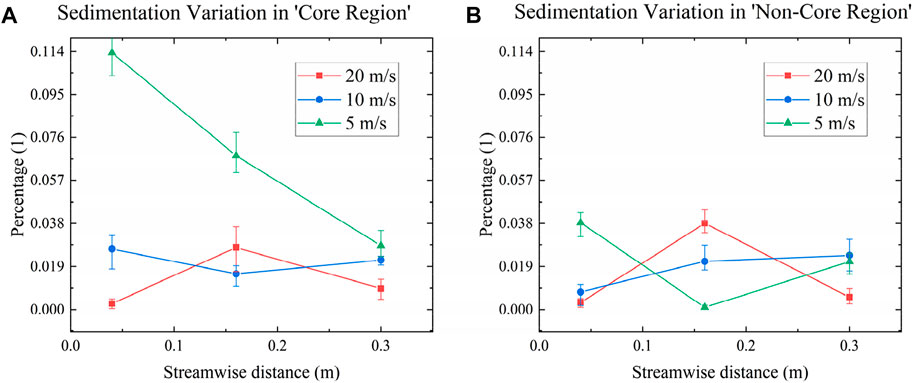
FIGURE 4. Sedimentation percentage from the upstream invasion in the core region (A), and non-core region (B).
The upstream invasion results indicate that: 1) the capability in the core region improves with an increase in gas knife outlet velocity, and the capability in the X-direction gradually decreases (except for 20 m/s) at a fixed gas knife outlet velocity; 2) there is a more pronounced midstream defect midstream at 20 m/s gas knife outlet velocity; 3) in the non-core region, particles still accumulate midstream when the gas knife outlet velocity exceeds 5 m/s.
In both experiments, the gas knife airflow provides greater protection against particle invasion as its outlet velocity increases. This is regardless of the form in which particles were released. This phenomenon can be verified by obtaining the protection efficiency (the number of particles collected at the region outlet in the X-direction divided by the total number of released particles) from a particle tracking method, where particles with a diameter of 10 μm are released. Additionally, the protection process can be predicted. Note that particles should contact the optical surface (bottom wall) during the movement, and the contacting/rebounding velocity should match the physical effects. Therefore, the particle release velocity should be predefined. In this calculation, we assume a contact velocity not exceeding 10 m/s, along with a vertical release distance of 60 mm equal to the height of the fluid domain. The release velocity v (about 380 m/s) can then be evaluated through a fluid-particle interaction Eq. 6 [36],
where dp is the particle diameter, ρp is the particle density, v is the particle velocity, CD is the drag coefficient, and ρg is the air density. Integrating Eq. 6, the particle translational distance x in the Y-direction is:
where Re1 corresponds to the Reynolds number at the contact velocity, while Re0 corresponds to the Reynolds number at the release velocity. In addition, CD is a piecewise function on different intervals of Reynolds numbers, as shown in Eq. 3,
Another critical parameter is the choice of the calculation time within the fluid domain. Theoretically, if the calculation time is infinite, all particles are able to leave the fluid domain completely, i.e., 100% protection efficiency is achieved. This is, however, contrary to the experimental results. On the other hand, if the calculation time is too short, the protection efficiency cannot be accurately determined. One possible attempt at balancing this issue is to derive the calculation time from the velocity field of the fluid domain. As displayed in Figure 2B, the minimum velocity is about 1 m/s. With it being the average speed of the fluid domain with the longest edge of 0.36 m in the X-direction, it is possible to determine the time of 0.36 s. Herein, the calculation time is set at 0.4 s.
Numerical results of protection efficiency vs. time based on input parameters above, are plotted in Figure 5, where (A) shows the overall invasion, and (B) shows the upstream invasion. With varying gas knife outlet velocities, it can provide that: 1) for overall invasion, the protection efficiency improves at velocities ranging from 5 to 20 m/s, and the maximum protection efficiency varies between 25% and 42%. The protection efficiency at outlet velocities of 10 and 20 m/s increases rapidly before 0.18 and 0.26 s, respectively, then slowly thereafter. In contrast, the protection efficiency grows steadily over time at the outlet velocity of 5 m/s; 2) for upstream invasion, the protection efficiency is proportional to the outlet velocity as well, while the maximum ranges from 15% to 75%. By contrast, the protection efficiency at outlet velocities of 10 and 20 m/s before 0.18 and 0.26 s increases slowly, then sharply thereafter. The protection efficiency at 10 and 20 m/s reaches its peak around 0.3 and 0.36 s, respectively. In addition, it is obvious that increasing outlet velocity significantly improves the protection efficiency.
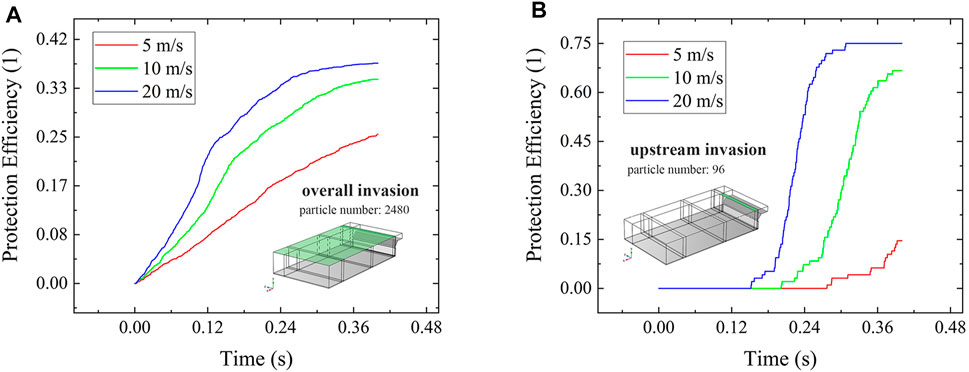
FIGURE 5. Protection efficiency vs. time when particles are released from (A) overall invasion; (B) upstream invasion.
The numerical results confirm that the protection capability improves with increasing gas knife outlet velocity. Additionally, there are some disturbances when the outlet velocity is fixed (except at 5 m/s). For overall throwing, the protection efficiency increases slowly and then sharply, while for upstream throwing, it is the opposite. This is an interesting phenomenon that may be related to the midstream defect. In short: a sharp increase in protection efficiency is observed for overall throwing, where particles midstream and downstream are able to leave the fluid region rapidly, while particles upstream are subject to midstream defect and the growth in protection efficiency declines; upstream throwing causes the particles to stag midstream and accumulate, then flush out downstream when they have reached a certain amount. As a result, the protection efficiency first increases slowly, then sharply.
To clarify protection capabilities from upstream to downstream when the gas knife outlet velocity is fixed, we extracted the average speed at each location (0.01 m × 0.18 m × 0.06 m) accordingly, as shown in Table 2. From the perspective of speed magnitude, the protection capability seems to be declining monotonically. However, the experimental results, shown in Figure 3A; Figure 4A, almost indicate the opposite effect, especially at five and 10 m/s. A possible explanation is that the downstream location is closer to the fluid boundary, so particles within are more easily expelled. For large aperture optical components in ICF, this type of flow protection is defined as dependent upon the shape of the component when its average velocity is below 1 m/s [31]: the protection capability is determined not by the maximum average speed of the flow field, but by how far the particle is from the edge of optical components. In this case, we sometimes use laminar airflows with an average speed of 0.4–0.5 m/s to prevent particles from contaminating optical component surfaces whose cleanliness levels exceed 1,000, and the results show no discernible difference in protection capabilities; [20, 24]. Other than the geometry dependence, the oblique direction of the streamlines in the tail of the flow field (providing a positive velocity in the Y-direction), as shown in Figure 2C, may also indicate some improvement in downstream protection.
It has been illustrated above that in the core region, the particle sedimentation percentage midstream increases noticeably with 20 m/s gas knife outlet velocity (especially for particles released upstream). Firstly, there is a possibility that structural defects in the flow field could weaken the protection capabilities, allowing more particles to easily deposit on the surface. It can be seen from the streamlines of the velocity field, as plotted in Figures 2C–E, that there is an oblique downward trend (m region with the amplified view shown in Figure 6A, at the top, i.e., a negative velocity in the Y-direction exists. With further assistance from gravity, in-field particles will accelerate along the -Y-direction and flush to the surface. Moreover, as the flow field extends in the Z-direction, the oblique downward trend of streamlines gradually evolves into a vortex (n region with the amplified view shown in Figure 6B. It is therefore likely that particles with low inertia and kinetic energy will be trapped. Once the gas knife is turned off, some particles may settle midstream at the bottom.
Secondly, particles will decelerate due to turbulent dispersion created by the protection flow, thereby reducing their translational distance streamwise. Figures 7A–D display particle trajectories in the protection airflow with and without considering turbulent dispersion, where particles are released upstream and the gas knife outlet velocity remains at 20 m/s. It is evident that particle streamwise trajectories calculated with turbulent dispersion shorten with time close to the end (0.4 s). Figure 7E shows the variation of particle X-distance vs. time in details. In the initial stage (0.08 s), particles subjected to the turbulent dispersion (blue line) will accelerate and extend, during which particle flow patterns are dispersed, as shown in Figure 7B. This process lasts for approximately 0.177 s. Afterwards, particles subjected to the turbulent dispersion will, in turn, decelerate dramatically, which makes the translational distance in the X-direction shorter, as displayed in Figure 7D. As a result, some particles will stagnate midstream after contacting the surface. Particles subjected to a weaker turbulent dispersion sustain a similar flow pattern, while their translational distance in the X-direction is shorter. For example, with a gas knife outlet velocity of 5 m/s, as shown in Figure 7F, the deviation of translational distance ΔX2 is about 0.04 m, which is 33% less than that of ΔX1. Therefore, the midstream accumulation is not apparent.
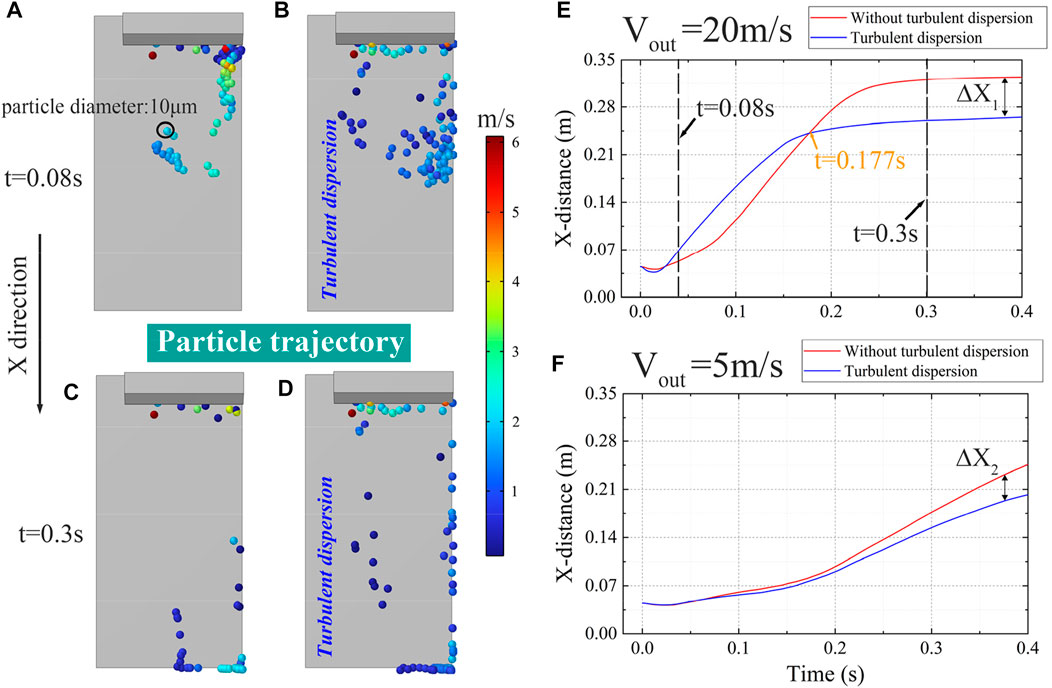
FIGURE 7. (A–D): Particle trajectories at 0.08 s and 0.3 s, where (B,D) account for the turbulent dispersion during particle motion; (E,F): X-distance vs. time when the gas knife outlet velocity is 5 m/s and 20 m/s, respectively.
A third factor contributing to midstream particle sedimentation in a high percentage may be an isotropic near-wall effect on particles of different diameters. As discussed above, the “defects” structure of the protection flow field makes it more likely for particles released midstream to contact the bottom wall. Particles then will behave differently if their diameter differs. Invasive behaviors of laser-induced particles of different diameters have been discussed elsewhere [20,24,31,32]. Here, the diameters, in numerical simulation, are predetermined at 5, 10, 20 and 50 μm, respectively, and particles are released midstream at the bottom. The gas knife outlet velocity remains at 20 m/s. To capture near-wall impacts, particles are released at a height equal to their radius at a speed of 0 m/s. Particle translational distance (average) in the X-direction vs. time is plotted in Figure 8I, where particle near-wall motions can be divided into three phases based on two time points, 0.0043 and 0.0147 s. Before 0.0043 s (phase Ⅰ), the translational distance is inversely proportional to the particle diameter. The longest translational distance occurs for particles with a diameter of 5 μm. Between 0.0043 and 0.0147 s (phase Ⅱ), the translational distance of particles with a diameter of 20 μm begins to exceed that of particles with a diameter of 5 and 10 μm. After 0.0147 s (phase Ⅲ), the translational distance of particles with a diameter of 20 μm increases significantly. Throughout the entire process, however, the translational distance of particles with a diameter of 50 μm is much shorter than those with a diameter between 5 and 20 μm.
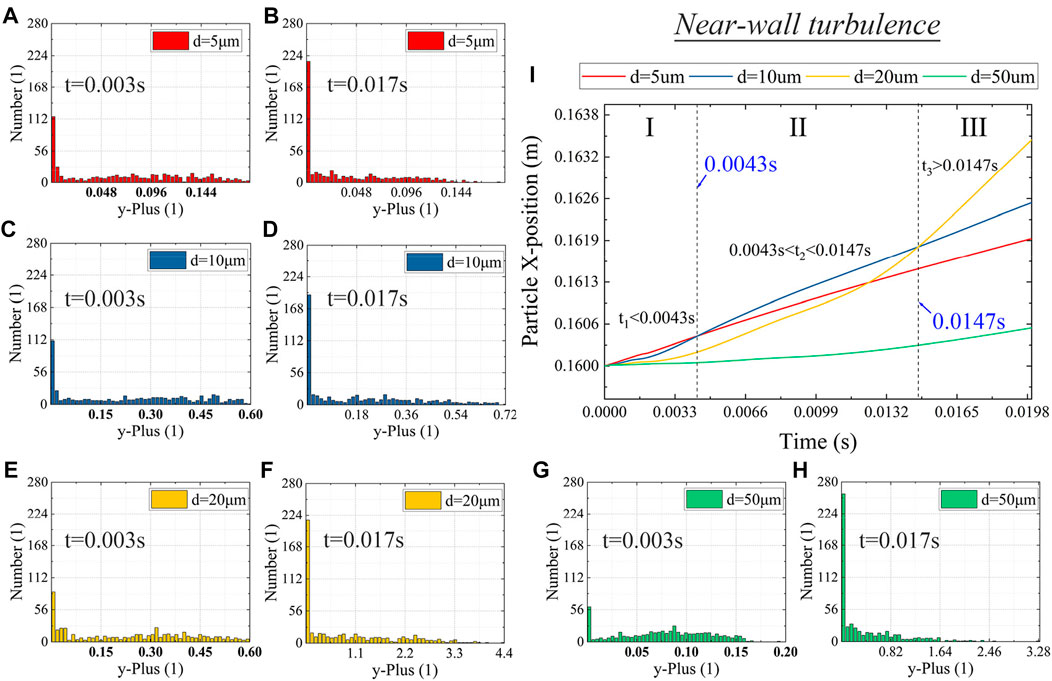
FIGURE 8. Anisotropic near-wall turbulence on particle motion at different times, where (A-H) are histograms of particle number vs. y+ with a diameter of 5, 10, 20 and 50 μm, respectively; and (I) is the particle translational distance in the X-direction vs. time.
Furthermore, we calculate the number of particles along y+, whose variation represents near-wall effects in the Y-direction. Figures 8A–H display the number variations of particles with a diameter of 5, 10, 20 and 50 μm at two time points (0.003 and 0.017 s, respectively, within phases Ⅰ and Ⅲ). From 0.003 to 0.017 s, the number of 5 μm particles in low y+ increases significantly, while it declines slightly in large y+. This indicates that these particles are strongly confined locally and have little chance of escaping the bottom wall. Likewise, there is an increasing number of 10 μm particles in low y+ with stable changes in large y+, which indicates the same mechanism. It is observed that 20 μm particles in phase Ⅰ are comparatively fewer than those with diameters of 5 and 10 μm in low y+. In phase Ⅲ, however, their number in large y+ increases significantly. This suggests that particles with a diameter of 20 μm are more likely to escape from the bottom wall. The number of particles with a diameter of 50 μm is the smallest in phase Ⅰ, whereas in phase Ⅲ, it is the largest. In this case, it is possible that these particles will first escape from the bottom wall and then return.
Based on the analysis above, particles with diameters of 5 and 10 μm (small size) have difficulty crossing the near-wall layer into the mainstream region, and their motion in the X-direction is sluggish. Therefore, they are likely to accumulate and settle, resulting in a high sedimentation percentage. Particles with a diameter of 20 mm subject to the near-wall effect, on the other hand, are more likely to flow into the mainstream and depart with it. Additionally, inertia effects are more pronounced for particles with a diameter of 50 μm (large size) as opposed to the near-wall effect. In the X-direction, their translational distance varies the least. To conclude, if released particles immediately contact the surface or aggregate deeply (from a small to a large particle) during their movement, they may contribute to the increase in sedimentation percentage.
Experimental results in the non-core region also indicate an increase in sedimentation percentage midstream. Contrary to the core region, the in-field average speed is extremely low, usually less than 0.2 m/s. Thus, the turbulent dispersion effect caused by turbulent kinetic energy k (unit: m2/s2) is weakened and the rationale for the high sedimentation percentage differs. While the turbulent kinetic energy and the turbulent dissipation rate ɛ (unit: m2/s3) decrease significantly, the turbulent lifetime scale (unit: s, which indicates how long the turbulence lasts) has been extended. Figures 9A–C show variations in turbulent lifetime along the Z-direction. As Z increases from 0.144 to 0.179 m, a locally prolonged turbulent lifetime scale (labelled O, P, and Q) is consistently present midstream near the top. As released particles with low kinetic energy enter this region, they may experience relative long-term but weak turbulence, which may further increase the uncertainty of their course. In addition, the orientation of streamlines, as plotted in Figures 9D–F, is opposite to the core region. When streamlines approach the core region (with Z between 0.179 and 0.144 m), they become more curved, with a greater convergence towards the gas knife outlet. This suggests that particles released from the non-core region may converge toward the gas knife outlet (upstream). Over time, some particles will enter the mainstream in the core region and depart. Nevertheless, within the simulation time, most particles will gather in the middle. Particle trajectories at various times in the non-core region are shown in Figures 9G–I, where particles are released at the top of the non-core region with the same parameters set in the core region. As a result of the inverse flow, particles are gathering towards the center, thereby increasing midstream sedimentation percentage.
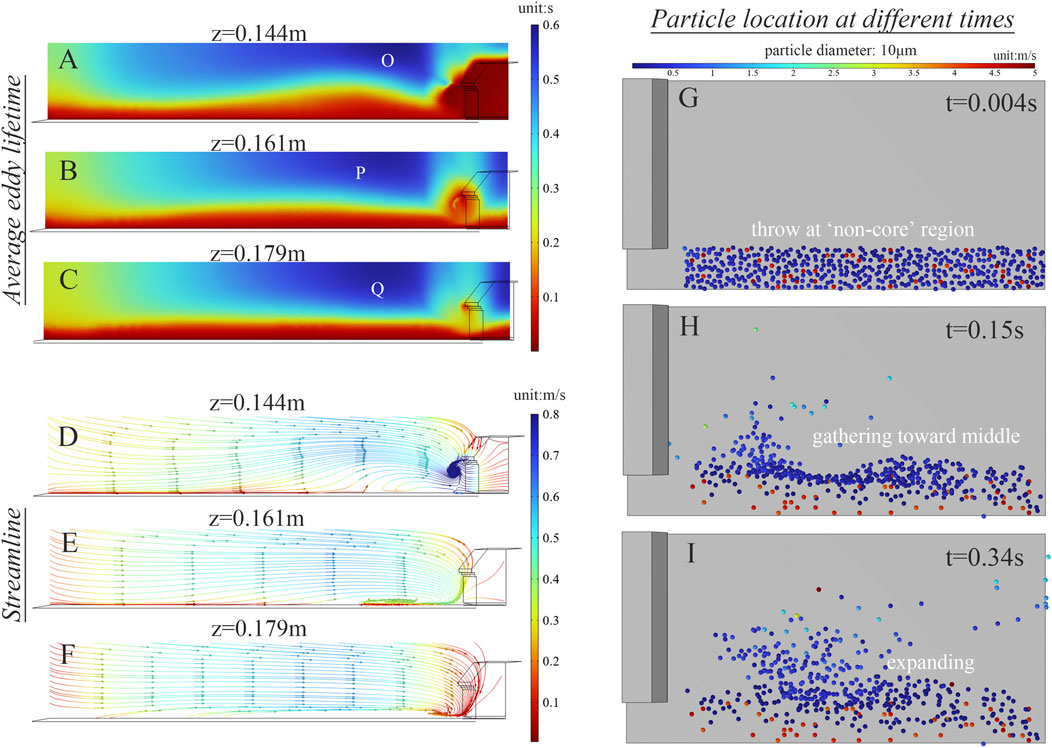
FIGURE 9. Explanation of sedimentation percentage increased in the non-core region, where (A–C) is the average eddy lifetime of the protection flow transected at 0.144, 0.161, and 0.179 m, respectively, while (D–F) is the streamline distribution transected at the same location, respectively; (G–I) are particle trajectories simulated at different times after releasing at the top of the non-core region.
4 Conclusion
This study is to investigate the mechanism of surface protection by generating low-speed airflow from a gas knife installed parallelly at the top of a large aperture optical component. Fused silica aerosols pose a threat. Numerical calculations involving CFD-DEM coupling are used to explain experimental results and reappear the protection process. The low-speed airflow protection has the following characteristics:
(1) The protection capability improves in the core region with a velocity increase from 5 to 20 m/s in the gas knife outlet velocity.
(2) The protection capability tends to improve sequentially from upstream to downstream when the gas knife outlet velocity is fixed (except for 20 m/s).
(3) Regardless of whether particles are released upstream (the most vulnerable location against particle invasion) or overall (full-area invasion), there are always midstream defects midstream when the gas knife outlet velocity reaches 20 m/s.
(4) The protection capability in the non-core area is noticeably weaker than that in the core area. With increasing velocity at the gas knife outlet, the protection capability is less likely to improve.
(5) There is a difference in the mechanism of the midstream defect in the core and non-core regions.
Further optimal applications of gas knives in the ICF devices can be conducted on the basis of this work. For example, increasing the angle of the gas knife outlet toward the optics surface. In this case, the midstream defects may be deferred along streamlines. Similarly, extending the distance longitudinally between the gas knife and optics edge, which advances midstream defects outside the protective area, may be a viable option.
Data availability statement
The original contributions presented in the study are included in the article/supplementary material, further inquiries can be directed to the corresponding authors.
Author contributions
Methodology, PG, CX and LH; Project administration, LH; Supervision, ZP; Visualization, DZ; Writing—original draft, PG; Review & editing, GQ.
Funding
This work was performed under the auspices of the National Natural Science Foundation of China 51535003 and NSAF Joint Fund U2030109.
Acknowledgments
We would like to acknowledge Lingxi Liang and Chengyu Zhu from the School of Astronautics, Harbin Institute of Technology, for the experiment support and simulation conversations.
Conflict of interest
The authors declare that the research was conducted in the absence of any commercial or financial relationships that could be construed as a potential conflict of interest.
Publisher’s note
All claims expressed in this article are solely those of the authors and do not necessarily represent those of their affiliated organizations, or those of the publisher, the editors and the reviewers. Any product that may be evaluated in this article, or claim that may be made by its manufacturer, is not guaranteed or endorsed by the publisher.
References
1. Lindl JD, Amendt P, Berger RL, Glendinning SG, Glenzer SH, Haan SW, et al. The physics basis for ignition using indirect-drive targets on the National Ignition Facility. Phys Plasmas (2004) 11(2):339–491. doi:10.1063/1.1578638
2. Fleurot N, Cavailler C, Bourgade JL. The Laser Megajoule (LMJ) Project dedicated to inertial confinement fusion: Development and construction status. Fusion Eng Des (2005) 74(1-4):147–54. doi:10.1016/j.fusengdes.2005.06.251
3. Lin Z, Deng X, Fan D, Wang S, Chen S, Zhu J, et al. SG-II laser elementary research and precision SG-II program. Fusion Eng Des (1999) 44(1-4):61–6. doi:10.1016/s0920-3796(98)00308-1
4. Zheng W, Wei X, Zhu Q, Jing F, Hu D, Su J, et al. Laser performance of the SG-III laser facility. High Power Laser Sci Eng (2016) 4:e21. doi:10.1017/hpl.2016.20
5. Wang M, Wang B, Miao X, Cheng X, Wu W. Status of cleanliness maintaining in target beam enclosures in SG III facilities and contamination sources analysis. In: 7th International Symposium on Advanced Optical Manufacturing and Testing Technologies: Large Mirrors and Telescopes; 26-29 April 2014; Harbin, China (2014). p. 54–60.
6. Pryatel JA, Gourdin WH, Frieders SC, Ruble GS, Monticelli MV. Cleaning practices and facilities for the national ignition facility (NIF). Laser-Induced Damage Opt Mater (2014) 2014:390–410. doi:10.1117/12.2075927
7. Cheng X, Miao X, Wang H, Qin L, Ye Y, He Q, et al. Surface contaminant control technologies to improve laser damage resistance of optics. Adv Condensed Matter Phys (2014) 2014:1–7. doi:10.1155/2014/974245
8. Raman RN, Demos SG, Shen N, Feigenbaum E, Negres RA, Elhadj S, et al. Damage on fused silica optics caused by laser ablation of surface-bound microparticles. Opt Express (2016) 24(3):2634–47. doi:10.1364/oe.24.002634
9. Bass IL, Guss GM, Nostrand MJ, Wegner PJ. An improved method of mitigating laser-induced surface damage growth in fused silica using a rastered pulsed CO2 laser. Laser-Induced Damage Opt Mater 2010 (2010) 7842:522–33. doi:10.1117/12.867862
10. Papernov S, Schmid AW. Correlations between embedded single gold nanoparticles in SiO 2 thin film and nanoscale crater formation induced by pulsed-laser radiation. J Appl Phys (2002) 92(10):5720–8. doi:10.1063/1.1512691
11. Rak M, Eremin NN, Eremina TA, Kuznetsov VA, Okhrimenko TM, Furmanova NG, et al. On the mechanism of impurity influence on growth kinetics and surface morphology of KDP crystals—I: Defect centres formed by bivalent and trivalent impurity ions incorporated in KDP structure—theoretical study. J Cryst Growth (2005) 273(3-4):577–85. doi:10.1016/j.jcrysgro.2004.09.067
12. Raman RN, Negres RA, Matthews MJ, Carr CW. Effect of thermal anneal on growth behavior of laser-induced damage sites on the exit surface of fused silica. Opt Mater Express (2013) 3(6):765–76. doi:10.1364/ome.3.000765
13. Demos SG, Negres RA, Raman RN, Rubenchik AM, Feit MD. Material response during nanosecond laser induced breakdown inside of the exit surface of fused silica. Laser Photon Rev (2013) 7(3):444–52. doi:10.1002/lpor.201200100
14. Bude J, Miller P, Baxamusa S, Shen N, Laurence T, Steele W, et al. High fluence laser damage precursors and their mitigation in fused silica. Opt express (2014) 22(5):5839–51. doi:10.1364/oe.22.005839
15. Gourdin WH, Dzenitis EG, Martin DA, Listiyo K, Sherman GA, Kent WH, Pryatel JA, Insitu surface debris inspection and removal system for upward-facing transport mirrors of the National Ignition Facility. Laser-Induced Damage Opt Mater 2004 (2005) 5647:107–19. doi:10.1117/12.585077
16. Li Y, Bai Q, Guan Y, Zhang P, Shen R, Lu L, et al. In situ plasma cleaning of large-aperture optical components in ICF. Nucl Fusion (2022) 62(7):076023. doi:10.1088/1741-4326/ac555c
17. Yuhai LI, Qingshun BAI, Yuheng GUAN, Hao LIU, Zhang P, Batelibieke B, et al. The mechanism study of low-pressure air plasma cleaning on large-aperture optical surface unraveled by experiment and reactive molecular dynamics simulation. Plasma Sci Tech (2022) 24(6):064012. doi:10.1088/2058-6272/ac69b6
18. Liu H, Li Y, Niu L, Zhang P, Miao X, Bai Q, et al. Spectral diagnosis of in situ plasma cleaning in large-aperture optical components: Reactive species characterization and prediction of cleaning. Appl Opt (2022) 61(10):2649–56. doi:10.1364/ao.448594
19. Raman RN, Negres RA, Demos SG. Kinetics of ejected particles during breakdown in fused silica by nanosecond laser pulses. Appl Phys Lett (2011) 98(5):051901. doi:10.1063/1.3549193
20. Bude J, Carr CW, Miller PE, Parham T, Whitman P, Monticelli M, et al. Particle damage sources for fused silica optics and their mitigation on high energy laser systems. Opt Express (2017) 25(10):11414–35. doi:10.1364/oe.25.011414
21. Bude J, Miller PE, Shen N, Suratwala T, Laurence T, Steele W, Guss G. Silica laser damage mechanisms, precursors, and their mitigation. Laser-Induced Damage Opt Mater 2014 (2014) 9237:108–20. doi:10.1117/12.2070017
22. Islamov SR. Influence of gas velocity on the particle collection and reentrainment in an air-cleaning electrostatic precipitator. Aerosol Sci Tech (2018) 52(12):1415–28. doi:10.1080/02786826.2018.1528003
23. Hu S, Shang Q, Zhang P, Chen J, Zhang F, Miao X. Study of airflow regime upon optic inside frequency multiplying device and achievement of cleaning technique. Optik (2021) 240:166777. doi:10.1016/j.ijleo.2021.166777
24. Zhu D, Li P, Chai X, Feng B, Peng Z. General design and experiment for separated final optics assembly on high energy laser system. Opt Laser Tech (2020) 128:106213. doi:10.1016/j.optlastec.2020.106213
25. Niu L, Liu H, Miao X, Lv H, Yuan X, Zhou H, et al. Cleaning mechanism of particle contaminants on large aperture optical components by using air knife sweeping technology. In: Fourth International Symposium on Laser Interaction with Matter; September 21-22, 2020; Islamabad, (2017). p. 489–95.
26. Li Y, Zhu J, Pang X, Tao H, Jiao X, Wu Y. Numerical simulation of debris-removal trajectories on the transport mirrors in high-power laser systems. High Power Laser Sci Eng (2015) 3:e5. doi:10.1017/hpl.2014.53
27. Li Y, Zhu J, Wu Y, Jiao X, Pang X. Research on cleanness controlling technology of transport mirrors in high power laser system. In: 2015 International Conference on Optical Instruments and Technology: Advanced Lasers and Applications; 17-19 May 2015; Beijing, China (2015). p. 244–51.
28. Bai Q, Li Y, Zhang K, Wang C, Yuan X, Zhang F. Cleaning state of the loop case for optical crystal module in final optics assembly. Nanomanufacturing and Metrology (2018) 1(4):260–7. doi:10.1007/s41871-018-0029-4
29. Choi JH, Kim GM. Development of an air-knife system for highly reproducible fabrication of polydimethylsiloxane microstencils. J Micromechanics Microengineering (2015) 25(8):085014. doi:10.1088/0960-1317/25/8/085014
30. Hu S, Zhang F, Shang Q, Chen J, Lu L, Miao X, et al. Optimization of cleaning technique for mitigating particulate contamination upon final optics assemblies. Optik (2021) 231:166365. doi:10.1016/j.ijleo.2021.166365
31. Peng G, Chen J, Lu L, Miao X, Dong Z, Leng D. Dual dynamic airflow protection for the removal of fused silica micron particles in the final optics assembly. Aerosol Sci Tech (2020) 54(3):342–52. doi:10.1080/02786826.2019.1699645
32. Peng G, Zhang P, Dong Z, Chen J, Liang L, Zhu C, et al. Spatial sputtering of fused silica after a laser-induced exploding caused by a 355 nm nd: YAG laser. Front Phys (2022) 2022:10. doi:10.3389/fphy.2022.980249
33. Raman RN, Elhadj S, Negres RA, Matthews MJ, Feit MD, Demos SG. Characterization of ejected fused silica particles following surface breakdown with nanosecond pulses. Opt Express (2012) 20(25):27708–24. doi:10.1364/oe.20.027708
34. Dehbi A. Turbulent particle dispersion in arbitrary wall-bounded geometries: A coupled CFD-Langevin-equation based approach. Int J Multiphase Flow (2008) 34(9):819–28. doi:10.1016/j.ijmultiphaseflow.2008.03.001
35. Friberg BE, Burman LG, Friberg S. Zoned exponential, vertical and horizontal ultra-clean laminar airflows: No differences in bacteriological efficiency. Acta Orthopaedica Scand (1998) 69(2):169–72. doi:10.3109/17453679809117621
Keywords: fused silica, airflow (AF), particle, air knife, high-power laser system, cleanliness
Citation: Peng G, Gao Q, Dong Z, Chen J, Zhang P and Lu L (2023) Low-speed gas knife protection for the large aperture optical component in high-power laser systems. Front. Phys. 11:1061541. doi: 10.3389/fphy.2023.1061541
Received: 04 October 2022; Accepted: 06 January 2023;
Published: 19 January 2023.
Edited by:
Subrata Das, National Institute for Interdisciplinary Science and Technology (CSIR), IndiaReviewed by:
Shahzad Ahmad, University of Delhi, IndiaSudipta Som, National Taiwan University, Taiwan
Copyright © 2023 Peng, Gao, Dong, Chen, Zhang and Lu. This is an open-access article distributed under the terms of the Creative Commons Attribution License (CC BY). The use, distribution or reproduction in other forums is permitted, provided the original author(s) and the copyright owner(s) are credited and that the original publication in this journal is cited, in accordance with accepted academic practice. No use, distribution or reproduction is permitted which does not comply with these terms.
*Correspondence: Qiang Gao, Z2FvcUBoaXQuZWR1LmNu; Lihua Lu, bGlodWFsQGhpdC5lZHUuY24=
 Ge Peng1
 Qiang Gao
 Lihua Lu

