- 1School of Foreign Studies, Northwestern Polytechnical University, Xi’an, China
- 2College of International Cooperation, Xi’an International University, Xi’an, China
- 3School of Economics and Management, Fuzhou University, Fuzhou, China
The Sino-U.S. relationship is one of the most important bilateral relationships in the literature of global geopolitics. Not only the two countries, but also other nations in the relevant regions have been influenced by their economic, cultural, political, educational, and diplomatic relations. In this paper, we have applied Visibility Graph as the method, analyzed the data from Baidu searching index of the keyword “Sino-U.S. relations” from 2011 to 2021 into a directionless and authoritarian network, and studied its dynamic characteristics. from the time series data, it has been found that the relationship between the data is closer with more edges, greater degrees, and greater clustering coefficients. Meanwhile, the shorter the average path length, the closer the relationship between the data. The results provide a new perspective for analyzing the time series characteristics of Sino-U.S. relations.
1 Introduction
In recent years, the increasing instability of Sino-U.S. relations result in the conflicts of interest between two countries, and various neighbor countries have also introduced new policies due to the change of Sino-U.S. relations: trading policies, tariff policies, migration policies etc., which have aroused widespread concern among researchers in the field of geopolitics and others. For instance [1], have studied the dynamic relationship between the political conflict and bilateral trading connections of China and the U.S., The results showed that along with the decreasing global economic, the Chinese and U.S. governments should strengthen trading cooperation and seek consensus on economic interests in order to improve bilateral relations [2]. Studied how to discuss Sino-U.S. relations in the news coverage of Sino-U.S. trading conflict. They found that Sino-U.S. relations can be divided into antagonistic relations, negotiatory relations and cooperative relations. In these relationships, China is structured as a victim of the trade conflict, a defender of the free trade, a facilitator of negotiations, and a beneficiary of cooperation. These identities and relationships are constructed through constructive, disruptive, justified, and transformative strategies. It was further found that the diversity of China’s ethnic identity and Sino-U.S. relations in Chinese news reports were the result of political, social, and economic differences between the two countries [3]. Considered the impact of artificial intelligence (AI) industry on Sino-U.S. relations and argued that AI would become a more focused area of competition between China and the U.S., especially in the context of increasingly fierce and complex strategic competition between both countries in recent years, which can be used as a microcosm of changes between the two countries [4, 5]. Also believe that AI could profoundly affect Sino-U.S. relations. On the one hand, the competition between China and the U.S. around AI area may exacerbate strategic suspicion, accelerate the arms race in AI industry, and undermine the strategic stability of the two countries. On the other hand, the rapid development of AI industry has the potential to open new areas of Sino-US cooperation. As AI introduces new forms of uncertainty into the international geopolitics arena, China, and the U.S., as two global powers, need to increase trust and resolve disputes [6]. Analyzed the impact of the latest shift in Chinese naval strategy on Sino-U.S. maritime relations [7]. Further studied the Sino-U.S. relationship from the year of 2008–2021. The main purpose of this research is to reveal the connections of Sino-U.S. relationship through the network. Based on previous studies from international relationship and geopolitics area, this paper introduced visibility graph theory into this topic for the first time. The results from the analysis provide a novel research methodology for scholars to analyze Sino-U.S. relationship.
The rapid development of information technology and the popularity of the Internet have changed people’s lives. The Internet has become a hub for receiving and transmitting information. Moreover, searching engines provide Internet users with the most convenient way to acquire the information they need. Due to the large amount of data stored in its servers, searching engines can now demonstrate the searching trend within a time frame. Internet giants such as Google and Baidu have both released their own searching engine products. Google Trends and Baidu Index, these two searching engines often considered as the largest in English and Chinese. Moreover, these products can now show searching trends for certain keywords over time, and it can also provide a source for analysts to explore the behavior of Internet users, analyze market trends, and monitor public sentiments. Based on the complexity of Internet user relationships and their information, the entire Internet is a complex network.
Since the birth of complex networks at the end of the last century, this discipline has become an important way for scholars to reveal hidden connections between multiple systems and their components [26]. As this new research has evolved over the decades, the study of complex networks flourished in many directions [9], and view-based network analysis is one of them. Meanwhile, network science has been used in many fields of science: epidemic spreading process in the complex network [10–12], locating multi-sources in social networks [13], the social network problems in the multiplex networks [14]. [15] proposed a simple and fast computational method called the visibility graph algorithm in 2008. This method converts the time series data into a visibility graph which explores a new direction for the development of complex network, providing a new method for characterizing time series from a new perspective. Visibility graph analysis is a method based on the principle of time series visualization; hence, various networks can be derived, such as transportation networks, world-wide networks, interpersonal networks, etc. thereby providing a novel method for characterizing time series from a totally different perspective. After developing rapidly for years, this technique has been widely used in various researches [10, 16–19], Inspired by this, we adopt the visibility graph to explore a typical time series data, i.e., the Baidu searching index about the keyword “Sino-U.S. relations” (in Chinese pinyin“zhong mei guan xi”); thus, the dynamic characteristics of Sino-U.S. relations can be analyzed explicitly. From the aspect of complex network, we hope to reveal more information about time series data. Based on previous studies, this research method has been implemented into many academic backgrounds [20]. Studied time series by constructing complex networks through pseudo-periodic time series, and studied the relationship between constructed networks and primitive time series [21]. Mapped time series to the nearest neighbor network [22]. Introduced the concept of recursive networks [23]. Found out that the visibility graph algorithm preserved the characteristics of the time series [24]. Also indicated that by using visibility graph algorithm, it is possible to determine whether the studied system has the feature of definiteness and randomicity based on the characteristics of complex network [25]. Also applied visibility graph algorithm to analyze the similarity and heterogeneity of price time series in seven carbon pilot markets in China. At present, time series analysis based on visibility graph algorithm has been applied in multiple fields [26]. Summarize the model of converting time series into complex network [27]. Analyzed the rate change during the past years based on the visibility graph in order to explore new features.
From the perspective of time series, this paper converts the time series data from Baidu searching index with the keyword “Sino-U.S. relations” into a complex network through the principle of visibility graph algorithm. Then, we analyze the kinetic characteristics and influence mechanism of the time series through various evaluation metrics, including the degree distribution, cluster coefficient, network diameter and other indicators. As revealed by the obtained results, we find that Chinese searching behavior is typical social behavior, and the degree distribution of the search index is a power-law distribution, which shows that the network is a scale-free network. Chinese people have a long-term memory of the attention of China and the United States. Furthermore, essential time nodes can also be identified through the centrality of the network.
The following sections of the paper will be listed as: Section 2 will introduce the adopted model and corresponding research methods; Section 3 will list the incorporated data to be analyzed in this paper; the paper will draw the conclusions in Section 4, also with some further research orientations.
2 Model and method
2.1 Research description
When we discuss relations between countries, scholars usually focus on international relations, linguistics, diplomacy, geopolitics, and other fields of study. However, the relationships of all varieties of data can construct a complex network. Therefore, we construct this network using the time series visibility graph (VG) method proposed by Lacasa et al. [15, 28]; with the help of this VG theory, we can perform sufficient analysis on the Sino-U.S. relationships. The notion of complex networks is a branch of statistical physics and network science. It describes the characteristics of complicate systems and their corresponding dynamics. In addition, time series data can be mapped into a complex network by multiple algorithms. By studying the topologies of different networks, it is possible to discover their dynamic characteristics, which in turn reveals hidden connections on the Internet. According to Lacasa et al., different time series can be converted into multiple networks. That is, periodic time series, random time series and fractal time series can be constructed as regular networks, random networks, and scale-free networks, respectively.
2.2 Complex networks
Considering that time series data will be projected into a complex network, the concept of a complex network will be briefly described. The graph consists of a node set and an edge set, usually thought of as a network, and is often described as G = (V, E), where Num = V represents the number of nodes and M = E represents the number of edges. In addition, if a complex network is a weighted network, then edges can also be described as (u, v, w), where u and v represent different nodes (u≠v), and w represents the weight of the edge. Complex networks are an effective tool for analyzing problems, which are widely used for analysis of social problems, management science problems, computer and statistical problems, and other issues.
Aiming to discover the features of the chosen dataset, we then will apply various evaluation metrics to analyze the derived networks, including degree distribution, cluster coefficient, average cluster coefficient, network diameter and other indicators [27].
2.2.1 Degree and degree distribution
For the analysis of complex network, degree is one of the most fundamental properties. For a single node v, it is degree (i.e., d(v)) is defined as the number of edges with node v. Moreover, for the directed graph, according to the start and end points of the edges, two types of degrees are defined, i.e., out-degree and in-degree respectively. In a complex network, we usually anticipate that the larger the degree of node, the higher importance is. Once the degrees of all the nodes are derived, the average degree of the network can be obtained accordingly which is calculated as:
where ki represents the degree of nodes vi and N denotes the total number of nodes in the studied networks. The distribution of the degrees of nodes in the network can be described by the distribution function P(k), which represents the proportion of nodes in the network with a moderate degree of k in the network. Common degree distributions are listed as: Delta distributions for regular networks, Poisson distributions for completely random networks, and power-law distributions for most real-world networks.
2.2.2 Cluster coefficient
For complex networks, clustering coefficient is another important static geometric feature. If a node is directly connected to vi, then it is referred as the neighbor node of vi. Aiming to measure the level of a node being are connected, scholars defined the clustering coefficient. For node vi, corresponding clustering coefficient Ci is defined as the ratio between the actual number of edges Ei and the total number of possible edges for neighbors of node vi (i.e.,
where
where N indicates the total number of nodes. Obviously, the value of C varies from 0 to 1. When all nodes are isolated, we can have C = 0; when any two nodes in the network are directly connected which in another word, globally coupled, then we have C = 1. When the value of N is large enough, C = O (N-1) holds. In practice, there exist obvious clustering effects in many actual complex networks, and with the increase of the network size, the clustering coefficient C tends to be a non-zero constant, that is, when N→∞, C = O (1), and similar nodes tend to be clustered together.
2.2.3 Network diameter and average path length
In the network for any two nodes i and j, we can get the shortest distance dij between these two nodes, then the network diameter D is the largest path between these shortest paths,
Average path length is usually defined as L, which describes the average number of edges that are necessary to be passed from one node to another. This can also be referred to as the average of the shortest path among all node pairs in the viewable view. It is defined as:
2.2.4 Graph density
For graph density, it is defined to measure the integrity of a network which also refers to the level of connection tightness among nodes in a network. Thus, the more connections exist among nodes, the larger the graph density is. We know that for any possible node pairs in a complete graph, the two nodes are connected to each other, thus, we have a graph density of 1. For the network G= (V, E), corresponding graph density is calculated as:
where N indicates the total number of nodes, and E represents the total number of edges.
2.2.5 Motif
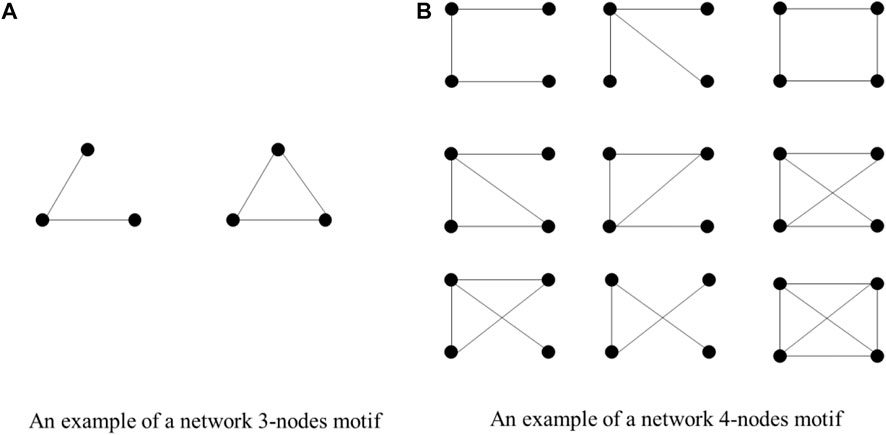
Motif can be regarded as subgraph of a network, i.e., a “small system” in a complex system. It is a small-scale pattern that occurs rather frequently in real networks than in random networks. It belongs to one of the basic topological structures of networks. The frequency of motifs in real networks is much higher than in random networks with the same number of nodes and connections [16, 18]. For majority networks, there are some common motifs which are composed of a fixed number of four nodes. Here, we illustrate 3-motif and 4-motif as in Figures 1A, B respectively.
2.3 Visibility graph algorithm
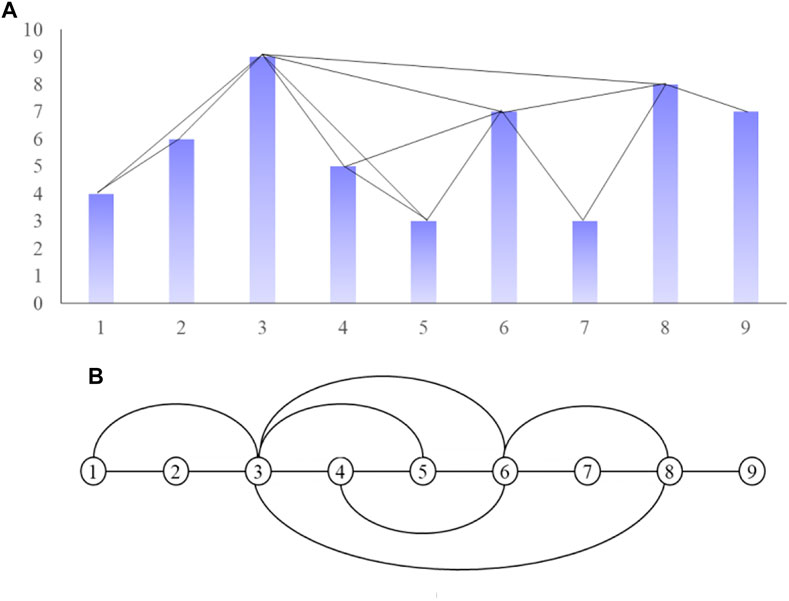
In this paper, the VG model is employed to convert time series data into a complex network. Corresponding definition for VG theory is provided as: if any two points
Figure 2 shows the definition in Eq. 7. In Figure 1A, the height of the straight rod represents the data value for each time step. If the tops of the two straight rods can touch each other, then we can say that the two corresponding points are connected, as shown in Figure 1B.
Specifically, Figure 2 illustrates a good illustration of the conversion of time series data into a network. As it is shown in Figure 1, the values for nodes 1, 2, and 3 are 4, 6, and 9, respectively. According to Eq. 7, it can be calculated that the values of nodes 1, 2, and 3 have a relationship 6 < 4 + (4–9) (1–2)/(3–1) = 6.5. It can therefore be explained that Node 1 and Node 3 are connected.
3 Data
Due to the unlimited nature of time series data, the time range explored in this paper is the most recent time series data indexed by Baidu, the largest Chinese searching engine for the last 11 years. We define each day of the year as a node, so there will be a total of 365 nodes per year, in addition to 366 nodes in 2012, 2016 and 2020.
3.1 Viewable network
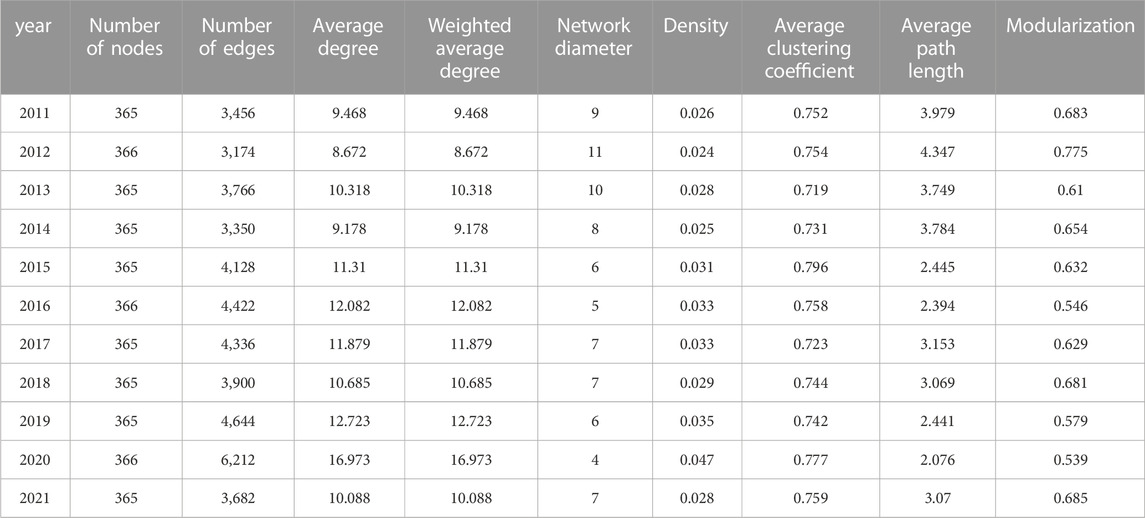
Based on the Baidu searching index data on “Sino-U.S. relations” for each year, we can easily obtain a complex network representing Sino-US relations through the adoption of VG theory. The characteristics of the derived networks are provided in Table 1. In this table, number of nodes are represented by days of each year, while the number of edges reached its peak value at the year of 2020. Meanwhile, the density has also increased and reached its high at 0.047 this year with a diameter between 4 and 5, indicating that more information about Sino-US relations has been searched. Even before the year of 2020, the density has increased gradually only except the year of 2012, 2014, and 2018 with slightly decline.
Similarly, the average path length has decreased from 3.979 to 3.07, and the average clustering coefficient ranged between 0.7 and 0.8, with an overall decreasing trend. It explains that the network’s connection is becoming more intensive. Chinese citizens no longer gather in a single topic of the affairs between two countries, but gradually began developing a multi-directional circulation trend. With the interactions in multiple aspects of China and America, there are more discussions in different topics of Sino-U.S. relationships on the Internet.
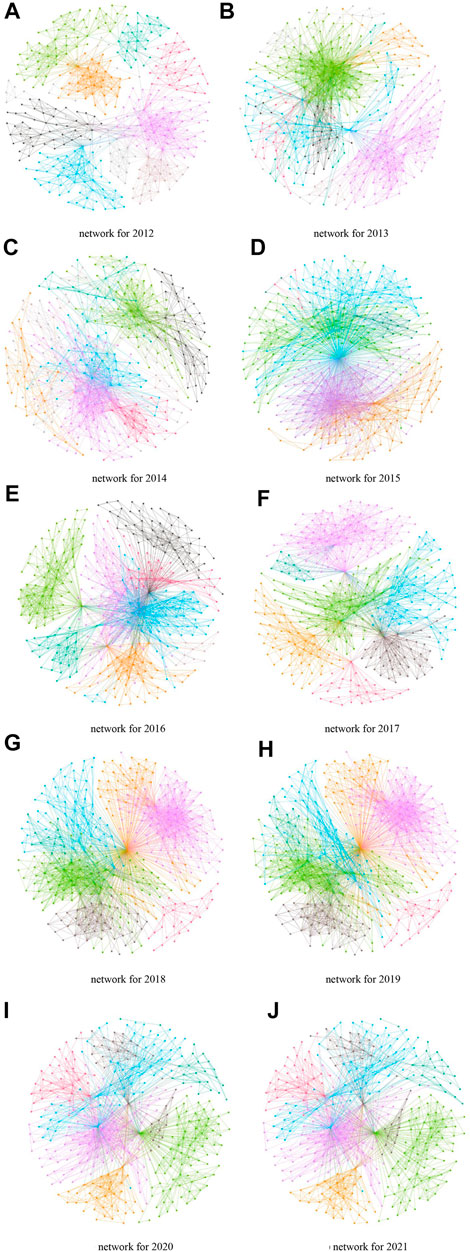
As illustrated, we can find that for the year where the relationship between the data is closer with greater degrees and clustering coefficients. The path between data also obtains with shorter path length. Furthermore, the derived complex network of the U.S.-China Relations can also be visualized as in Figure 3.
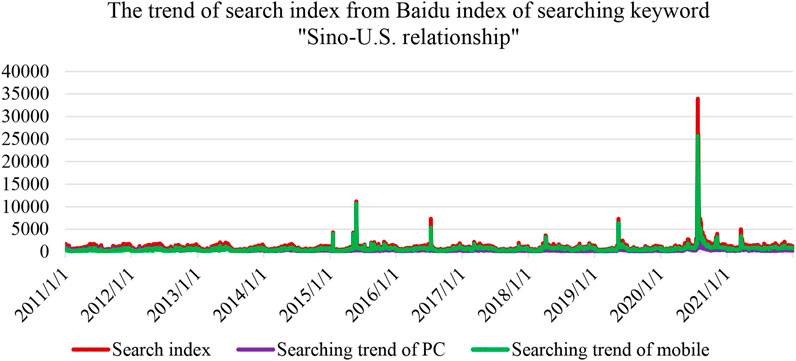
Furthermore, we also present the searching trend of “Sino-U.S. relations” from the year 2011–2021. The results are provided in Figure 4, where the red line represents the total searching index consisting of PCs and mobile devices. The green line indicates that the searching index of mobile devices dominates the total searching index. In 2010, China’s GDP rise to the second in the ranking list among all the countries in the world. Then, starting from 2011, the United States introduced a series of measures to suppress the development of China, for instance, “returning to the Asia-Pacific region,” implementing “Asia-Pacific rebalancing,” and forming the TPP (Trans-Pacific Partnership) while excluding China. In 2020, the US government represented by Trump emphasized “America first”; the US government focused on promoting “decoupling” from China and vigorously suppressed Chinese technology companies such as Huawei and TikTok. As a result of the all-round suppression to China by the United States, frictions between the world’s two largest economies in politics, economy, diplomacy, and people-to-people exchanges have been deepening, and Sino-US relations have continued to deteriorate. As the world’s largest power, the economic and political measures of the United States will have a profound impact on the development of China and even the world, so Sino-US relations have also been valued by their citizens.
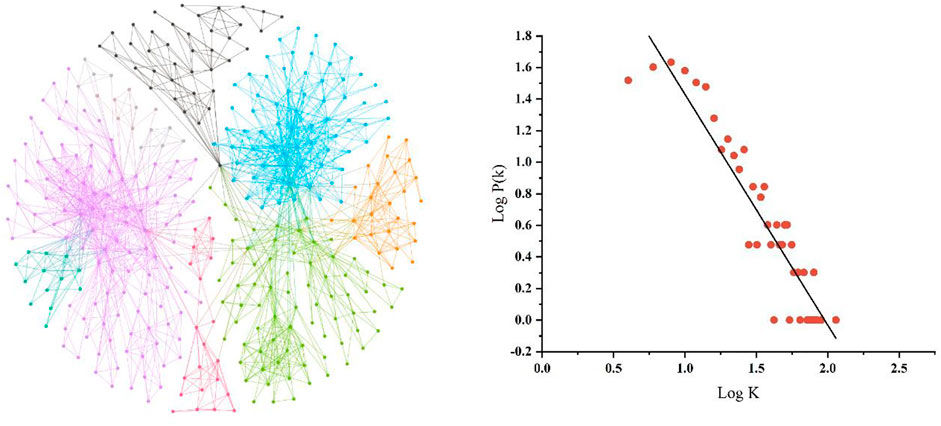
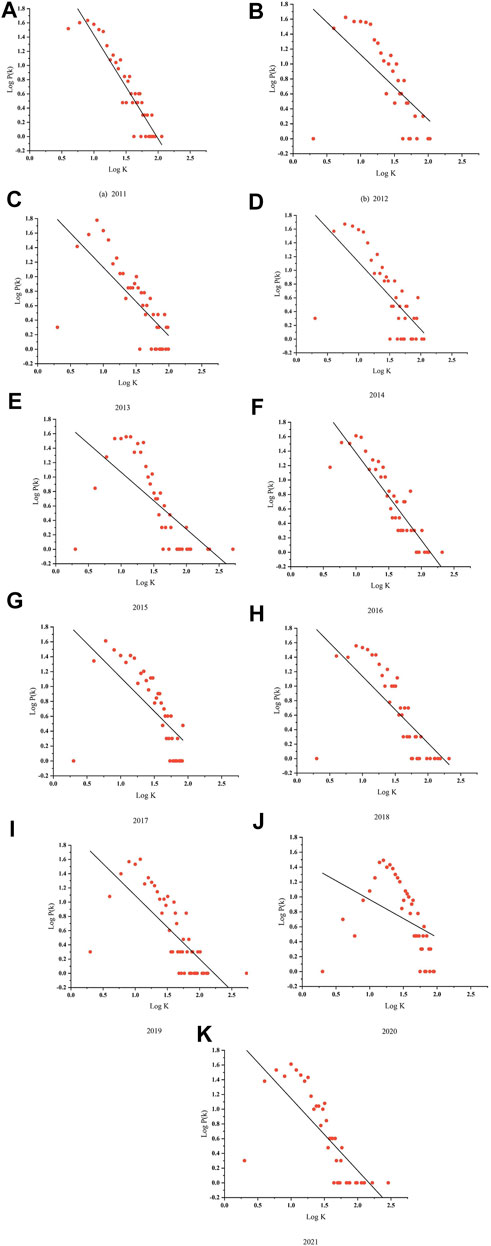
Figure 5 shows the visual and degree distribution of the complex network of the Sino-U.S. relations search index in 2011, while Figure 6 shows the degree distribution from the year of 2012–2022. The visual network of Sino-U.S. relations is a scale-free network. In this network, there are more time nodes with fewer consecutive edges, and a small proportion of nodes with large degree values. Meanwhile, with the increase of degrees, the number of nodes decreases. This reflects the volatility of the original time series. The degree distribution shows that the Baidu Searching Index of Sino-U.S. relations is a fractal time series with long-term correlation. On the one hand, the original time series have statistical similarities in different time ranges, such as days, weeks, months, etc.; On the other hand, due to the long-term correlation, the change in the Baidu search index of future Sino-U.S. relations may be like some past period.
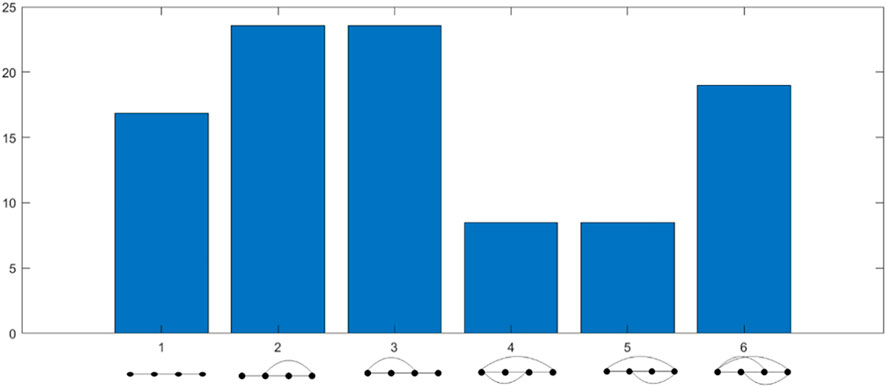
Furthermore, we also try to investigate the distribution of the motifs in the derived networks for the considered Sino-U.S. relation datasets. Here, we mainly consider the 4-motif. Corresponding results are provided in Figure 7. As presented, we find that the number of the second type motif equals to that for the third type motif. Similarly, the number of fourth motif are equivalent to the fifth motif. This shows that the number of Chinese searches for Sino US relations is highly relevant in terms of time.
4 Conclusion
This paper transforms the time series data from Baidu searching index of the keyword “Sino-U.S. relations” from 2011 to 2021 into a viewable graph. After deriving the networks, we can easily study corresponding dynamic characteristics. The results provide a new perspective for analyzing the time series characteristics of Sino-U.S. relations. The network constructed by using the viewable algorithm in this paper is a directionless and authoritarian network, which lost some information of the original time series data during the conversion process, resulting in its inability to analyze the change characteristics of the time series. Therefore, other methods for analyzing the changing characteristics of the time series can be selected for optimization in the future for a better result.
For the analyzing method, we suppose the choosing of the keyword in the searching engine is quite tricky. On the one hand, this keyword cannot be too narrow and obscure, keywords like terminologies are not appropriate; on the other hand, the keywords which are too broad do not have representativeness. Therefore, in order to fetching the most valuable data for analysis, it is important to choose the keywords more precisely. Based on the keyword of “Sino-U.S.,” we can draw the conclusion that only when China and the United States deeply understand each other’s differences and promote exchanges and cooperation, both countries can avoid conflicts. This study also provides a historical diagnosis for the development of Sino-U.S. relations. The other researches related to this topic can be explored in other aspects based on more specific time series data.
Data availability statement
The raw data supporting the conclusion of this article will be made available by the authors, without undue reservation.
Author contributions
JC proposed the question and method, WW collected the data and produced all figures, LW finished the manuscript, all authors confirmed the final version of the paper.
Funding
This work was supported in part by the Research Funds for Philosophy and Social Science Disciplinary Subject under Grant 21GH031111, Northwestern Polytechnical University.
Conflict of interest
The authors declare that the research was conducted in the absence of any commercial or financial relationships that could be construed as a potential conflict of interest.
Publisher’s note
All claims expressed in this article are solely those of the authors and do not necessarily represent those of their affiliated organizations, or those of the publisher, the editors and the reviewers. Any product that may be evaluated in this article, or claim that may be made by its manufacturer, is not guaranteed or endorsed by the publisher.
References
1. Su CW, Song Y, Tao R, Hao LN. Does political conflict affect bilateral trade or vice versa? Evidence from sino-US relations [J]. Econ research-Ekonomska istraživanja (2020) 33(1):3238–57. doi:10.1080/1331677x.2019.1694559
2. Wang H, Ge Y. Negotiating national identities in conflict situations: The discursive reproduction of the Sino-US trade war in China’s news reports. Discourse Commun (2020) 14(1):65–83. doi:10.1177/1750481319893406
3. Wang Y, Chen D. Rising Sino-U.S. Competition in artificial intelligence. China Q Int Strateg Stud (2018) 4(02):241–58. doi:10.1142/s2377740018500148
4. Zhu Q, Long K. How will artificial intelligence impact sino–US relations? [j]. China Int Strategy Rev (2019) 1(1):139–51. doi:10.1007/s42533-019-00008-9
5. Zhu P, Wang X, Li S, Guo Y, Wang Z, Investigation of epidemic spreading process on multiplex networks by incorporating fatal properties. Appl Math Comput (2019) 359: 512, doi:10.1016/j.amc.2019.02.049
6. Wu Z. Towards naval normalcy: 'open seas protection' and sino-US maritime relations. Pac Rev (2019) 32(4):666–93. doi:10.1080/09512748.2018.1553890
7. Voloshina A. Sino-US relations: Evolution from 2008 to 2021[J]. USA Can ekonomika, politika, kultura (2021) 2021(8):97–107. doi:10.31857/S268667300016030-3
8. Albert R, Barabási AL. Statistical mechanics of complex networks. Rev Mod Phys (2002) 74(1):47–97. doi:10.1103/revmodphys.74.47
9. Wang JB, Wang L, Li X. Identifying spatial invasion of pandemics on metapopulation networks via anatomizing arrival history. IEEE Trans Cybern (2016) 46(12):2782–95. Epub 2015 Nov 9. PMID: 26571544; PMCID: PMC7186038. doi:10.1109/TCYB.2015.2489702
10. Qi L, Cheng L, Wang W, Li X, Li S, Zhu P. Influence maximization through exploring structural information. Appl Math Comput (2023) 442:127721. doi:10.1016/j.amc.2022.127721
11. Wang J -B, Li X. Uncovering spatial invasion on metapopulation networks with SIR epidemics. IEEE Trans Netw Sci Eng (2019) 6(4):788–800. doi:10.1109/TNSE.2018.2873609
12. Zhu P, Cheng L, Gao C, Wang Z, Li X. Locating multi-sources in social networks with a low infection rate. IEEE Trans Netw Sci Eng (2022) 9(3):1853–65. doi:10.1109/tnse.2022.3153968
13. Iacovacci J, Lacasa L. Sequential motif profile of natural visibility graphs. Phys Rev E (2016) 94(5):052309. doi:10.1103/physreve.94.052309
14. Cheng L, Li X, Han Z, Luo T, Ma L, Zhu P. Path-based multi-sources localization in multiplex networks. J Chaos, Solitons Fractals (2022) 159:112139. doi:10.1016/j.chaos.2022.112139
15. Lacasa L, Luque B, Ballesteros F, Luque J, Nuno JC. From time series to complex networks: The visibility graph. Proc Natl Acad Sci (2008) 105(13):4972–5. doi:10.1073/pnas.0709247105
16. Hu J, Chen J, Zhu P, Wang M, Li H, Liu N Difference and cluster analysis on the carbon dioxide emissions in China during COVID-19 lockdown via a complex network model [J]. Front Psychol (2022) 2022:6410. doi:10.3389/fpsyg.2021.795142
17. Hu J, Xia C, Li H, Zhu P, Xiong W. Properties and structural analyses of USA’s regional electricity market: A visibility graph network approach. Appl Math Comput (2020) 385:125434. doi:10.1016/j.amc.2020.125434
18. Hu J, Zhang Y, Wu P, Li H. An analysis of the global fuel-trading market based on the visibility graph approach. J Chaos, Solitons Fractals (2022) 154:111613. doi:10.1016/j.chaos.2021.111613
19. Qiao HH, Deng ZH, Li HJ, Hu J, Song Q, Gao L. Research on historical phase division of terrorism: An analysis method by time series complex network. Neurocomputing (2021) 420:246–65. doi:10.1016/j.neucom.2020.07.125
20. Zhang J, Sun J, Luo X, Zhang K, Nakamura T, Small M. Characterizing pseudoperiodic time series through the complex network approach. Physica D: Nonlinear Phenomena (2008) 237(22):2856–65. doi:10.1016/j.physd.2008.05.008
21. Xu X, Zhang J, Small M. Superfamily phenomena and motifs of networks induced from time series. Proc Natl Acad Sci (2008) 105(50):19601–5. doi:10.1073/pnas.0806082105
22. Marwan N, Donges JF, Zou Y, Donner RV, Kurths J. Complex network approach for recurrence analysis of time series. Phys Lett A (2009) 373(46):4246–54. doi:10.1016/j.physleta.2009.09.042
23. Donner RV, Zou Y, Donges JF, Marwan N, Kurths J. Recurrence networks—A novel paradigm for nonlinear time series analysis. New J Phys (2010) 12(3):033025. doi:10.1088/1367-2630/12/3/033025
24. Li X, Yang D, Liu X, Wu XM. Bridging time series dynamics and complex network theory with application to electrocardiogram analysis. IEEE circuits Syst Mag (2012) 12(4):33–46. doi:10.1109/mcas.2012.2221521
25. Gao ZK, Cai Q, Yang YX, Dang WD, Zhang SS. Multiscale limited penetrable horizontal visibility graph for analyzing nonlinear time series[J]. Scientific Rep (2016) 6(1):1–7.
26. Zou Y, Donner RV, Marwan N, Donges JF, Kurths J. Complex network approaches to nonlinear time series analysis. Phys Rep (2019) 787:1–97. doi:10.1016/j.physrep.2018.10.005
27. Yang Y, Wang J, Yang H, Mang J. Visibility graph approach to exchange rate series. Physica A: Stat Mech its Appl (2009) 388:4431–7. doi:10.1016/j.physa.2009.07.016
Keywords: Sino-U.S. relationship, visual graph, complex network, social behaivor, geopolitics
Citation: Chen J, Wang L and Weng W (2023) Investigating the searching behavior of Sino-U.S. relations in China based on complex network. Front. Phys. 11:1021565. doi: 10.3389/fphy.2023.1021565
Received: 17 August 2022; Accepted: 30 January 2023;
Published: 02 March 2023.
Edited by:
Jianrong Wang, Shanxi University, ChinaReviewed by:
Jun Hu, Rey Juan Carlos University, SpainManman Yuan, University of Science and Technology Beijing, China
Copyright © 2023 Chen, Wang and Weng. This is an open-access article distributed under the terms of the Creative Commons Attribution License (CC BY). The use, distribution or reproduction in other forums is permitted, provided the original author(s) and the copyright owner(s) are credited and that the original publication in this journal is cited, in accordance with accepted academic practice. No use, distribution or reproduction is permitted which does not comply with these terms.
*Correspondence: Jun Chen, ZGVsbG9oYW44MTVAZ21haWwuY29t
 Jun Chen
 Lei Wang2
 Wuyan Weng